Add a Reference Line to a Visualization
Reference lines enable you to compare data points to the overall dataset and establish a baseline. This enables you to identify thresholds, targets, and outliers in your data.
You can use measure, attribute, date, and derived date columns to create reference lines and bands.
You can bind a parameter to a reference line value or a reference band range in a visualization when you want to use a parameter value to place the reference line or band on the visualization. See Bind a Parameter to a Reference Line or Band.
- On your home page, hover over a workbook, click Actions, then select Open.
- In the Data panel, click Analytics
 .
. - Click Add Statistics
 , and select Reference Line.
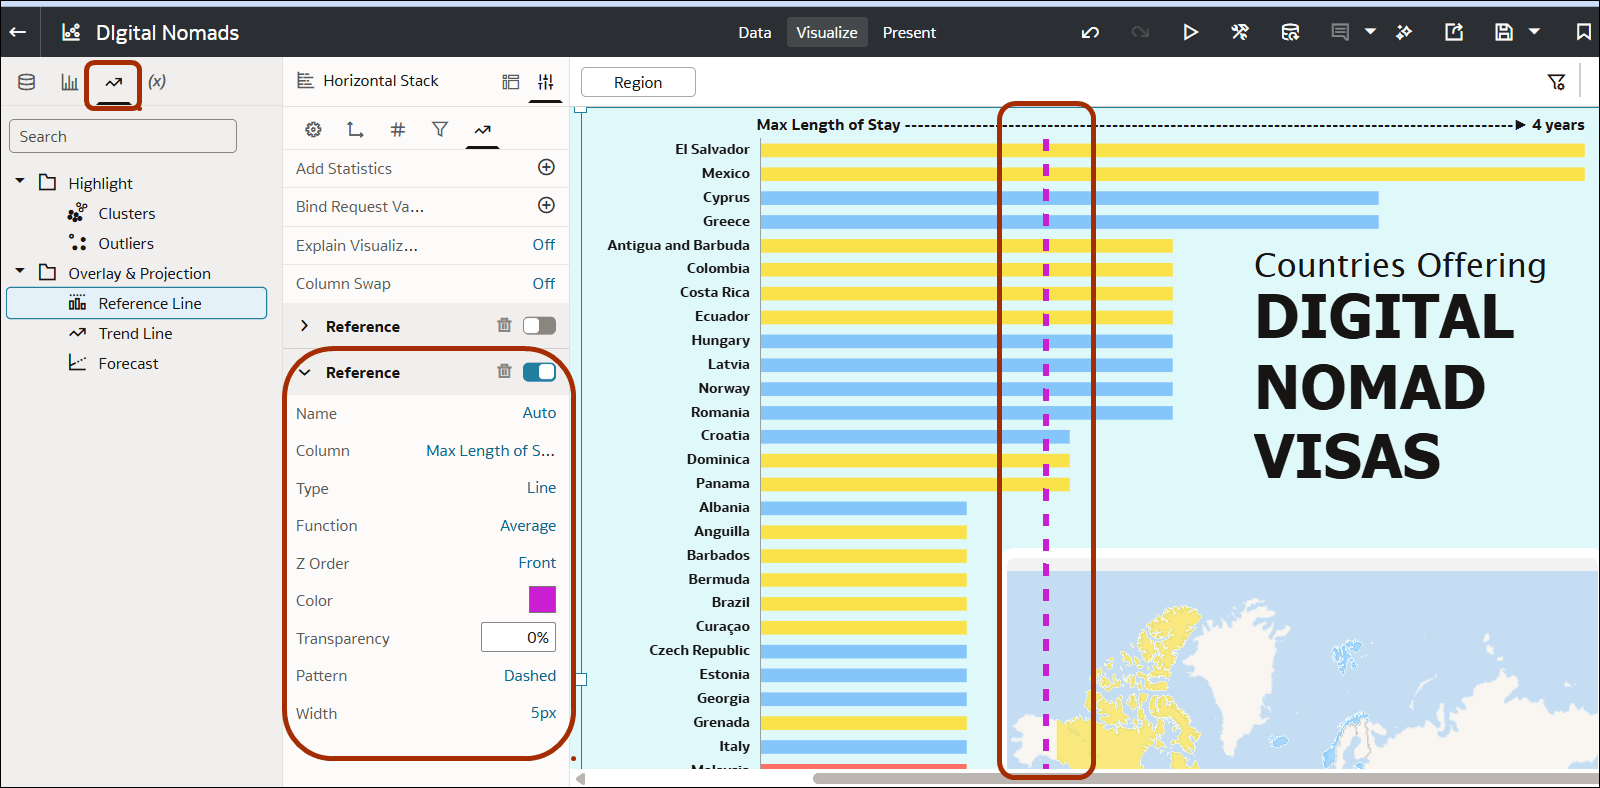
 - Use the Reference pane on the Grammar Panel to configure the reference line:
- Column - Select a measure, date, or non-date attribute that's displayed in the visualization. For example, to specify a fixed target or threshold, use Column to specify a measure, select Constant as the Function, then specify a target or threshold number in the Value field.
- Type - Select Line to display a single threshold as a dotted line, for example, an average value. Or select Band to display the threshold as a range between two values that you specify using Start Function and End Function. For example, to display a band between 500,000 and 750,000 choose Constant for Start Function and specify 500,000, and choose Constant for End Function and specify 750,000. You can also mix and match the start and end functions, For example, you might specify Top N as the top of the band and a constant value for the bottom of the band.
- Function - Select the reference line that's most useful for comparing the values in your visualization, such as Average, Median, Percentile, or Top N. For example, if your data is skewed, you might use Percentile to show how measure values compare to 90% of the dataset.
- Z Order - Specify whether your reference line is drawn in front of Front or behind Behind other chart elements.
- If you select a non-date attribute column, for example City, you can choose a Value, for example Chicago, on which to display the reference line.
- Other options - Use these to change the default style for the reference line, for example, color, transparency, or width.
- Click Save.
