3.3 Monitoring Pipelines from the Spark Console
You can monitor the pipelines running in local Spark cluster from the Spark Console.
To open the Spark console, type https://<IP_of_Instance/spark> in a Chrome browser, enter the Spark user and password you used in the Securing your GGSA Instance section. You will see a list of Running and Completed applications.
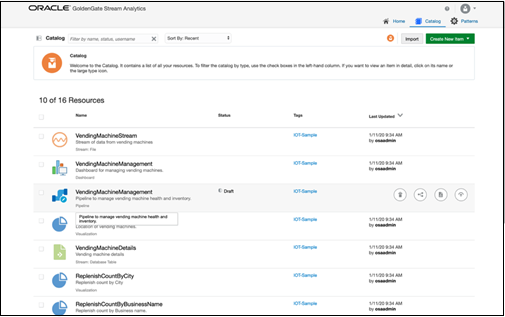
Pipelines in a Draft state are automatically undeployed after exiting the Pipeline editor, while pipelines in Published state continue to run as shown in the screenshot below.

Pipelines in a Draft state end with the suffix _draft. The Duration column indicates the duration for which the pipeline has been running.
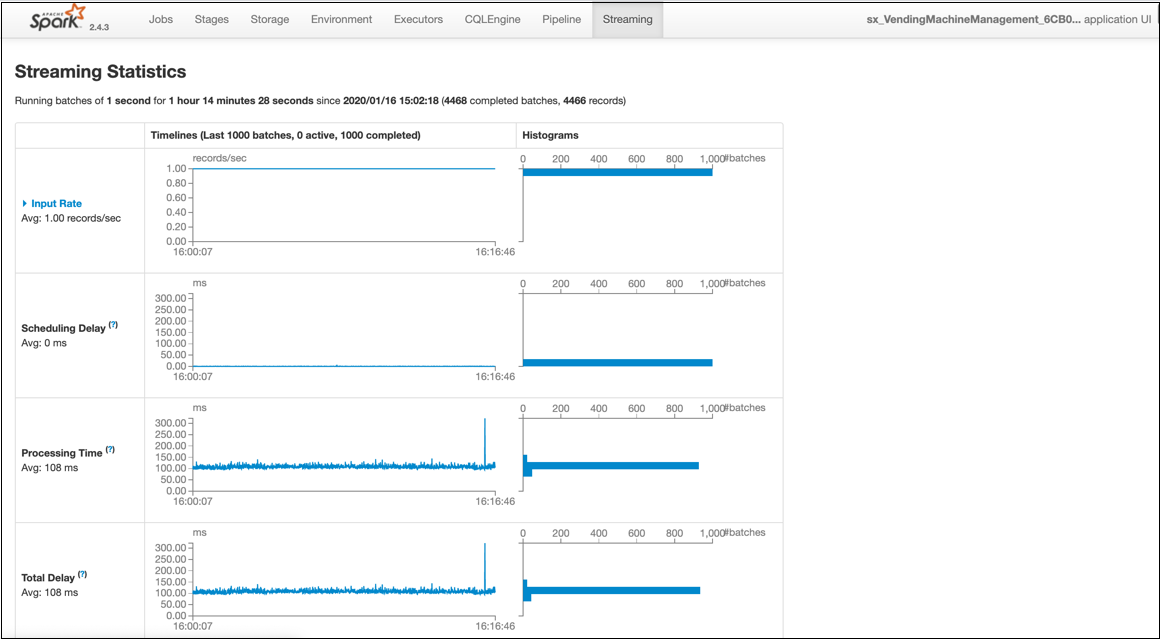
You can also view the Streaming statistics by clicking App ID-> Application Detail UI -> Streaming.

The Streaming statistic page displays the data ingestion rate, processing time for a micro-batch, scheduling delay, etc. For more information on these metrics, please refer to the Spark documentation.