12 Monitoring Performance and Logs with Fusion Middleware Control
Live, dynamic performance metrics can be viewed in Fusion Middleware Control.
You can monitor performance and log messages for Access Manager using Oracle Fusion Middleware Control. This chapter focuses on general tasks that Administrators can perform from Fusion Middleware Control, which does not replace details in Overview of Oracle Fusion Middleware Administration Tools in Administering Oracle Fusion Middleware.
Note:
Unless explicitly stated, information in this chapter is the same for both services. There are no metrics in Oracle Fusion Middleware Control for Identity Federation.
This chapter includes the following topics.
12.1 Introduction to Fusion Middleware Control
Within Fusion Middleware Control, information is updated dynamically during live sessions of Access Manager and other products. Fusion Middleware Control organizes a wide variety of performance data and administrative functions into distinct Web-based pages. This helps Administrators easily locate the most important monitoring data and the most commonly used administrative functions from a Web browser.
Note:
Enterprise Manager Grid Control is an independently licensed product that provides additional capabilities not found in Fusion Middleware Control (primarily, the ability to collect and maintain data for historical purposes and trending).
Oracle Access Management 12c is deployed as a Java EE application in a WebLogic container. For high availability and failover, Oracle Access Management is typically deployed in a WebLogic cluster environment.
A WebLogic Server domain can have multiple clusters. To provide monitoring and performance statistics for all clustered components requires a composite target. This target provides status and rolled-up load and response performance metrics for member instances. In addition to the metrics exposed for Access Manager and Security Token Service, generic performance metrics are also available for Java EE application and composite Java EE applications.
Fusion Middleware Control must be deployed with Oracle Access Management on the WebLogic Administration Server, as illustrated in Figure 12-1 (and described in the Installing and Configuring Oracle Identity and Access Management).
Figure 12-1 Fusion Middleware Control (AS-Control) Deployment Architecture
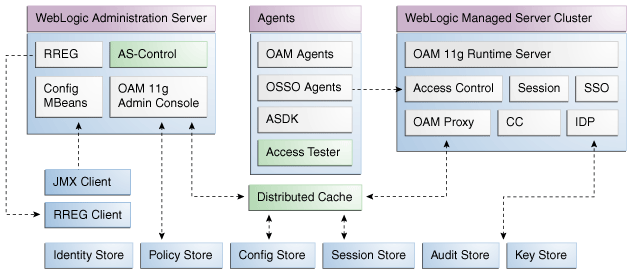
Description of "Figure 12-1 Fusion Middleware Control (AS-Control) Deployment Architecture "
Using Fusion Middleware Control for targets is supported through the Oracle Dynamic Monitoring Systems instrumentation within Oracle Access Management. This instrumentation is used to provide:
-
Performance overview and drill down
-
Log message searches and dynamic log level changes
-
Routing topology overview
-
Mbean browser
-
Component- and cluster-level metrics for Access Manager with Security Token Service
12.2 Logging In to and Out of Fusion Middleware Control
The Fusion Middleware Control Login page provides the usual fields for the User Name and Password.
The bottom of the Fusion Middleware Control Login page provides topics that you can click for additional information. This section provides the following topics:
12.2.1 Logging In To Fusion Middleware Control
Only Fusion Middleware Control Administrators log in to Fusion Middleware Control.
See Also:
Oracle Fusion Middleware Administrator's Guide for details about getting started using Fusion Middleware Control
12.3 Displaying Menus and Pages in Fusion Middleware Control
Fusion Middleware Control displays OAM Farm page and associated information, summary, and cluster or server pages.
This section provides the following topics for Access Manager and Security Token Service:
See Also:
Oracle Fusion Middleware Administrator's Guide for details about getting started using Fusion Middleware Control
12.3.1 Farm Page in Fusion Middleware Control
Each OAM Farm page in Fusion Middleware Controlincludes similar information.
Figure 12-2 illustrates the OAM Farm page in Fusion Middleware Control. The Farm Resource Center provides immediate access to online information.
Figure 12-2 OAM Farm Page in Fusion Middleware Control
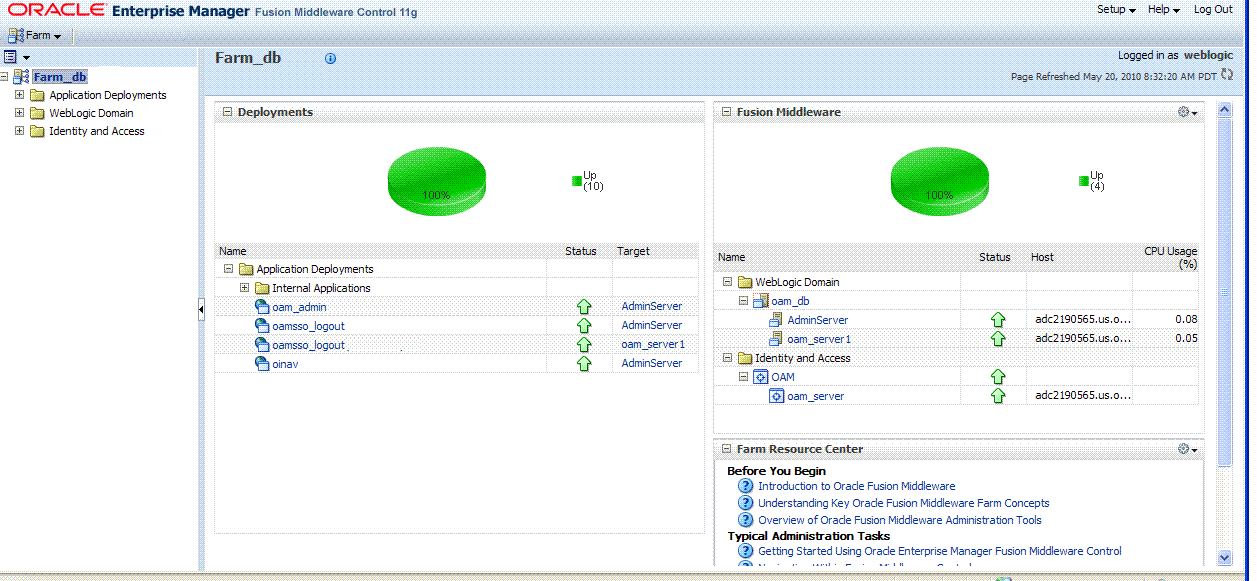
Description of "Figure 12-2 OAM Farm Page in Fusion Middleware Control"
Sections on the Farm page are described in Table 12-1.
Table 12-1 Farm Page Sections
| Farm Page Sections | Description |
|---|---|
|
Deployments |
Within the farm, this section displays the Status and Target of each Internal Application within the Application Deployment. Clicking any link in the Deployments section (or in the navigation tree) displays a page containing more information. |
|
Fusion Middleware |
Within the farm, this section displays the status, host, and CPU usage for server instances in the:
Clicking any link on the page (or in the navigation tree) displays a page containing a more detailed summary. |
|
Farm Resource Center |
Provides a wealth of online information in the following categories:
Clicking any link in the resource center displays information on the chosen subject. With a wealth of information online, these details are not repeated in this book. |
The navigation tree on the left side of the page, like the one in Figure 12-3, enables you to choose a specific instance (target) on which to operate regardless of the page you are currently viewing. Target names in your environment will be different.
Figure 12-3 Farm Navigation Tree in Fusion Middleware Control
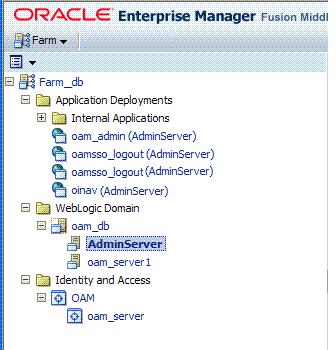
Description of "Figure 12-3 Farm Navigation Tree in Fusion Middleware Control"
For more information, see "Logging In To Fusion Middleware Control".
12.3.2 Context Menus and Pages in Fusion Middleware Control
For Oracle Access Management, Farm details in Fusion Middleware Control are divided into four nodes within the navigation tree.
The nodes are:
-
Application Deployments
-
Internal Applications (includes logout page and other details for the OAM AdminServer and OAM Server instances)
-
WebLogic Server domains (WebLogic Server details, including the OAM Farm)
-
Identity and Access (includes OAN Cluster or individual OAM Server instances)
Clicking a node in the navigation tree displays an information page with individual links and a description of the Target, Type, and Full Name, as shown in Figure 12-4 for Application Deployments.
Figure 12-4 Node Information Page in Fusion Middleware Control

Description of "Figure 12-4 Node Information Page in Fusion Middleware Control"
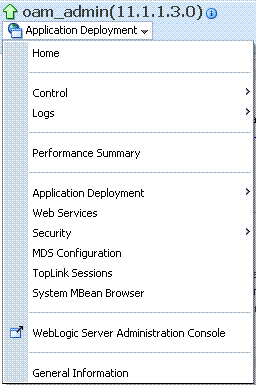
Clicking an instance (target) name (from either the navigation tree or a page), displays a context menu and a more detailed summary page. The Internal Application target is highlighted in the navigation tree and a page of the same name is displayed on the right. The context menu is available beneath the target name at the top of the page, as shown in Figure 12-5.
Figure 12-5 Application Deployment Summary for the Selected Internal Application
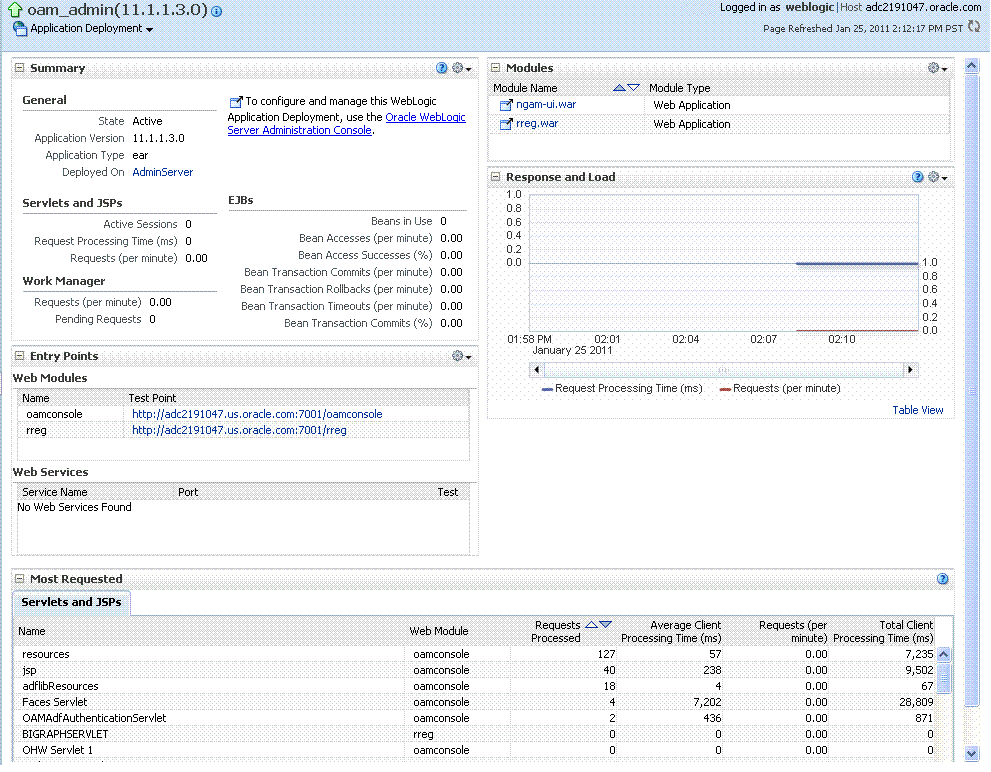
Description of "Figure 12-5 Application Deployment Summary for the Selected Internal Application"
The Application Deployment menu is shown in Figure 12-6.
WebLogic Server domain: The WebLogic Server domain page is shown in Figure 12-7 with the corresponding menu displayed. The Oracle WebLogic Server domain Resource Center, with links to online documentation, is visible in the bottom-left corner. This page more closely resembles the Farm landing page.
Figure 12-7 WebLogic Server Domain Summary with Context Menu Exposed
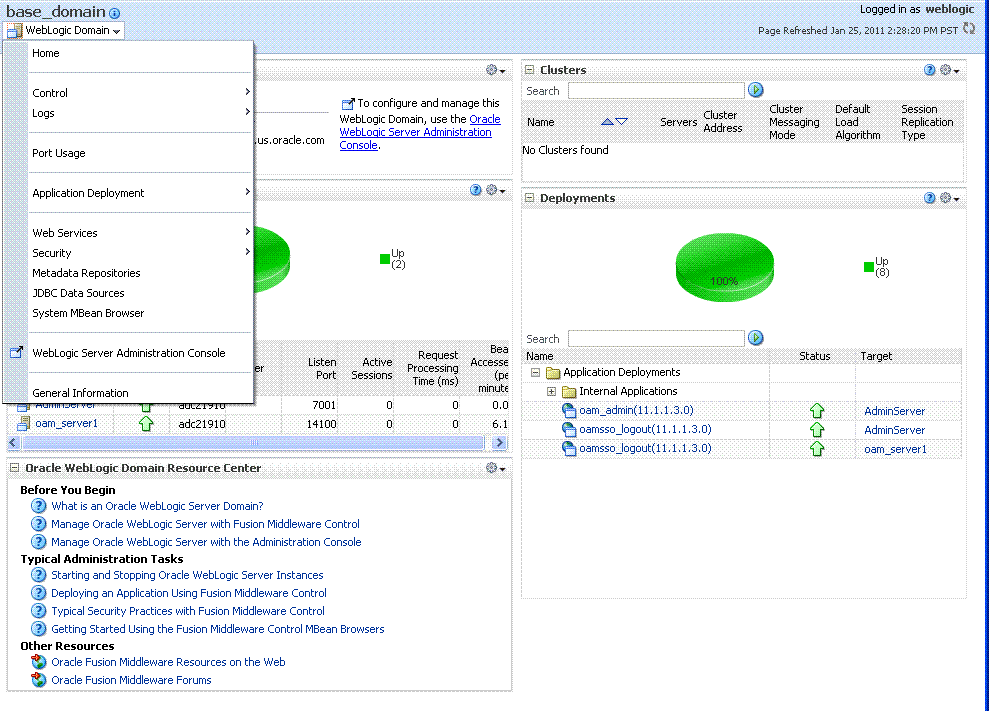
Description of "Figure 12-7 WebLogic Server Domain Summary with Context Menu Exposed"
Selecting a target name within the WebLogic Server domain node displays a target summary page that more closely resembles the Application Deployment page in Figure 12-5.
For more information, see "Displaying Context Menus and Target Details in Fusion Middleware Control".
See Also:
"Viewing Performance in Fusion Middleware Control" for information about the Identity and Access node and related pages.
12.3.3 Displaying Context Menus and Target Details in Fusion Middleware Control
Fusion Middleware Control Administrators can view context menus and target pages.
Note:
From the Farm Resource Center on the OAM Farm page, choose topics of interest (or click Help in the upper-right corner of the page) to get more information.
12.4 Viewing Performance in Fusion Middleware Control
Fusion Middleware Control provides various performance metrics for administrators.
The following sections provide more details:
12.4.1 Resulting Pages for Selected Nodes and Targets
Using Fusion Middleware Control, you can view performance metrics for live sessions in a variety of formats.
Fusion Middleware Control provides Administrators with:
-
A cluster-wide view of performance for Access Manager with Security Token Service
-
A per-server drill-down of key performance metrics
-
The ability to quickly add or remove performance metrics
Table 12-2 summarizes the pages for selected nodes and target instances.
Table 12-2 Resulting Pages for Selected Nodes and Targets
| Node | Target | Information Summary Page | Performance Overview | Performance Summary w/Metrics |
|---|---|---|---|---|
|
Application Deployment Internal Applications |
...AdminServer oamsso_logout AdminServer oamsso_logout oam_server |
Yes Yes Yes |
No No No |
Yes Yes Yes |
|
WebLogic Server domain |
oam_bd (Cluster name) AdminServer oam_server |
Yes Yes Yes |
No No No |
No Yes Yes |
|
Identity and Access |
OAM (Cluster) oam_server (Server) |
No No |
Yes Yes |
Yes Yes |
Note:
Security Token Service performance is included with relevant OAM Cluster and Server pages.
12.4.2 Performance Overview Pages in Fusion Middleware Control
The Fusion Middleware Control Performance Overview can be used to reflect WebLogic cluster information down to specific performance metrics for individual Cluster and Server targets.
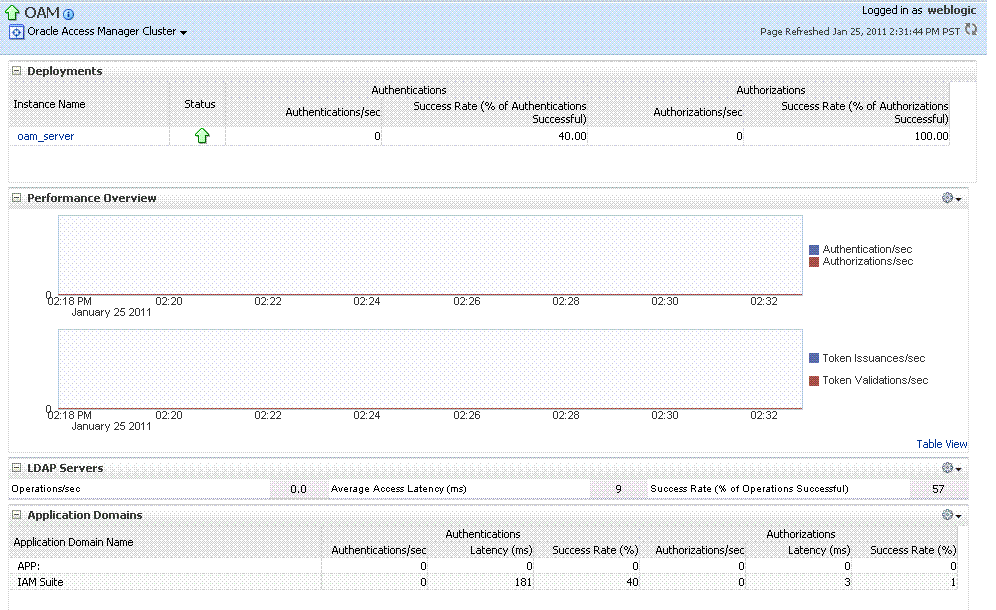
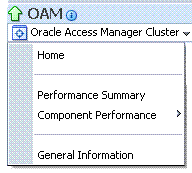
Cluster Page: The top node within Identity and Access leads to a page for the OAM Cluster Deployment, which includes a Performance Overview. For Figure 12-8, the Cluster is selected in the navigation tree, beneath the Identity and Access node. Figure 12-8 illustrates the Cluster Deployments and Performance Overview sections. This page includes a table for Token Issuance and Token Validations.
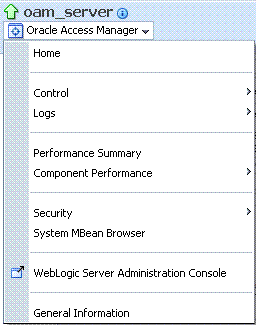
OAM Server Pages: Selecting an OAM Server target name from the navigation tree (or the open page), displays a Performance Overview for the target. At the top of the OAM Server page, a summary of Key Metrics for the server instances appears instead of the Cluster Deployment section. Figure 12-9 illustrates the OAM Server instance Key Metrics, which include Token Issuance and Token Validations per second. The Token Validation success rate is included.
Table 12-3 describes the elements of the Performance Overview for Clusters and OAM Server instances in Fusion Middleware Control. There are only a few differences.
Table 12-3 Summary of Performance Overviews in Fusion Middleware Control
| Section or Column Name | Description |
|---|---|
|
Cluster Menu |
Dynamic context menus provide functions related to the selected target (also available when you right-click a target in the navigation tree). This menu is available for the selected Cluster. The Component Performance command enables you to choose between displaying Access Manager or Security Token Service metrics. |
|
Deployments, OAM Cluster pages |
This section appears only on OAM Cluster pages. It describes the status of each instance in the cluster. The following information is included:
|
|
Instance Name |
This column includes the name of each OAM Server instance in the cluster. For example: OAM_server_name |
|
Status |
This column identifies the status of each OAM Server instance in the cluster with either a:
|
|
Authentications |
Authentications columns identify:
|
|
Authorizations |
This column identifies the number of authorizations per second for each OAM Server instance in the cluster. Authorizations columns identify:
|
|
Server Instance Menu |
Dynamic context menus provide functions related to the selected target (also available when you right-click a target in the navigation tree). This menu is available for the selected server instance. The Component Performance command enables you to choose between displaying specific Access Manager or Security Token Service metrics. |
|
Key Metrics, OAM Server Page |
This table provides a summary of statistics for only the selected OAM Server instance. Key metrics include details for both Access Manager and Security Token Service:
|
|
Performance Overview, OAM Cluster and OAM Server Pages |
This section provides a graphic representations of Access Manager authentication and authorization operations and Security Token Service Token Issuance and Token Validation operations. Metrics in the Performance Overview are not configurable. The Metrics Palette is available for only the Performance Summary. Whether you have an OAM Cluster or OAM Server instance selected, the Performance Overview includes:
Within each table:
|
|
Table View |
Click the Table View link on the bottom-right side of the Performance Overview to display performance information in columns within a pop up window. |
|
LDAP Servers, OAM Cluster and OAM Server Pages |
This section is available when either an OAM Cluster or a single OAM Server instance is selected. It provides information for the default LDAP user identity store:
|
|
Application Domains, OAM Cluster and OAM Server Pages |
This section of the OAM Cluster and OAM Server pages provides information for all Application Domains that were used during authentication and authorization processing. Columns in this section provide the:
|
12.4.2.1 Access Manager Component Pages
The Component Performance command on both the Cluster and Server instance menus enables you to display Access Manager-specific metrics.
Cluster component-specific metrics are aggregated across the cluster, illustrated in Figure 12-10. Details follow in Table 12-4.
Figure 12-10 Aggregated Access Manager Component Metrics for the Cluster

Description of "Figure 12-10 Aggregated Access Manager Component Metrics for the Cluster"
Figure 12-11 illustrates the Access Manager component metrics for a single OAM Server instance.
Figure 12-11 Access Manager Component Metrics for a Single OAM Server Instance

Description of "Figure 12-11 Access Manager Component Metrics for a Single OAM Server Instance"
Table 12-4 describes the component-specific metrics for Access Manager.
Table 12-4 Access Manager Component Metrics
| Access Manager Metrics | Description |
|---|---|
|
Access Manager Clients |
Based on your selection (Cluster or Server instance), this page provides information for all active Access Clients in a cluster (or for the active Access Clients of an individual OAM Server). Details include:
|
|
Client ID |
Displays the name of the Agent, as defined in the Agent registration in the Oracle Access Management Console. |
|
Type |
Displays the Agent. type For example: OAM Webgate |
|
Authentications |
Authentications columns identify:
|
|
Authorizations |
Authorizations columns identify:
|
12.4.3 Metrics Palette and the Performance Summary Page
The Performance Summary command on the Cluster or Server menu displays metrics charts for the selected target.
On the Performance Summary page, a chart is displayed for each selected metric. An OAM Server Performance Summary page. Figure 12-13 shows the Performance Summary page with an open Metric Palette from which you can choose metrics to chart. Stacked charts allow you to easily compare multiple metrics for the same time frame, change the time frame to go back in time, or zoom in or out.
Figure 12-13 Performance Summary Page with Metric Palette
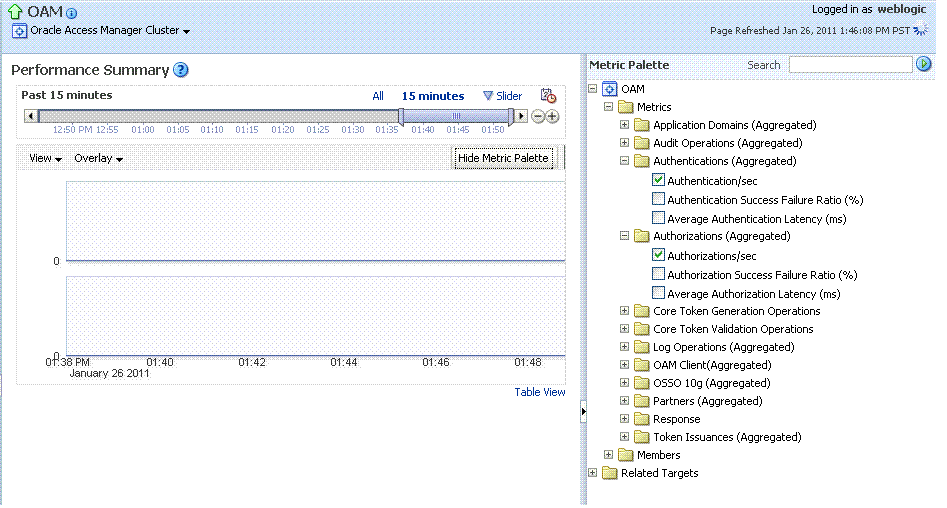
Description of "Figure 12-13 Performance Summary Page with Metric Palette "
Table 12-5 describes the status and controls available on the Performance Summary page.
Table 12-5 Status and Controls on Performance Summary Pages
| Status or Control | Description |
|---|---|
|
Past n minutes |
Status is based on the specified time period, which can be adjusted using the slider. |
|
All |
|
|
n Minutes |
The specified time period, which can be adjusted using the slider. |
|
Slider |
The tool you use to adjust the time period. |
|
Chart Set |
A list from which you can choose the set of saved charts to view. |
|
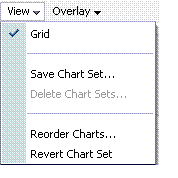
View |
A menu that enables you to add a grid, save a chart, and order information on the page. |
|
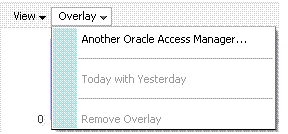
Overlay |
A menu that enables you to search for and view another instance of the same type and compare this against the instance in the summary. |
|
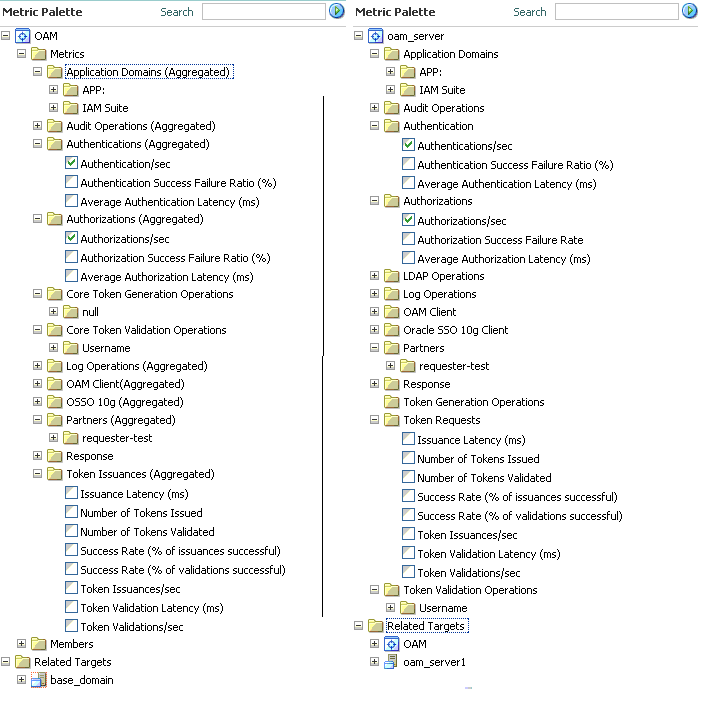
Metric Palette |
A listing from which you can select performance metrics to chart. Items unique to Access Manager and Security Token Service are shown here. Left: Metric Palette for the Cluster Right: Metric Palette for a Single OAM Server |
12.4.4 Displaying Performance Metrics in Fusion Middleware Control
Fusion Middleware Control Administrators can add or change the metrics that are displayed in the Performance Summary.
See Also:
-
Log in as described in "Logging In To Fusion Middleware Control".
-
Performance Overview:
-
Expand the desired node and select a target. For example: Identity and Access.
- Identity and Access
- oam_server
-
Review the Performance Overview.
-
-
Performance Summary:
-
Select a target (Step 1).
-
From the context menu, select Performance Summary.
-
Review the Summary Page.
-
-
Changing Metrics:
-
From the Performance Summary page (Step 2), click the Show Metrics Palette button.
-
From the Metrics Palette, expand nodes and check (or clear) boxes to add (or remove) metrics from the summary.
-
Review the updated the Summary page.
-
Click Hide Metrics Palette when you finish.
-
-
Saving a Chart Set:
-
From the View menu on the Performance Summary page, click Save Chart Set.
-
In the dialog box that appears, enter a unique name for this chart set and click OK when the operation is confirmed.
-
Click Hide Metrics Palette when you finish.
-
Review the updated information on the Summary Page.
-
-
Adding an Overlay, Access Manager:
-
From the Overlay menu on the Performance Summary page, click Another Oracle Access Manager.
-
In the Search and Select Targets dialog, enter the target name and host name, then click Go.
-
In the target results table, click the name of the desired target and then Select.
-
When finished viewing the overlay, click Remove Overlay from the Overlay menu.
-
-
Adding an Overlay, Today with Yesterday:
-
From the Overlay menu on the Performance Summary page, click Today with Yesterday.
-
When finished viewing the overlay, click Remove Overlay from the Overlay menu.
-
-
Testing:
-
Using the Access Tester, perform several authentication and authorization tests (see Validating Connectivity and Policies Using the Access Tester).
-
In Fusion Middleware Control, check performance metrics.
-
12.4.5 Displaying Component-Specific Performance Details
Fusion Middleware Control Administrators can use the following procedure to view and compare component-specific performance data.
See Also:
-
Log in as described in "Logging In To Fusion Middleware Control".
-
Expand the desired node and select a target. For example:
- Identity and Access
- oam_server
-
From the context menu, select Component Performance.
-
Choose Access Manager (or Security Token Service).
-
STS Partner ID: Choose a Partner ID in the Security Token Service results table for more details, if needed.
-
Component Performance:
-
From the context menu, select Component Performance.
-
Choose either Access Manager (or Security Token Service).
-
Choose an item in the results table to get more details, if available.
-
-
Testing:
-
Using the Access Tester, perform several authentication and authorization tests (see Validating Connectivity and Policies Using the Access Tester).
-
In Fusion Middleware Control, check performance metrics.
-
12.5 Managing Log Level Changes in Fusion Middleware Control
Oracle Fusion Middleware components generate log files containing messages that record all types of events.
Administrators can set log levels using Fusion Middleware Control, as described in this chapter.
Note:
Alternatively, Administrators can set OAM logger levels using custom WebLogic Scripting Tool (WLST) commands, as described in Logging Component Event Messages.
Topics in this section include:
12.5.1 Dynamic Log Level Changes in Fusion Middleware Control
Using Fusion Middleware Control, Administrators can change log levels dynamically for Access Manager (or Security Token Service).
Table 12-6 outlines log availability and functions in Fusion Middleware Control.
Table 12-6 OAM Log Availability and Functions in Fusion Middleware Control
| Node | Target | View Log Messages | Log Configuration |
|---|---|---|---|
|
Application Deployment Internal Applications |
...AdminServer oamsso_logout AdminServer oamsso_logout oam_server |
Yes Yes Yes |
Yes Yes Yes |
|
WebLogic Server domain |
oam_bd (Cluster name) AdminServer oam_server |
Yes Yes Yes |
No Yes Yes |
|
Identity and Access |
OAM (Cluster) oam_server (Server) |
No Yes |
No Yes |
Figure 12-14 shows the Log Levels configuration page in Fusion Middleware
Control. Notice that Runtime Loggers is the selected View and oracle.oam logger names are currently displayed. With Security Token Service there is only one logger that affects the log levels for Security Token Service: oracle.security.fed.
Figure 12-14 Access Manager Log Levels on the Log Configuration Tab
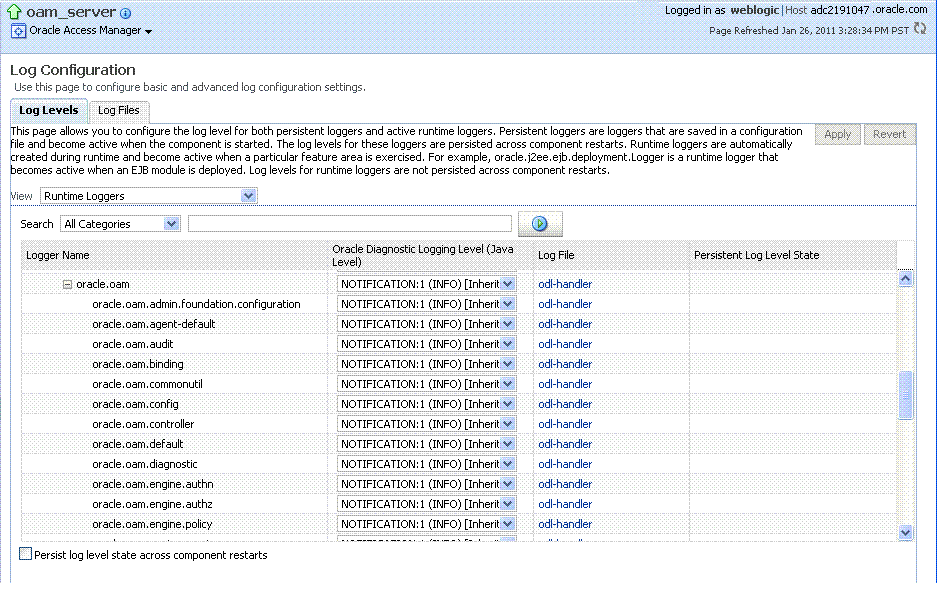
Description of "Figure 12-14 Access Manager Log Levels on the Log Configuration Tab"
Figure 12-15 Log Levels for Security Token Service
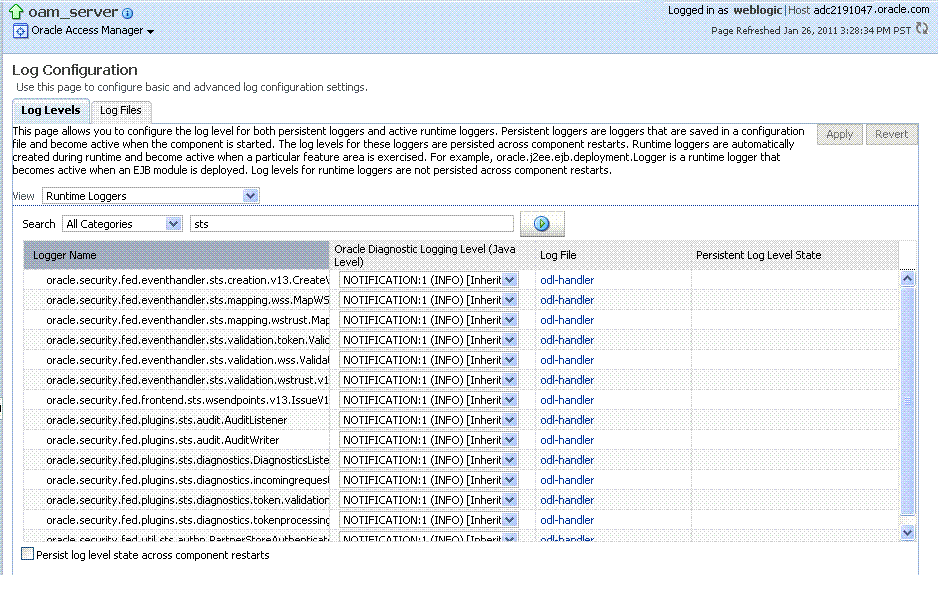
Description of "Figure 12-15 Log Levels for Security Token Service "
The Log Levels tab on the Log Configuration page allows you to configure the log level for both persistent loggers and active runtime loggers:
-
Persistent loggers are saved in a configuration file and become active when the component is started.
The log levels for these loggers are persisted across component restarts.
-
Runtime loggers are automatically created during runtime and become active when a particular feature area is exercised.
For example, oracle.j2ee.ejb.deployment.Logger is a runtime logger that becomes active when an EJB module is deployed. Log levels for runtime loggers are not persisted across component restarts.
Table 12-7 explains the configuration status and options for log levels.
Table 12-7 Log Levels Tab on Log Configuration Page
| Element | Description |
|---|---|
|
Apply |
Submits and applies log level configuration changes, which take affect immediately. |
|
Revert |
Restores the target's previous log level configuration, which take affect immediately. |
|
View |
Use this list to view runtime loggers or loggers with a persistent log level state.
|
|
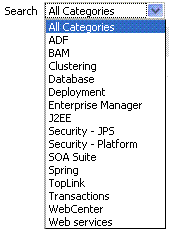
Search |
Use this list to specify the categories you would like to search. |
|
Table |
|
|
Logger Name |
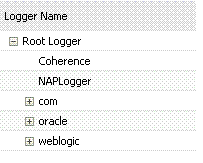
The name of the loggers found during the search. You can expand names in the list to see any loggers beneath the top node. |
|
Oracle Diagnostic Logging Level (Java Level) |
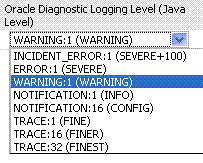
Choose the logging level for the corresponding logger; c. Click Apply and review confirmation messages displayed in a pop-up window:
|
|
Log File |
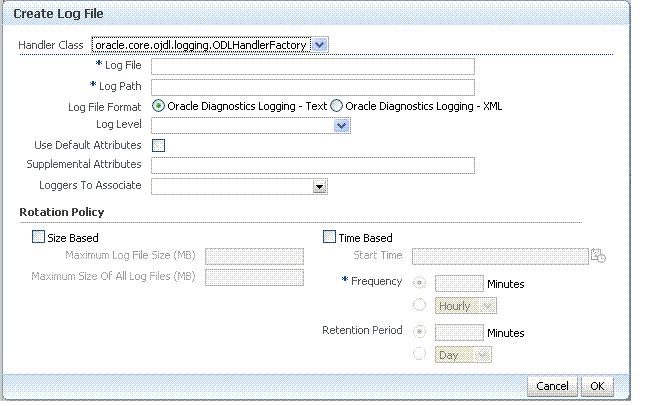
Clicking a name in the Log File column displays the Log Files page, which you can use to create and edit the file where log messages are logged, the format of the log messages, rotation policies, and other logging parameters. See Also: "Managing Log File Configuration from Fusion Middleware Control". |
|
Persistent Log Level State |
Identifies the persistent state for this specific logger, which is set when you create or edit the value using the Log Files tab. |
12.5.2 Setting Log Levels Dynamically Using Fusion Middleware Control
Fusion Middleware Control Administrators can set the log level dynamically.
Note:
Administrators can also set logger levels using custom WLST commands as described in Logging Component Event Messages.
12.6 Managing Log File Configuration from Fusion Middleware Control
Fusion Middleware Control Administrators can create, edit, or view the log file.
This section provides the following information:
12.6.1 Log File Configuration Page in Fusion Middleware Control
Table 12-7 shows the Log Files Configuration.
Table 12-8 describes the log files configuration parameters for Access Manager (or Security Token Service).
Table 12-8 Log Files Elements
| Element | Description |
|---|---|
|
Create |
Click this button to display the fresh form to create a new file for logged messages.
|
|
Create Like |
Click this button to display a partially filled-in form to create a new file for logged messages. |
|
Edit Configuration |
Click this button to display and edit the selected log file configuration. |
|
View Configuration |
Click this button to view a read-only description of the selected log file configuration. |
|
Table |
The information in this table is based on log file configuration parameters in this table. |
|
Handler Name |
The Log File name assigned during log file creation. |
|
Log Path |
The file system directory path assigned during log file creation. |
|
Log File Format |
The Log File format assigned during log file creation. |
|
Rotation Policy |
The rotation policy selected during log file creation. |
12.6.2 Managing Log Files with Fusion Middleware Control
Fusion Middleware Control Administrators can create a log file, edit the configuration, or view a read-only version of the log file configuration.
-
Log in as described in "Logging In To Fusion Middleware Control".
-
Expand the desired node, and select a target. For example:
- Identity and Access
- oam_server
-
From the Access Manager menu, select Logs and then Log Configuration.
-
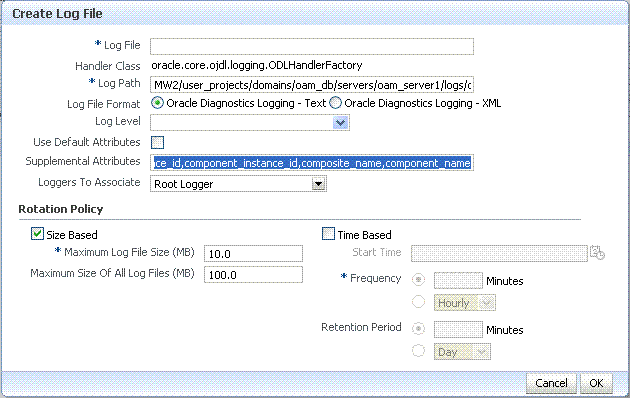
Create a Log File: From the Log Files tab (Table 12-8):
-
Click the Create button to display a fresh Create Log File form.
-
Enter a name and file system path for this log file. For example:
Log File
oam-odl-handlerLog Path domains
/oam_db/servers/oam-server1/log/oam.log -
Click the desired Log File Format. For example: ... Text
-
Set the logging attributes. For example:
Use Default Attributes
Supplemental Attributes
-
Associate a Logger. For example: Root Logger
-
Specify the Rotation Policy. For example: Size Based
Maximum Log File Size (MB)
10.0Maximum Size of All Log File Size (MB)
1000.0 -
Click OK to submit the configuration.
-
-
Create Like:
-
From the Log Files tab, click the name of an existing log file.
-
Click the Create Like button.
-
On the Create Log File form, enter your own information:
Log File name
Log Level
Attributes
-
Edit any other details as needed, then click OK to submit the configuration.
-
-
Edit Configuration:
-
From the Log Files tab, click the name of an existing log file.
-
Click the Edit Configuration button.
-
Change configuration details as needed.
-
Click OK to submit the changes.
-
-
View Configuration:
-
From the Log Files tab, click the name of an existing log file.
-
Click the View Configuration button.
-
Review the information, then click OK to dismiss the configuration page.
Contents are greyed out when opened for viewing configuration.
-
-
Proceed to "Viewing Log Messages in Fusion Middleware Control".
12.7 Viewing Log Messages in Fusion Middleware Control
Fusion Middleware Control Administrators can locate, view and export log messages for the target.
This section includes the following topics:
12.7.1 About Finding, Viewing, and Exporting Log Messages
By using the context menu for an OAM Server instance in Fusion Middleware Control, Administrators can locate, view, and export key log information.
The key log information can be managed for:
-
Application Deployment targets, including the WebLogic (and OAM) AdminServer and the OAM SSO logout pages on both AdminServer and OAM Servers
-
WebLogic Server domain targets, including the OAM Farm, AdminServer, and OAM Servers
-
Identity and Access targets, including the OAM Farm, Clusters, and individual OAM Servers
Using log files to troubleshoot common problems requires that you:
-
Get familiar with the Oracle Diagnostic Logging (ODL) format used by Oracle Fusion Middleware components. SeeAbout Diagnostic Log Files in Securing Applications with Oracle Platform Security Services
-
Configure log files to collect the appropriate level of information
-
Search, view and export key log information in the farm
-
Correlate messages in log files across components
12.7.1.1 Log Messages Page in Fusion MIddleware
Figure 12-17 shows the Log Messages page for Access Manager and Security Token Service in Fusion Middleware Control.
Figure 12-17 Typical Log Messages Page in Fusion Middleware Control
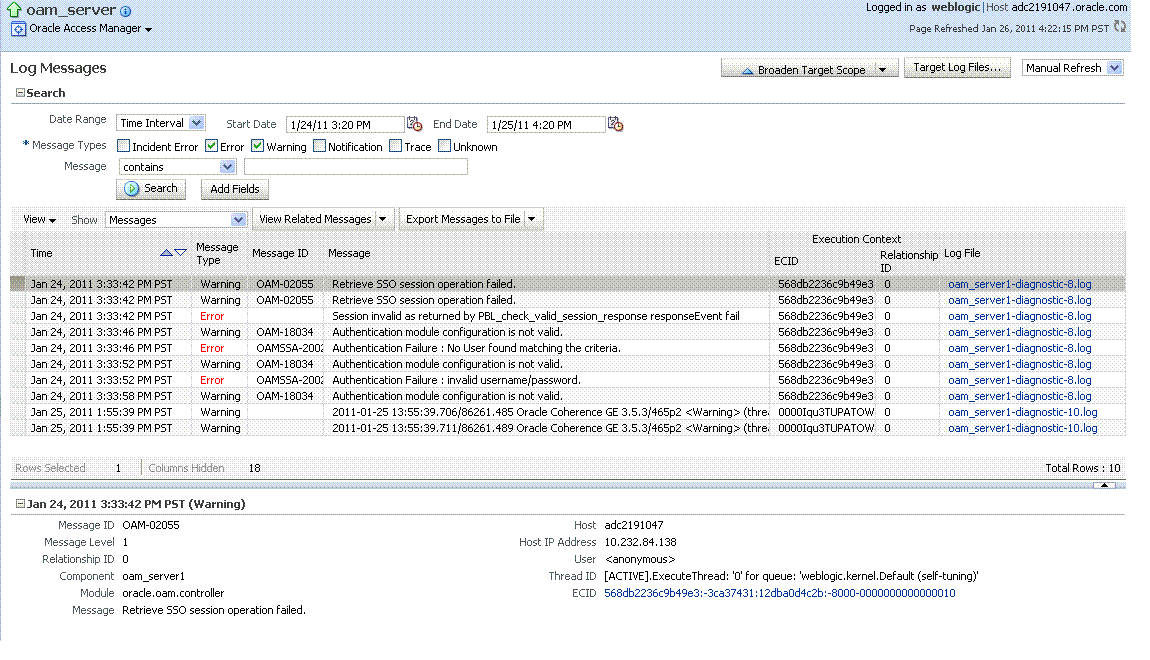
Description of "Figure 12-17 Typical Log Messages Page in Fusion Middleware Control"
Table 12-9 describes elements on the Log Messages page in Fusion Middleware Control, which you can use to locate and view messages.
Table 12-9 OAM Log Message Search Controls in Fusion Middleware Control
| Element | Description |
|---|---|
|
Broaden Target Scope |
Select items on this list to expand (or narrow) the targets that are used in this search:
|
|
Target Log Files... |
Displays a list of all log files for the target scope from which you can select a specific log file to view or download. |
|
Refresh Options |
Select an item from this list to specify the refresh method:
|
|
Search Options |
|
|
Date Range |
The period during which the desired set of messages was logged:
|
|
Message Types |
Check all message types that apply for this search:
|
|
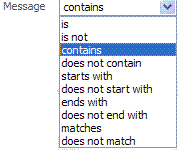
Message |
Choose an identifier from this list and add a value in the blank field beside it to refine your search criteria: |
|
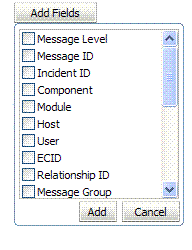
Add Fields |
Click this button to display a list of additional search criteria you can include. |
|
Search |
Click this button to initiate a search using the specified criteria. |
|
Viewing Options |
|
|
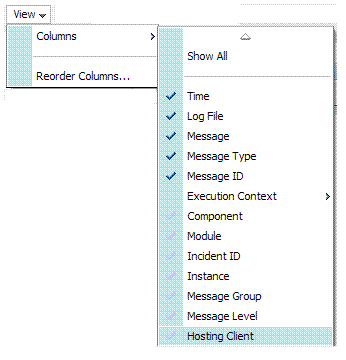
View |
Choose items from this menu to view or reorder columns in the search results table: |
|
Show |
Select the entity to view: |
|
View Related Messages |
This menu is available when at least one message is listed in the search results. |
|
Export Messages to a File |
A menu of viewing commands that are available when at least one message is listed in the search results. You can choose from the following commands: |
|
Results Table Columns |
These are based on selections in the View menu on the Log Messages page. |
|
Message Area |
Displays details for the selected message in the search results table. |
12.7.2 Viewing Logged Messages With Fusion Middleware Control
Fusion Middleware Control Administrators can view and download log messages for the target.
This procedure explains how to search for messages, view messages (or view related messages), view all messages in a single log file, and export or download messages.
-
Log in as described in "Logging In To Fusion Middleware Control".
-
Expand the desired node and select a target. For example:
- Identity and Access
- oam_server
-
From the OAM context menu, select Logs and then choose View Log Messages.
-
Search (Table 12-9):
-
Specify a Date Range.
-
Check all Message Types to be included in your search.
-
Define Message content options.
-
Add Fields: Enter details to further refine message content.
-
Click Search to display a list of messages that fit your search criteria.
-
-
View Messages: From the table of search results, click one or more messages to view on the lower half of the page.
-
View Related: Use one of the following methods to organize the table of search results.
-
By Time: From the View Related menu, select by Time.
-
By ECID: Click ECID in the message on the screen (or, from the View Related menu, select by ECID Execution Context ID).
-
From the Scope menu, select a time period.
-
-
Log File: From the table of search results, click a name in the Log File column to view all messages in the file.
-
Export Messages
-
Select one or more messages in the search results table.
-
From the Export Messages menu, choose the desired export format. For example: As Oracle Diagnostic Log (.txt).
-
In the dialog box, click Open with and then choose the desired program.
-
From the open program, save the file to a new path.
-
-
Download
-
Select one or more messages in the search results table.
-
Click the Download button.
-
In the dialog box, click Open with and then choose the desired program.
-
From the open program, save the file to a new path.
-
-
Testing:
-
Using the Access Tester, enter an invalid user name and try to authenticate (see Validating Connectivity and Policies Using the Access Tester).
-
In Fusion Middleware Control, go to the log viewer and review the error.
-
Using the Access Tester, enter an invalid password and try to authenticate.
-
In the Fusion Middleware Control log viewer, check the error and then view all related log messages.
-
Repeat this test using different log levels, as described in "Managing Log Level Changes in Fusion Middleware Control".
-
12.8 Displaying MBeans in Fusion Middleware Control
A Java object is a unit of code that runs the computer. Each object is an instance of a particular class or subclass that relies on the class's methods or procedures or data variables. Within the Java programming language, a Java object that represents a manageable resource (application, service, component, or device) is known as an MBean (managed bean).
Fusion Middleware Control enables you to:
-
View information on key MBean Attributes and Operations
-
Invoke methods
This section provides the following topics:
12.8.1 Fusion Middleware Control System MBean Browser
The Fusion Middleware Control System Mbean Browser can be used to view System MBean Browser for Nodes and Targets.
Table 12-10details about the System MBean Browser..
Table 12-10 System MBean Browser
| Node | Target | System Mbean Browser |
|---|---|---|
|
Application Deployment Internal Applications |
...AdminServer oamsso_logout(11.1.1.3.0) AdminServer oamsso_logout(11.1.1.3.0) oam_server |
Yes Yes Yes |
|
WebLogic Server domain |
oam_bd (Cluster name) AdminServer oam_server |
Yes Yes Yes |
|
Identity and Access |
OAM (Cluster) oam_server (Server) |
No Yes |
Note:
Security Token Service MBeans are also available as described here.
Table 12-11 describes the MBeans that Access Manager and Security Token Service deploy on the AdminServer on the domain runtime server (OAM Server).
Table 12-11 MBeans that Access Manager and Security Token Service Deploy
| MBeans For | Description |
|---|---|
|
Configuration Service |
oracle.oam:type=Config |
|
Partner and Trust Service |
oracle.oam:type=PATConfig |
|
STS MBeans |
oracle.sts:type=Config |
|
Certificate Validation Module |
These are used for CRL management. oracle.sts:type=CertRevocationListConfig |
Figure 12-18 Shows the System MBean Browser and the related Attributes tab displaying information for the Security Token Service CertRevocationListConfig: oracle.sts:Location=oam_server1,type=CertRevocationListConfig.
Figure 12-18 System MBean Browser and Attributes Tab
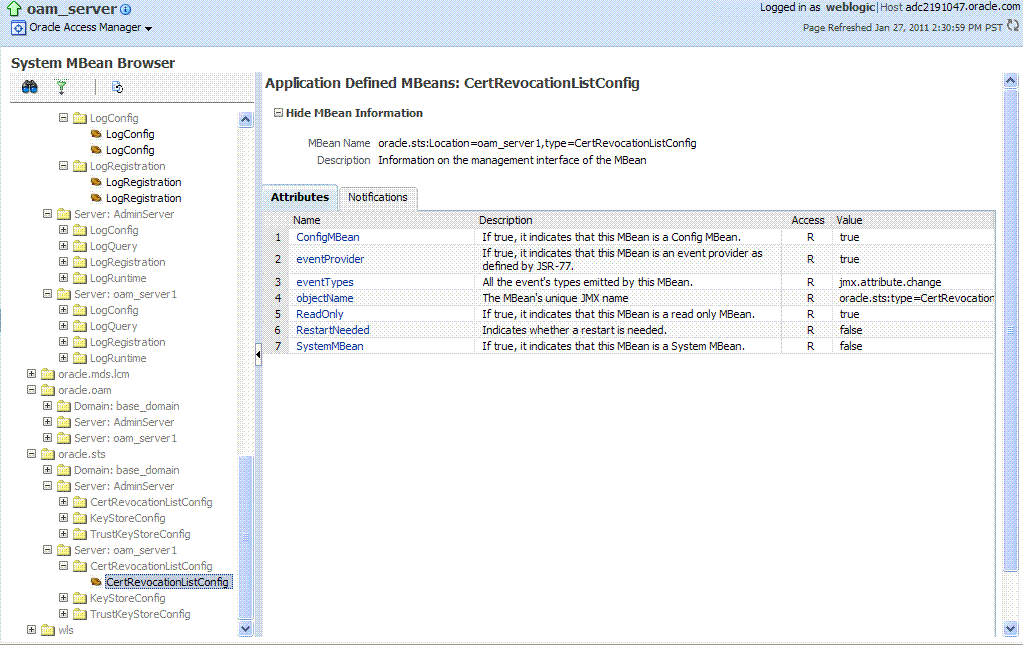
Description of "Figure 12-18 System MBean Browser and Attributes Tab"
Table 12-12 describes the System MBean Browser and associated tab in greater details.
Table 12-12 System MBean Browser
| System MBean Browser | Description |
|---|---|
|
System MBean Browser |
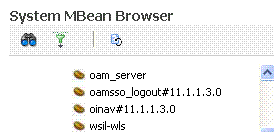
Expand items in this section to display Mbeans for the selected target. Under Application Defined Beans, find |
|
MBean Information |
Details for Attributes and Operations related to the MBean for the selected target are displayed on the right. |
|
Attributes |
This tab describes MBean attributes for the selected target. |
|
Operations |
This tab describes MBean operations for the selected target. |
|
Notifications |
This tab lists any notifications resulting from the invocation of an MBean. |
|
Controls |
The following controls are available from these pages:
|
12.8.2 Managing Mbeans
Fusion Middleware Control Administrators can view, edit or invoke MBeans for Access Manager and Security Token Service. Additionally, you can apply values (or revert the change) and invoke MBeans.
-
Log in as described in "Logging In To Fusion Middleware Control".
-
Expand the desired node and select a target. For example:
- Identity and Access
- oam_server
-
From the Access Manager context menu, select System MBean Browser.
-
System MBean Browser: Expand classes and select an MBean target to display related attributes and operations. For example: oracle.sts or oracle.oam.
-
Manage MBean Attributes:
-
Click the Attributes tab.
-
Review the name and description of MBean attributes for the selected target.
-
Edit values for one or more attributes and click Apply to submit changes (or click Revert to cancel changes).
Alternatively: Click a Name in the Attributes table to display a full description and the value; change the value and click Apply (or click Revert to cancel the change).
-
-
Manage MBean Operations:
-
Click the Operations tab.
-
Review the name, description, number of parameters, and return type for each MBean operation for the selected target.
-
Click a name in the Operations table to display the parameters and related name, description, type, and value.
-
Edit values for the operation and click Apply to submit changes (or click Revert to cancel changes).
-
Click Invoke to invoke the MBean and review the message that appears.
-
