Debugging Oracle JET Applications
Since Oracle JET web applications are client-side HTML5 applications written in JavaScript, you can use your favorite browser's debugging facilities. The process for debugging hybrid mobile applications differs, depending on whether you’re debugging your application in a web browser, emulator, or device.
Debugging Web Applications
Use your favorite browser's debugging facilities for debugging.
Before you debug your application, you should verify that your application is using the debug version of the Oracle JET libraries. If you used the tooling to build your application in development mode, then your application should be using the debug library. If, however, you are using one of the sample applications, it may be configured to use the minified version of the Oracle JET libraries.
To verify that you are using the debug version of the library, check your RequireJS bootstrap file (typically apphome/js/main.js) for the Oracle JET library path, highlighted in bold below.
requirejs.config(
{
  baseUrl: 'js',

  // Path mappings for the logical module names
  paths:
  //injector:mainReleasePaths
  {
    ... contents omitted

    'ojs': 'libs/oj/v5.2.0/min',
    'ojL10n': 'libs/oj/v5.2.0/ojL10n',
    'ojtranslations': 'libs/oj/v5.2.0/resources',
    'text': 'libs/require/text',
    'signals': 'libs/js-signals/signals'
  }
  ... contents omitted
);
In this example, the path is pointing to the minified version of the Oracle JET libraries. To change to the debug version, edit the bootstrap file and replace min with debug as shown.
'ojs': 'libs/oj/v5.2.0/debug',-
do normal debugging, including setting breakpoints and inspecting CSS using Chrome Inspector (
<a target="_blank" href="chrome://inspect">chrome://inspect</a>) without having to install any 3rd party add-ons. -
add the Knockoutjs Context Debugger extension to examine the Knockout context and data for a DOM node in a sidebar.
-
add the Window Resizer extension to resize the browser window to emulate common screen sizes or set your own. You can find the extensions and other developer tools at the Chrome Web Store.
If you’re using an Integrated Development Environment (IDE) for development, you can use debugging tools such as the one provided by the NetBeans IDE to set break points and watches. For details, see Debugging and Testing JavaScript in an HTML5 Application.
Debugging Hybrid Mobile Applications
The process for debugging hybrid mobile applications differs, depending on whether you’re debugging your application in a web browser, emulator, or device.
There are several ways to debug a hybrid mobile application, depending on the environment where you are running the application:
-
Debugging in a local web browser
Since Cordova applications are HTML5 applications written in JavaScript, you can use the same debugging facilities that you would use for web applications as described in Debugging Web Applications. With this approach, however, you might find it difficult to debug code that depends on device services and Cordova plugins.
To run an Oracle JET hybrid mobile application in your desktop Safari or Chrome browser, serve it with the
--browseroption.ojet serve ios|android|windows --browserOnce your app loads in the browser, you can use the browser’s developer tools to view the source code, debug JavaScript using breakpoints and watches, or change the source code in the browser, which can be especially useful when you want to experiment with CSS changes that you intend to make in your app. For more information about the Chrome browser’s developer tools, see the Chrome DevTools documentation and for the iOS Safari browser’s developer tools, see the Web Inspector Tutorial.
-
Debugging in the emulator
You can run the app in the emulator which eliminates the need for an actual device. However, emulators can run slowly and include limited support for emulating native device services.
To run an Oracle JET hybrid mobile application in the default emulator, serve it with the
--emulatoroption.ojet serve ios|android|windows --emulatorYou can also specify a named emulator or simulator on Android or iOS devices:
ojet serve ios|android|windows --emulator=emulator-nameTo determine the emulator or simulator name:
-
For Android emulators, run
android avdat a command prompt. -
For iOS simulators, at a command prompt in the application’s hybrid directory, enter the following:
ios-sim showdevicetypes.
-
-
Debugging on the device
Debugging the application on a real device provides the most accurate experience, but the development cycle can take longer since you must package the application, deploy it to the device, and use a desktop browser or other development tool to connect to it running on the device.
To run an Oracle JET hybrid mobile application on the device, serve it with the
--deviceoption.ojet serve ios|android|windows --device
Once the app installs and runs on the device or on the emulator, you can use your browser’s developer tools to debug and inspect your application’s code as it executes. The browser developer tools that you use depend on the platform where your application runs.
Use the Safari browser’s Web Inspector, described in the Web Inspector Tutorial, if you run your app an iOS device or simulator.
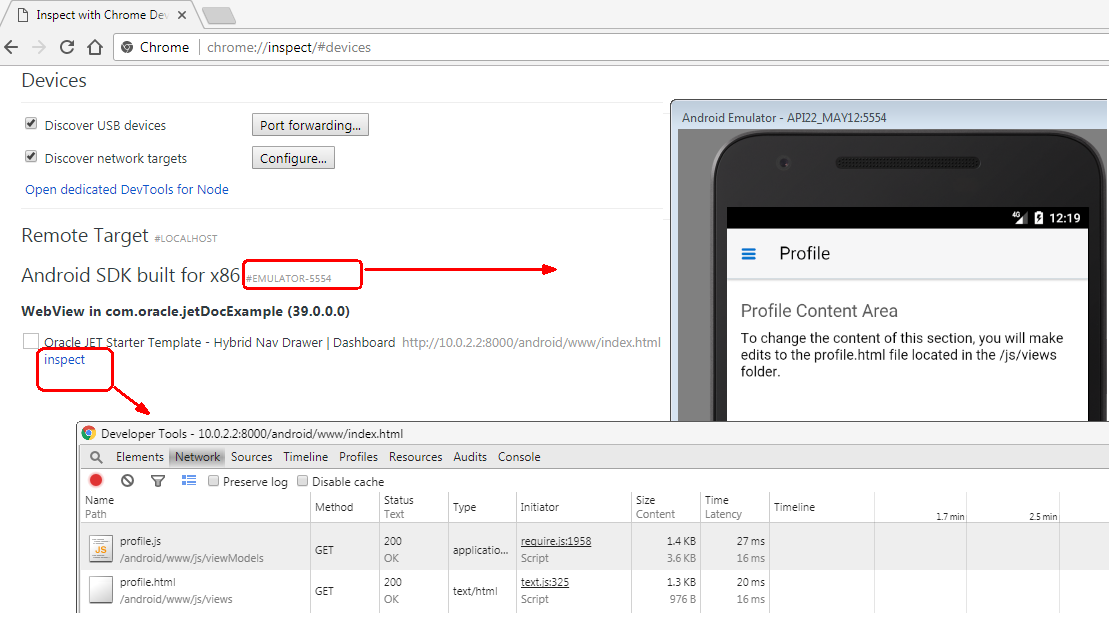
Use the Chrome browser’s developer tools if your app runs on an Android emulator or device. For the Android platform, once JET has served the app to the emulator or device, enter chrome://inspect/ in the Chrome browser’s address bar to access the developer tools. This renders the Inspect with Chrome Developer Tools page that lists the connected devices and the applications on these devices that you can inspect using the developer tools. Click the inspect link beside the app you want to inspect, as illustrated by the following figure which shows the developer tools in the foreground for the application running in the emulator.
For more information about debugging apps on an Android device using Chrome DevTools, see Get Started with Remote Debugging Android Devices in Google’s documentation.
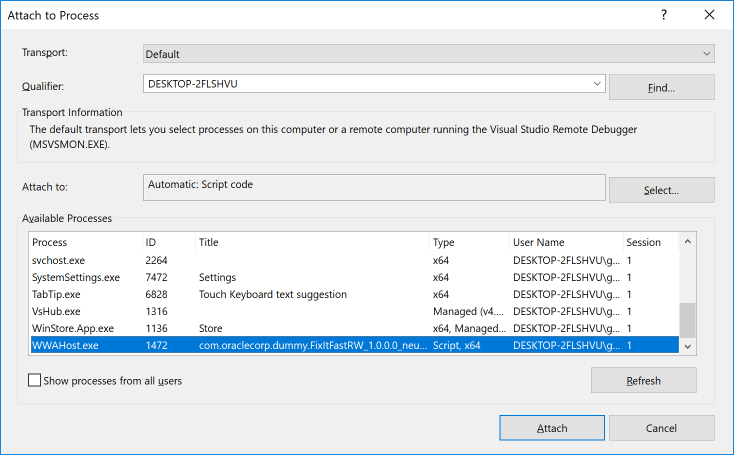
Use Visual Studio to debug and inspect your application’s code if your application runs on the Windows platform. Serve your application on your Windows machine and attach the process for the application to the Visual Studio debugger, as described in Microsoft’s documentation. JavaScript apps, such as your application, run in an instance of the wwahost.exe process on Windows, so multiple instances of the wwahost.exe process appear in the Attach to Process dialog if you have more than one application running. Use the Title column of the Attach to Process dialog to select the correct application to attach, as illustrated by the following image where an instance of the FixItFast sample application is selected.
Once you have attached your app, use the Visual Studio debugger, as described in Microsoft’s documentation, to debug your application.