4 Monitoring the SOA Infrastructure
-
Monitoring the Overall Status of the SOA Infrastructure or Individual SOA Folder
-
Monitoring Service and Reference Binding Components in the SOA Infrastructure
-
Monitoring and Troubleshooting SOA-Wide Issues Using IWS Reports
For more information, see Introduction to the SOA Infrastructure Application.
Monitoring the Overall Status of the SOA Infrastructure or Individual SOA Folder
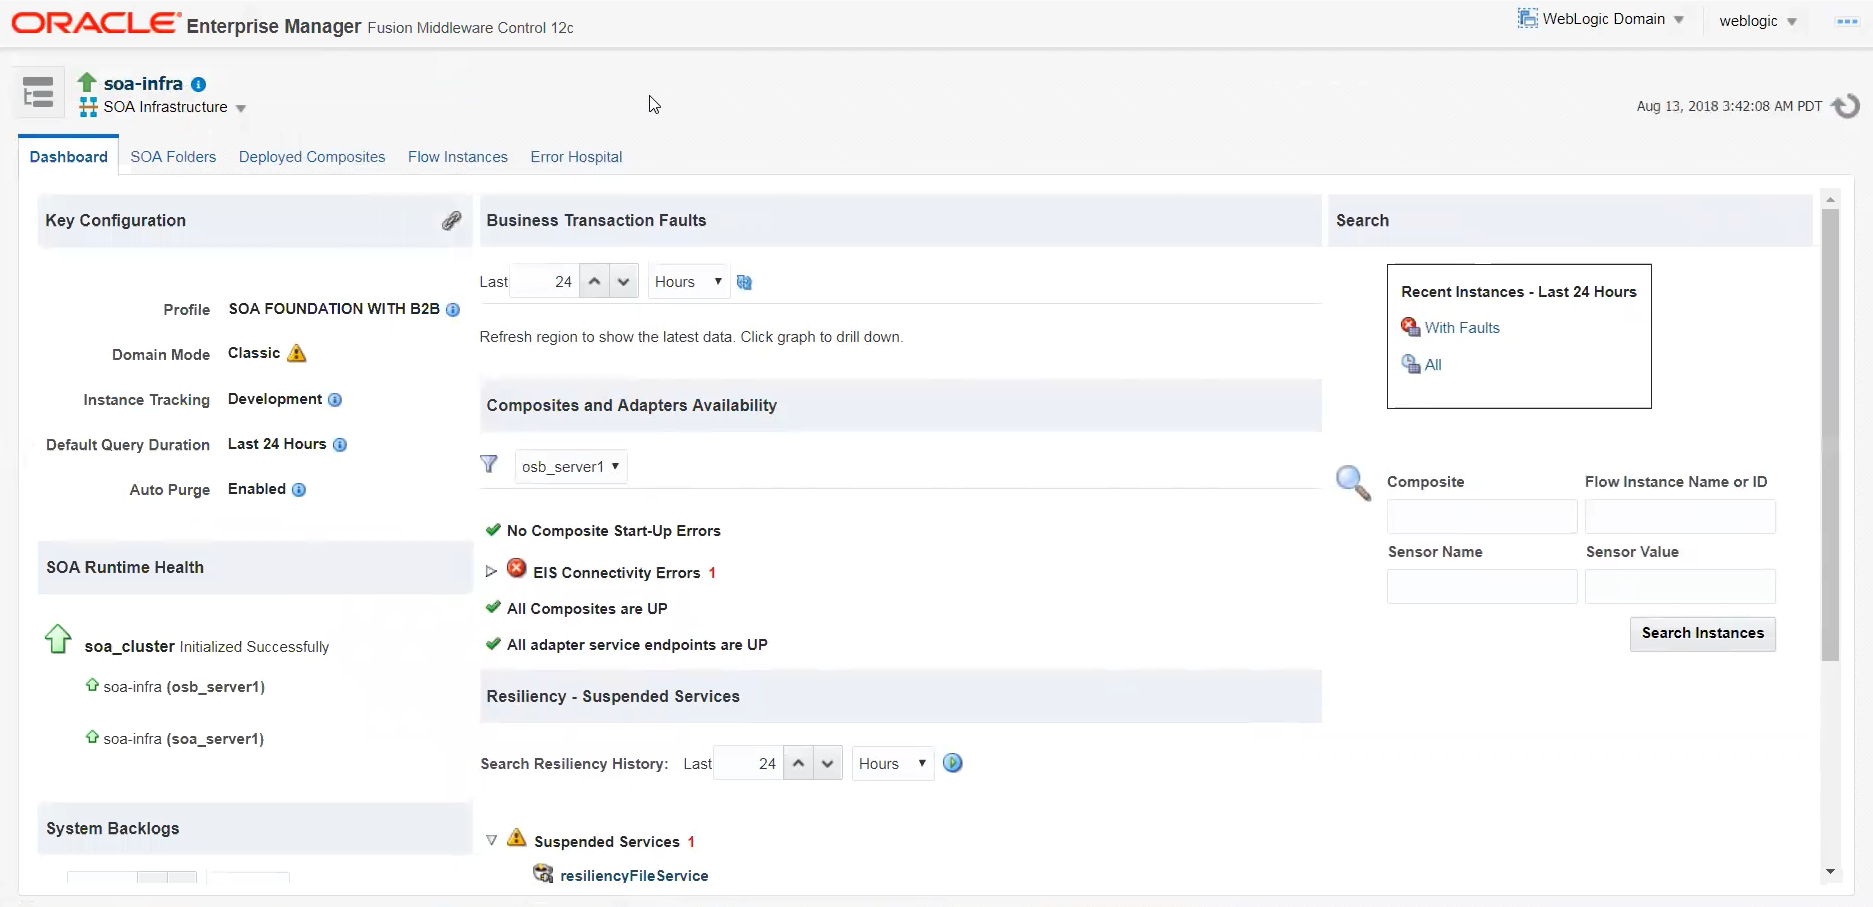
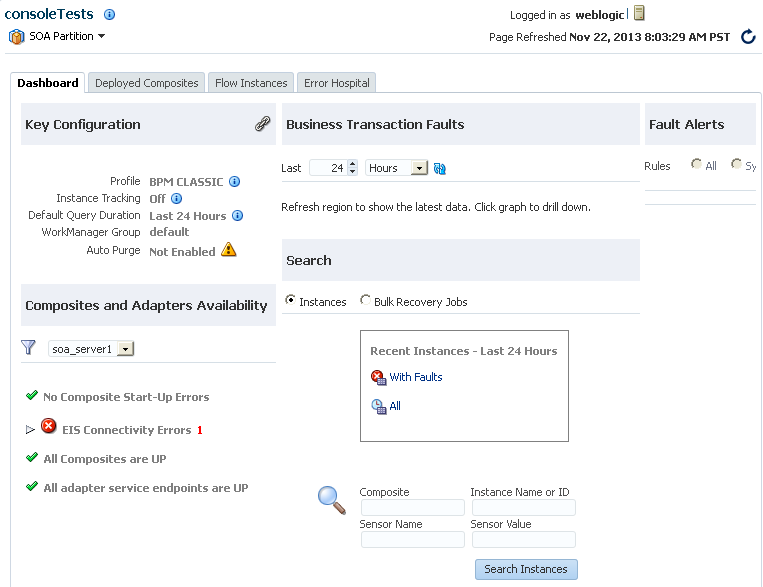
You can monitor the overall status of your environment from the Dashboard pages of the SOA Infrastructure or an individual SOA folder. The Dashboard pages enable you to view information such as the following:
-
The overall health of the SOA runtime, including any faults with which to be concerned.
-
The health of deployed applications and adapter endpoints (for example, any problems when the system was restarted or when applications were deployed or upgraded).
-
The health of the business transactions, including any faults with which to be concerned.
-
The key events that occurred in the system in the last operating time range (for example, 24 hours).
The information that is displayed on the Dashboard page of the SOA Infrastructure or an individual SOA folder differs in some sections. Table 4-1 describes the sections of the Dashboard pages and how they differ.
Table 4-1 Dashboard Page Sections at SOA Infrastructure and Individual SOA Folder Levels
| Section | Displayed on SOA Infrastructure Dashboard Page? | Displayed on Individual SOA Folder Dashboard Page? |
|---|---|---|
|
Key Configuration |
Yes |
Yes, and also includes the work manager group of the SOA folder. |
|
SOA Runtime Health |
Yes |
No |
|
System Backlogs |
Yes |
No |
|
Business Transaction Faults |
Yes, shows all faults for the entire SOA Infrastructure. |
Yes, shows faults for the individual SOA folder only. |
|
Composites and Adapters Availability |
Yes, shows composite and adapter availability for the entire SOA Infrastructure. |
Yes, shows composite and adapter availability for the individual SOA folder only. |
|
Search |
Yes, shows all instance and bulk recovery job searches and saved searches for the entire SOA Infrastructure. |
Yes, shows instance and bulk recovery job searches and saved searches for the individual SOA folder only. |
|
Fault Alerts |
Yes, shows error notification alerts for the entire SOA Infrastructure. |
Yes, shows error notification alerts for the individual SOA folder only. |
The information that you can view on the Dashboard pages is based on your permissions. For example, if you only have permissions on a specific SOA folder, you cannot access the SOA Infrastructure Dashboard page. However, you can access the Dashboard page for that specific SOA folder.
To monitor the overall status of the SOA Infrastructure or individual SOA folder:
-
Access this page through one of the following options:
-
To access overall status information for the SOA Infrastructure:
From the SOA Infrastructure Menu... From the SOA Folder in the Navigator... From the SOA Composite Menu... -
Select Home > Dashboard.
-
Expand SOA.
-
Select soa-infra > server_name.
-
Select SOA Infrastructure.
The SOA Infrastructure Dashboard page displays the following details:
-
-
To access overall status information for the individual SOA folder:
From the SOA Infrastructure Menu... From the SOA Folder in the Navigator... -
Select Manage SOA Folders.
-
In the SOA Folder column, select a specific folder.
-
Expand SOA.
-
Expand soa-infra > server_name.
-
Select the specific SOA folder.
The Dashboard page of the selected SOA folder displays the following details:
-
You can perform the following overall status monitoring tasks:
-
Viewing Key Configuration Settings
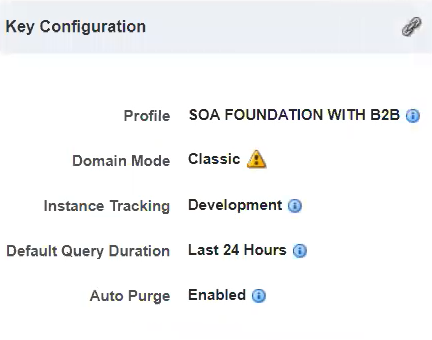
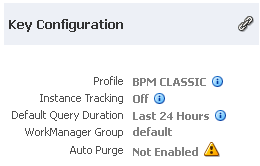
The Key Configuration section enables you to view important system configuration settings for the SOA profile, instance tracking, default query duration, work manager group (for a SOA folder), and automatic purging. The same configuration settings are displayed on the Dashboard pages of the SOA Infrastructure and individual SOA folder. In addition, the work manager group of the SOA folder is displayed on the Dashboard page of the individual SOA folder.
To view key configuration settings:
-
View the following details in the Key Configuration section.
-
On the SOA Infrastructure Dashboard page:
-
On the individual SOA folder Dashboard page:
-
-
Perform the following monitoring and management tasks from this section.
Element Description Profile
Displays the current configuration profile selected on the SOA Infrastructure Common Properties page (for example, BPM Classic). SOA profiles provide subsets of SOA functionality and reduce the overall memory footprint of the SOA Infrastructure. A default profile is automatically set during installation.
To change this value:
-
To the right of the Profile field, click the icon.
-
Click Change Profile. The SOA Infrastructure Common Properties page is displayed.
-
From the list, select the profile and click OK.
-
Restart the server.
Note: Profile changes, if not done properly, put the system in an unstable state. Only a qualified SOA administrator must immediately restart all Oracle WebLogic Servers on which this SOA Infrastructure is deployed. Otherwise, the system is in an unstable state. For more information about profiles, see Configuring Oracle SOA Suite and Oracle BPM Suite Profiles.
Instance Tracking
Displays the audit level setting (Off, Production, or Development). This setting determines the level of information to be collected by the message tracking infrastructure. This information is collected in the instance data store (database) associated with the SOA Infrastructure. For details about these settings, see Configuring the Audit Trail, Payload Validation, and Default Query Duration.
To change this value:
-
To the right of the Instance Tracking field, click the icon.
-
Click Change Audit Level. The SOA Infrastructure Common Properties page is displayed.
-
From the Audit Level list, select the appropriate value, and click Apply.
Default Query Duration
Displays the time period during which to retrieve instances and faults data. This property controls the amount of instance and fault data fetched by default by all out-of-the-box queries. This value is also displayed as the default time range value on pages with query/search functionality (for example, the Dashboard page regions that include query functionality, the Flow Instances pages, Error Hospital pages, the Resequencer pages, and so on). You can override this value on the corresponding page, as needed.
Note: It is highly recommended that you set a time period duration because it has a significant impact on the performance of multiple Oracle Enterprise Manager Fusion Middleware Control pages and queries.
Some of the more data intensive pages do not initially preload the data for performance reasons. You must explicitly request to view the data by clicking a search or refresh button. If you have not specified a different time period, the query executes using the default duration setting.
The default value is 24 hours. The value is set in the Default Query Duration section on the SOA Infrastructure Common Properties page.
To change this value:
-
To the right of the Default Query Duration field, click the icon.
-
Click Change Default Query Duration. The SOA Infrastructure Common Properties page is displayed.
-
From the Default Query Duration list, change the time period, and click Apply.
For more information about setting this property, see Configuring the Audit Trail, Payload Validation, and Default Query Duration.
Work Manager Group
Displays the work manager group for the SOA folder. This section is displayed only on the Dashboard page of the individual SOA folder.
Work manager groups isolate SOA folder configuration and request processing. A work manager is an Oracle WebLogic Server entity that represents a logical thread pool. It is similar to a queue in which work items line up for processing.
For more information, see Managing Work Manager Groups.
Auto Purge
Displays whether Oracle SOA Suite is enabled to automatically remove older flow instances, adapter reports, and fault alerts data from the database. By default, this option is enabled for Oracle SOA Suite production installations.
To change this value:
-
To the right of the Auto Purge field, click the icon.
-
Click Set Up Auto Purge. The Auto Purge page is displayed.
-
Based on the requirements for your environment, select or deselect the Enable checkbox.
Note: The Auto Purge element is not displayed if you are using the Java database included with the Oracle SOA Suite Quick Start installation option.
For more information about automatically removing data from the database, see Deleting Large Numbers of Instances with Oracle Enterprise Manager Fusion Middleware Control.
EDN Paused
This message is only displayed when the delivery of business events has stopped. This occurs in the following scenarios:
-
The edn System MBean Browser property is set to
true. -
When patches are applied, the EDN is automatically placed into paused mode. If the patch fails, EDN remains in paused mode.
For more information about setting this property, see Tuning EDN Event Bus and Delivery.
-
Viewing the Overall Runtime Health of the SOA Infrastructure
The SOA Runtime Health section enables you to view the overall health of the SOA Infrastructure in a cluster or a single-node environment and whether the migration of 11g to 12c data has completed. This section is only displayed on the Dashboard page of the SOA Infrastructure.
To view the overall runtime health of the SOA Infrastructure:
-
View the following details in the SOA Runtime Health section.
-
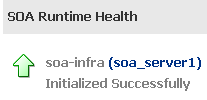
If the SOA Infrastructure for each node is running and all composites are successfully loaded, the following message is displayed.
-
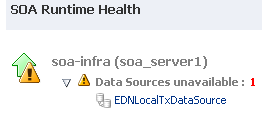
If the data sources are stopped, not targeted to the SOA server, or not working (for example due to a connection timeout), the following message is displayed.
-
If the Oracle Web Services Manager (OWSM) policy manager is not running, the following message is displayed.
-
-
Perform the following monitoring and management tasks from this section.
Element Description Data Migration
Displays the 11g to 12c data upgrade status. The following message links can be displayed.
-
Data Migration Not Completed
Click this message link to invoke a message that displays the following details.The migration status of active instances (completed or not completed).The migration status of inactive instances (completed, older than date and not yet migrated, or not completed).
-
Data Migration Completed
Click the alert icon next to this message link to invoke a message indicating that all data available before the upgrade is now available and you can run the report migration script to view specific details.
To close this message, click the close icon to the upper right of the message. This invokes a confirmation message in which to select not to display the migration completion message again.
To run the report migration script, see Section "Using the Upgrade Administration Scripts" of Upgrading Oracle SOA Suite and Business Process Management.
For information about migration status, see Section "Monitoring Upgrade Status with Fusion Middleware Control" of Upgrading Oracle SOA Suite and Business Process Management.
soa-infra (server_name)
Displays the overall status of all nodes in a clustered or single-node environment. Click the server name to go to the home page of the managed server. If the SOA Infrastructure for each node is running and all composites are successfully loaded, the following message is displayed.
Initialized Successfully
There are several issues that can impact the overall health of the SOA Infrastructure runtime environment:
-
If the data sources are stopped or not working (for example, due to a connection timeout), the following message is displayed:
Data Sources unavailable: numberThe following data sources are monitored:
- EDNDataSource
- EDNLocalTxDataSource
- SOADataSource
- opss-data-source
- mds-SOA
Expand the warning message to display the impacted data source type (for example, EDNDataSource). You can click the data source to access the JDBC Data Sources (Monitoring) page.
-
The SOA Infrastructure Java Transaction API (JTA) application is running, but not all SOA composite applications are loaded. A warning message indicating that the SOA Infrastructure is down and currently initializing is displayed. The SOA Infrastructure may not be completely initialized to administer incoming requests until all deployed composites are loaded. Therefore, the response metrics that are displayed on some Oracle Enterprise Manager Fusion Middleware Control pages may not reflect their actual status. This is most apparent when the SOA Infrastructure is in a cluster with multiple managed servers and a large number of deployed composites. During the initialization stage, Oracle Enterprise Manager Fusion Middleware Control does not prevent you from executing operations such as composite deployment, composite undeployment, and others, even though these operations may not complete successfully. Do not perform operations such as composite deployment, composite undeployment, and others while this message is displayed. Once initialization completes, the message is no longer displayed. You see this after you refresh the page. You can then perform operations.
-
If the OWSM policy manager is not running, the following message is displayed:
Policy Manager validation failed
- Expand the message and click Navigate to WSM Diagnostics.
- In the System MBean Browser, click Operations.
- Click checkPolicyManagerStatus.
- Click Invoke.
-
Viewing System Backlogs in the SOA Infrastructure
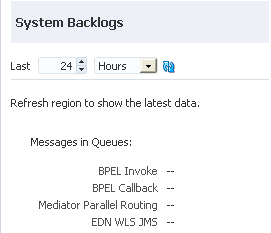
The System Backlogs section enables you to view the number of messages in the queues. You must click the Refresh Backlogs button to retrieve the message queue backlog counts. This section is only displayed on the Dashboard page of the SOA Infrastructure.
To view system backlogs in the SOA Infrastructure:
Viewing Business Transaction Faults
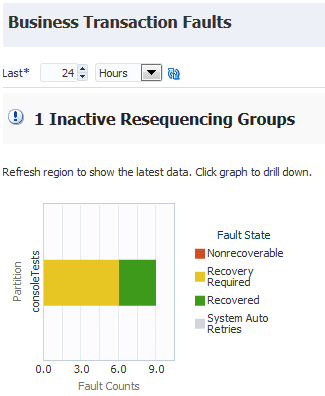
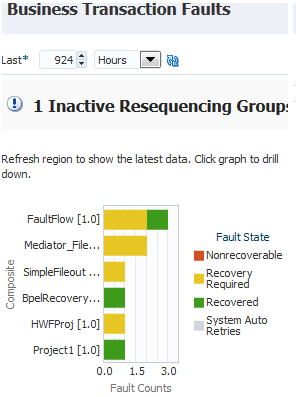
The Business Transaction Faults section enables you to set the specified time period during which to retrieve nonrecoverable faults, faults requiring recovery, recovered faults, and automatically retried system faults at the SOA Infrastructure or individual SOA folder level. The default value is 24 hours.
To view business transaction faults:
Viewing SOA Composite Applications and Adapters Availability
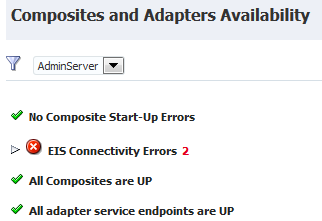
The Composites and Adapters Availability section enables you to view the composites that did not start, adapters with connectivity errors, and scheduled downtimes for the composite and adapter endpoints. This section is displayed in both clustered and single-node environments.
To view SOA composite applications and adapters availability:
-
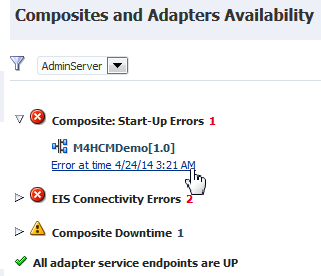
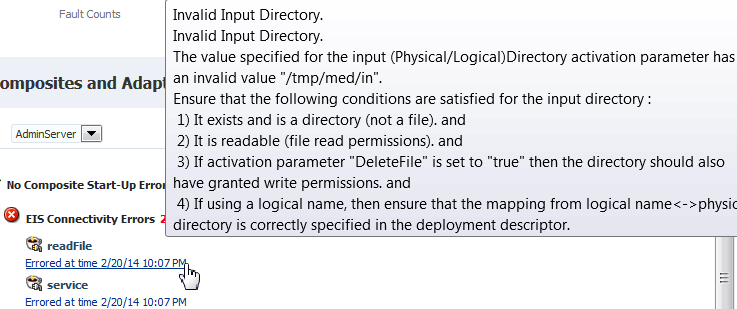
View the following details in the Composites and Adapters Availability section. On the SOA Infrastructure Dashboard page, the availability of all composites and adapters in the SOA Infrastructure are displayed. On the individual SOA folder Dashboard page, the availability of all composites and adapters within only that SOA folder are displayed.
-
If you have composite startup errors, expand the message to display the SOA composite application name and time of the error.
-
If you have EIS connectivity errors, expand the message and place your cursor over the error timestamp to display fault details.
-
Perform the following monitoring and management tasks from this section.
Element Description 
Select the SOA Infrastructure in a clustered or single-node environment for which to obtain the following composite and adapter availability details. For a clustered environment, all managed servers are displayed in the list.
-
Composite start-up error status.
-
EIS connectivity errors status: Errors are displayed when the connection between the endpoint and EIS is down (for example, for the database adapter when the database is down and for the file adapter when the file does not exist at a specified location or the file is not readable or writable). These errors are applicable for adapter service binding component endpoints, and not for reference binding component endpoints.
-
Composite downtime status (up or down): Downtime status typically refers to scheduled downtimes and is more planned than the first two statuses in this list.
When an error occurs, a warning sign and the number of errors are displayed next to the section.
-
Expand the section to display the list of composites or adapter endpoints that have problems.
-
Click the error description for more specific details about the error.
-
Click the name of a composite or adapter to go to its home page.
-
Searching for Instances and Bulk Recovery Jobs
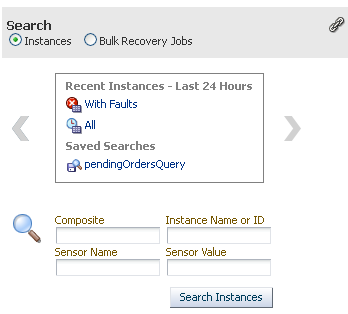
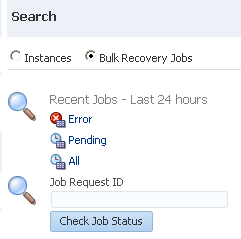
The Search section enables you to search for recent instances and bulk recovery jobs. The Bulk Recovery Jobs search option is not displayed if Oracle Enterprise Scheduler is not deployed.
For the Trace Instance, Bulk Recovery, and SOA Diagnostic job to work with remote agent, you must use SSH credentials as host credentials.
To search for instances and bulk recovery jobs:
-
View the following details in the Search section.
-
Click Instances to view preseeded and custom instance search filters.
-
Click Bulk Recovery Jobs to view preseeded job search filters.
-
-
Perform the following monitoring and management tasks from this section.
Element Description Instances
Select to search for recent instances. This search returns instances created within the time period specified by the Default Query Duration property in the SOA Infrastructure Common Properties page. The default time period for which to search is 24 hours.
-
Click one of the links in the list of predefined search queries and saved search queries to initiate a search.
With Faults: This search returns recent instances that have faults.
All: This search returns all instances created in the default time period.
Saved Searches: Displays the saved searches available for execution. If you create a saved search on the Flow Instances page or Error Hospital page and specify this SOA folder name, the search is displayed in this list.
Or:
-
Enter values for any of the following elements and click Search Instances.
Composite
Instance Name or ID
Sensor Name
Sensor Value
You are redirected to the Flow Instances page with the search results.
Bulk Recovery Jobs
Select to search for recent bulk recovery jobs. This search displays only if Oracle Enterprise Scheduler is deployed, and returns the jobs created within the time period specified by the Default Query Duration property on the SOA Infrastructure Common Properties page. (More search options are provided in the Oracle Enterprise Scheduler page.)
-
Click one of the links in the list of predefined search queries. You are redirected to the Oracle Enterprise Scheduler page where the search results are displayed.
Error
Pending
All
Or:
-
In the Job Request ID, enter a value to find a specific bulk recovery job by its job ID, and click Check Job Status. This field is displayed if Oracle Enterprise Scheduler is deployed.
You are redirected to the Oracle Enterprise Scheduler job page for viewing the status of the job.
For more information about the job request ID, see Performing Bulk Fault Recoveries and Terminations in a Single Operation.
-
For more information about using Oracle Enterprise Scheduler in Oracle Enterprise Manager Fusion Middleware Control, see Administering Oracle Enterprise Scheduler.
Viewing Error Notification Alerts
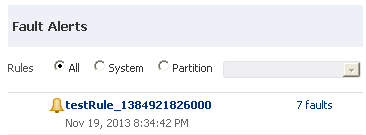
The Fault Alerts section enables you to view error notification alerts for the SOA Infrastructure and individual SOA folders if you have the correct permissions. If there are no errors in the system, then this section is visible with the message No Alerts found in place of a list of fault alerts.
Alerts are triggered when a rule condition is met (for example, you define an alert to trigger if more than 10 faults occur within a 48 hour period). Error alerts are displayed if the Send Alert to Dashboard option is selected on the Create Error Notification Rules page. You create error notification rules on the Create Error Notification Rules page to be sent when specific fault criteria are met.
Note: If you do not select Send Alert to Dashboard on the Create Error Notification Rule page, alerts are not displayed on the Dashboard page.
To view error notification alerts:
Monitoring SOA Infrastructure Performance Summary Metrics
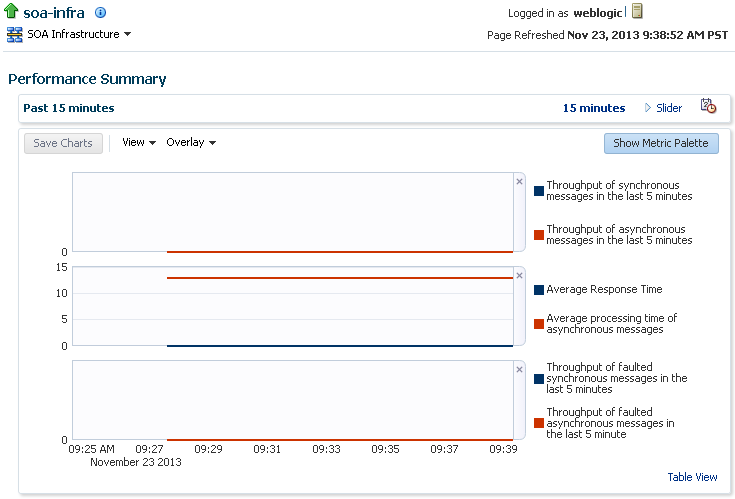
You can view a summary of SOA Infrastructure performance metrics on the Performance Summary page.
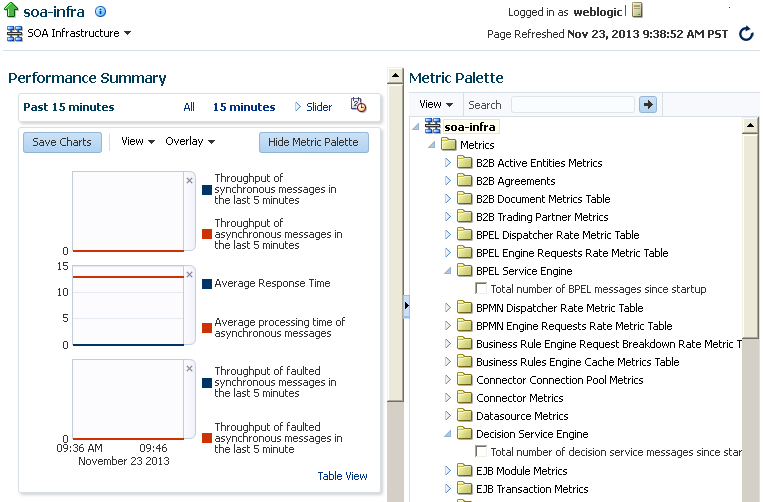
The Performance Summary page provides a graphical representation of the following information by default:
-
Total number of messages in the SOA Infrastructure since the last server restart.
-
Total number of service component messages (BPEL process, Oracle Mediator, human workflow, and business rule (decision service)) since the last server restart.
To monitor SOA Infrastructure performance summary metrics:
-
Access this page through one of the following options:
From the SOA Infrastructure Menu... From the SOA Folder in the Navigator... -
Select Monitoring > Performance Summary
-
Right-click soa-infra.
-
Select Monitoring > Performance Summary.
The Performance Summary page is displayed.
-
-
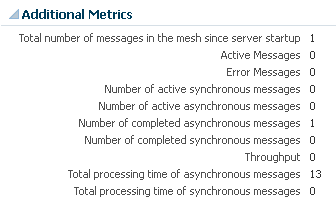
At the bottom of the page, view additional message information.
-
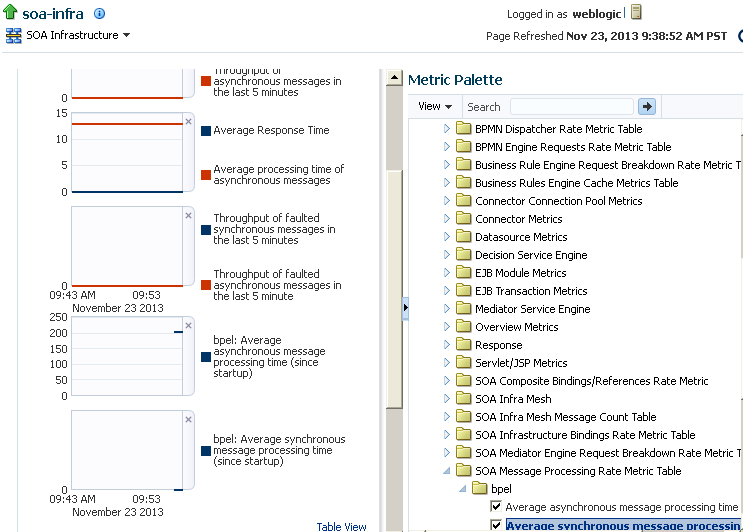
Click Show Metric Palette to display a hierarchical tree of all metrics for the SOA Infrastructure. The tree organizes the metrics into various categories of performance data.
-
Expand a folder and select a metric in the Metric Palette to display a performance chart that shows the changes in the metric value over time. The chart refreshes automatically to show updated data.
-
Click Slider to display a slider tool that lets you specify the time frame for the data shown in the charts.
For more information about the Performance Summary page, see the online Help for the Performance Summary page and Section "Viewing the Performance of Oracle Fusion Middleware" of Administering Oracle Fusion Middleware.
For information about monitoring message delivery processing requests, see Monitoring Message Delivery Processing Requests.
For information about monitoring SOA composite application summary metrics, see Monitoring SOA Composite Application Performance Summary Metrics.
For information about monitoring service engine statistics, see the following:
-
Monitoring BPEL Process Service Engine Request and Thread Performance Statistics.
-
Monitoring Business Rules Service Engine Performance Statistics.
-
Monitoring Human Workflow Service Engine Active Requests and Operation Performance Statistics.
-
Monitoring BPMN Process Service Engine Performance Statistics.
Monitoring Message Delivery Processing Requests
You can monitor SOA Infrastructure message delivery processing requests. These are metrics for the message delivery between the service engines, service infrastructure, and binding components. Once a message is handed over to a service engine, the amount of time it takes to process that message (instance processing time) is not captured in these metrics.
To monitor message delivery processing requests:
-
Access this page through one of the following options:
From the SOA Infrastructure Menu... From the SOA Folder in the Navigator... -
Select Monitoring > Request Processing.
-
Right-click soa-infra.
-
Select Monitoring > Request Processing.
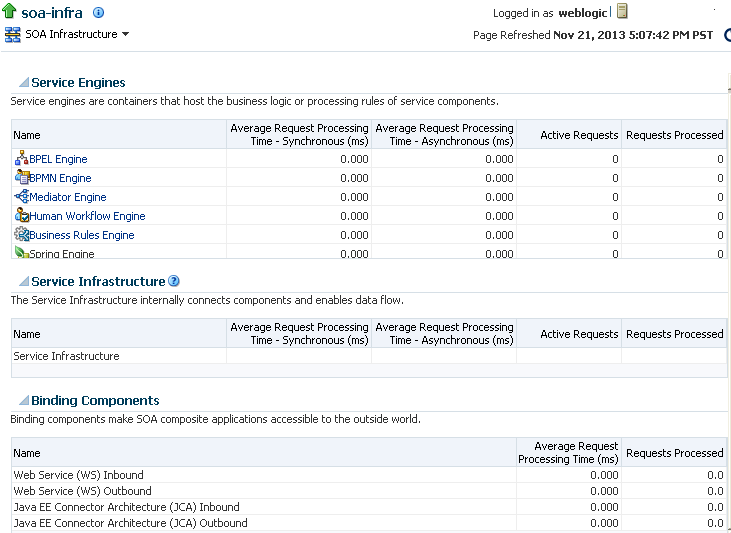
The Request Processing page enables you to monitor the following details:
-
The average request processing time for both synchronous and asynchronous messages, active requests, requests processed, and faulted requests in the service engines and service infrastructure.
-
The average request processing time, requests processed, and errors occurring in service (inbound) and reference (outbound) binding components.
-
-
In the Service Engines section, click a specific service engine (for example, BPEL Engine) to access details such as recent instances using this service engine, components using this service engine, and recent fault occurrences.
For more information, see the following sections:
Monitoring Service and Reference Binding Components in the SOA Infrastructure
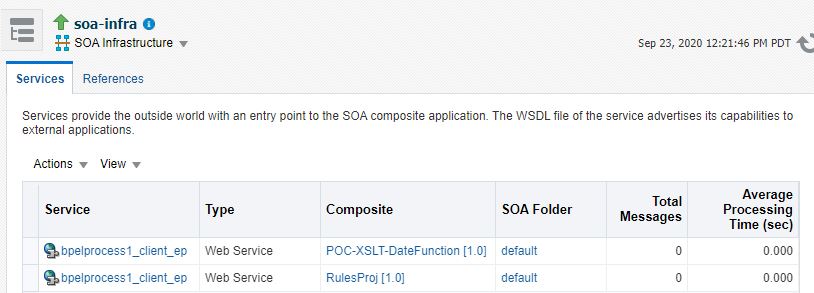
You can monitor all service and reference binding components used in all SOA composite applications deployed to the SOA Infrastructure. Services provide the outside world with an entry point to the SOA composite application. The WSDL file of the service advertises its capabilities to external applications. References enable messages to be sent from the SOA composite application to external services in the outside world.
To monitor service and reference binding components in the SOA Infrastructure:
-
Access this page through one of the following options:
From the SOA Infrastructure Menu... From the SOA Folder in the Navigator... -
Select Services and References.
-
Right-click soa-infra.
-
Select Services and References.
The Services page displays details about the names and types of the services, the SOA composite applications in which the services are used, the SOA folders in which the SOA composite applications are deployed, the total number of messages processed, the average processing time, and the number of faults occurring in the services.
-
-
In the Service column, click a specific service to access its home page.
-
In the Composite column, click a specific SOA composite application to access its home page.
-
In the SOA Folder column, click a specific SOA folder to access its home page.
-
Click the References tab.
The References page displays details about the names and types of the references, the SOA composite applications in which the references are used, the SOA folders in which the SOA composite applications are deployed, the total number of messages processed, the average processing time, and the number of faults occurring in the references.
-
In the Reference column, click a specific reference to access its home page.
-
In the Composite column, click a specific SOA composite application to access its home page.
-
In the SOA Folder column, click a specific SOA folder to access its home page.
For more information about services and references, Introduction to Binding Components
Using SOA Health Check
The SOA Health Check framework provides a number of health checks and health check categories to monitor the health of your system. Checks include memory checks, data source checks, SOA-related service checks, SOA application-targeting checks, BPEL-related checks, and so on.
Startup checks execute automatically at server startup, and periodic checks can be scheduled to run at periodic intervals. You can also execute individual health checks or health check categories using WLST.
This section includes the following topics:
SOA Health Checks
SOA health checks include memory checks, data source checks, SOA-related service checks, SOA application-targeting checks, BPEL-related checks, and so on.
Table 4-2 summarizes the SOA health checks that are available in this release.
Table 4-2 SOA Health Checks
| Health Check Name | Description |
|---|---|
|
BPELAsyncRequestCheck |
Checks if the BPEL asynchronous request count is within the configured threshold of 1000. |
|
BPELComponentInstanceCheck |
Checks if the number of open BPEL component instances are within the threshold of 1000. Also checks if the number of faulted BPEL component instances are within the threshold of 500. |
|
DatasourceCheck |
Checks if the data sources are appropriately targeted for use by the soa-infra application. For each data source, the check verifies if the targets of the data source cover all targets of the soa-infra application. If any of the soa-infra application targets is missing from any of the data source targets, an error is raised. |
|
DBStatsCheck |
Checks if the MDS database statistics are current. |
|
EDNMessageCheck |
Checks if the pending messages count in the EDN event queue and OAOO queue are within thresholds. The threshold limit used for the EDN event queue is 2000 and the threshold limit used for the OAOO queue is 5000. |
|
JDBCPoolsCheck |
Checks if the SOA, EDN, and MDS data sources are healthy at runtime. |
|
SOAAppCheck |
Verifies targeting of SOA applications. SOA applications should at least target all of the soa-infra application targets. |
|
SOALibraryCheck |
Verifies the targeting of SOA, and related, libraries. SOA libraries should at least target all of the soa-infra application targets. |
|
ServiceCheck |
Verify if SOA-related services are functional. Currently, this check verifies if the OWSM Policy Manager service is functional. |
|
MemoryCheck |
Checks if the available (free) heap memory is above the configured threshold of 25%. |
A health check ends with one of the following states:
-
Success: The check completed, and passed.
-
Error: The check completed, but did not pass.
-
Warning: The check completed and passed, but something may need user attention.
-
Failure: The check could not be completed/executed.
-
Skipped: The check is not applicable for the environment.
-
Disabled: The check is disabled and cannot be run.
SOA Health Check Categories
The SOA health check framework logically groups health checks into health check categories. A health check can be part of more than one category.
When you execute a health check category, using the WLST command for example, all health checks in the category automatically get executed. Certain health check categories are automatically executed. For example, the Startup category, if enabled, runs all the startup health checks at server startup.
Table 4-3 summarizes the SOA health check categories and their constituent health checks.
Table 4-3 SOA Health Check Categories
| Health Check Category | Description | Default Health Checks included in the Category |
|---|---|---|
|
Startup |
Runs at server startup |
DatasourceCheck, JDBCPoolsCheck, SOAAppCheck, SOALibraryCheck, ServiceCheck, MemoryCheck |
|
Quick |
Lightweight set of checks |
JDBCPoolsCheck, ServiceCheck, MemoryCheck |
|
Intermediate |
Intermediate set of checks |
BPELAsyncRequestCheck, BPELComponentInstanceCheck, DBStatsCheck, EDNMessageCheck |
|
Extensive |
Extensive set of checks |
For future use |
|
Config |
Configuration checks |
DatasourceCheck, SOAAppCheck, SOALibraryCheck |
Invoking SOA Health Checks
The SOA health checks can be invoked in a number of ways. You can have checks that run automatically at server startup or those that run at periodic intervals. You can use the WLST command-line utility to manually run health checks.
Server Startup
When a production SOA server starts, health checks in the Startup category are automatically run. The startup health check is enabled by default. The result of the startup run is logged in the SOA server logs.
You can choose to disable the startup run using WLST commands. You can also change the category of tests run at startup using the appropriate WLST command. See "enableHCStartupRun" and "setHCStartupRunCategory" in Oracle Fusion Middleware WLST Command Reference for SOA Suite.
Periodic Invocation
SOA health check is pre-configured with periodic runs that automatically run on the production SOA server.Table 4-4 lists the pre-configured periodic runs.
Table 4-4 Pre-Configured Periodic Runs
| Periodic Run Name | Category | Scheduling | Enabled by Default? |
|---|---|---|---|
|
Frequently |
Quick |
Every two hours at :07 |
Yes |
|
Daily |
Intermediate |
Every day at 05:15 |
Yes |
|
Weekly |
Extensive |
Every Sunday at 03:30 |
No (for future use) |
Periodic runs are enabled by default. The result of the periodic runs are logged in the SOA server logs.
You can disable periodic runs, or change the health-check category associated with a periodic run. You can also change the scheduling, or add new periodic runs. See "createHCPeriodicRun", "enableHCPeriodicRun", "setHCPeriodicRunInterval", "setHCPeriodicRunSchedule", and "setHCPeriodicRunCategory" in Oracle Fusion Middleware WLST Command Reference for SOA Suite.
WLST Invocation
You can use WLST commands to:
-
List health checks
-
Configure health checks
-
List health check categories
-
Execute a health check by name
-
Execute a category of health checks
-
Get results (Returned as an HTML report at the specified location)
-
Purge results
See "SOA Health Check Commands" in Oracle Fusion Middleware WLST Command Reference for SOA Suite for details on all health check commands.
The WLST commands need to be executed in the online mode. You must be connected to the SOA server.
Monitoring and Troubleshooting SOA-Wide Issues Using IWS Reports
Integration Workload Statistics (IWS) reports provide Oracle SOA Suite system-wide reports that can help you analyze utilizations, identify potential bottlenecks and backlogs, and perform top-down analysis of your integration system.
Note:
This Oracle SOA Suite feature is part of Oracle Integration Continuous Availability. Refer to the Oracle Fusion Middleware Licensing Information for more details about Oracle SOA Suite options.If there are stressed components or endpoints in Oracle SOA Suite that are slowing down the system, IWS reports can help you narrow down the issue. For example, a slow FTP or database adapter reference endpoint can be identified in the reports. Likewise, a BPEL process running slower than usual can also be identified. You can look at internal queue backlogs, like BPEL queues and EDN queues. Oracle SOA Suite composite summaries are also available.
IWS reports can takes periodic snapshots that include metrics like system resource usage, composite statistics, statistics for internal system queues, statistics for synchronous and asynchronous business processes, and endpoint statistics. You can choose the granularity of data collected for your IWS reports.The components supported include BPEL Service Engine, EDN, Web Service Binding, File Adapter, JMS Adapter, FTP Adapter, DB Adapter, AQ Adapter, and MQ adapter. Refer to Statistics Included in an IWS Report for more information on the statistics collected.
IWS stores the snapshots in dedicated tables. These tables reside in the
soainfra schema and are created as part of repository creation step
during Oracle SOA Suite installation. Note that IWS does not query or rely on
information from other SOA persistence tables of any SOA components such as MDS or BPEL
engine. The tables that store IWS snapshots are:
| Metadata Tables | Runtime Tables |
|---|---|
AWR_SERVER_NODE |
AWR_SNAPSHOT |
AWR_CONFIGURATION |
AWR_RESOURCE_UTIL_METRIC |
AWR_COMPOSITE |
AWR_FLOW_METRIC |
AWR_COMPONENT |
AWR_EXECUTION_METRIC |
AWR_ENDPOINT |
AWR_BACKUP_METRIC |
AWR_ACTIVITY |
|
AWR_SYSTEM_RESOURCES |
The following blogs provide more information about IWS reports:
- IWS Reports - Design and Architecture
- Diagnosing Oracle SOA performance issues with IWS Reports: Part 1 | Part 2 | Part 3
This section includes the following topics:
Enabling and Configuring IWS
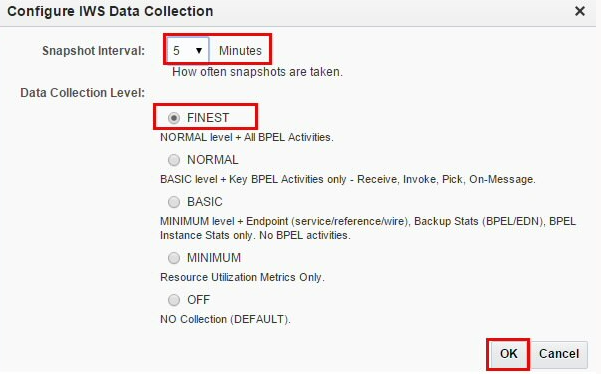
Integration Workload Statistics (IWS) snapshot data is collected at periodic intervals. You can enable snapshot data collection, configure the snapshot interval, and the select the granularity of data collected.
IWS is now enabled and will start capturing snapshots at the specified interval and store them in the database tables described in Monitoring and Troubleshooting SOA-Wide Issues Using IWS Reports.
Generating an IWS Report
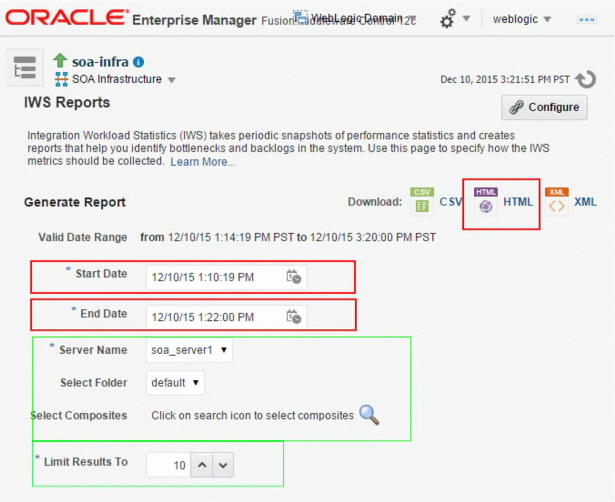
Use the IWS Reports page to create SOA-wide reports that help you identify bottlenecks and backlogs in the system. Integration Workload Statistics (IWS) include metrics like system resource usage, composite statistics, statistics for internal system queues, statistics for synchronous and asynchronous business processes, and endpoint statistics.
Prerequisite: You must have already configured IWS data collection and set a snapshot interval. See Enabling and Configuring IWS.
To create an IWS report:
Retrieving IWS Report Data Using the IWSReport MBean
You can use the IWSReport MBean and its associated operations to retrieve information about the data collected for your IWS reports, such as snapshot IDs, date, and timestamps.
To use the IWSReport MBean:
- Log in to Oracle Enterprise Manager Fusion Middleware Control.
- From the SOA Infrastructure menu, select SOA
Administration, then System MBean
Browser.
For more information about the System MBean Browser, see Navigating to the System MBean Browser.
- Search for the
IWSReport MBean, or scroll down to Application Defined MBeans, and expand oracle.as.soa.iws > Server : name > Application : name > SOAIWSReportMXBean.
The following image shows the operations, and their descriptions, available for the IWSReport MBean.

Using WLST Commands to Generate IWS Reports
You can use WLST commands to generate IWS reports or retrieve IWS metrics, such as IWS data collection level or IWS snapshot information.
IWS WLST Commands
The following table lists the WLST IWS configuration commands.
Table 4-5 IWS Configuration Commands
| WLST Command | Description |
|---|---|
getSoaIWSSnapshotInterval |
Retrieves the snapshot metrics collection interval. |
setSoaIWSSnapshotInterval |
Sets the snapshot metrics collection interval in minutes. |
getSoaIWSStatisticsLevel |
Retrieves the SOA IWS Statistics level (data collection level). |
setSoaIWSStatisticsLevel |
Sets the SOA IWS Statistics level. |
getSoaIWSStatisticsLevelList |
Retrieves the SOA IWS Statistics level list. |
The following table lists the WLST IWS snapshot retrieval and reporting commands.
Table 4-6 IWS Snapshot Retrieval and Reporting Commands
| WLST Command | Description |
|---|---|
getSoaIWSSnapshotInfo |
Retrieves snapshot information from a SOA server or all servers for the supplied number of hours. |
getSoaIWSSnapshotInfoByDate |
Retrieves snapshot information from a SOA server or all servers for the supplied time period. |
getSoaIWSReportBySnapshotID |
Generates a SOA IWS report for the supplied snapshot IDs. |
getSoaIWSReportByDateTime |
Generates a SOA IWS report for the supplied time period. |
Statistics Included in an IWS Report
An IWS report includes statistics defined by the data collection level that you have set. In addition to system-wide resource usage data, the report can include service and reference endpoint statistics, BPEL and EDN backup queue statistics, and BPEL instance statistics. Statistics on BPEL activities may also be included.
The IWS report contains the following broad sections when the data collection level is set to the most inclusive setting of FINEST:
-
System Resource Usage
Statistics include Java Virtual Machine (JVM) statistics like CPU utilization and memory utilization (for JVM heap and non-heap memory), SOA Data Source statistics that show active connections and connection pool details, and SOA Work Manager statistics that include details on threads.
-
Composite (Rollup) Statistics
Aggregate composite-wise statistics that indicate flow rate (throughput/transactions per second) and latency (in milliseconds) for the composite endpoints and internal backup queues (EDN and BPEL queue).
-
Slowest Composite Endpoints
Aggregate composite-wise statistics that indicate the latency (in milliseconds) and flow rate (throughput) for the slowest endpoints.
-
Backups in Internal Queues
Aggregate statistics for the backups in internal system queues (BPEL queue and EDN queue).
-
Longest Running Business Processes
Aggregate statistics for top asynchronous and synchronous business (BPEL) process instances based on execution time
-
Most Time-Consuming Business Process Activities
Aggregate statistics for top business process activities (BPEL activities like Receive, Invoke, etc) based on execution time.
