18 Using Oracle BPEL Process Manager Sensors and Analytics

This chapter describes how to use sensors to select BPEL activities, variables, and faults to monitor during runtime in a BPEL process. It also describes how to create sensor actions to publish the values of sensors to an endpoint.

This chapter includes the following sections:

For more information about Oracle BPEL Process Manager sensors, see Understanding Sensor Public Views and the Sensor Actions XSD .

18.1 Introduction to Oracle BPEL Process Manager Sensors

Sensors are used to declare interest in specific events throughout the life cycle of a BPEL process instance. In a business process, that can be the activation and completion of a specific activity or the modification of a variable value in the business process.

When a sensor is triggered, a specific sensor value is created. For example, if a sensor declares interest in the completion of a BPEL scope, the sensor value consists of the name of the BPEL scope and a time stamp value of when the activity was completed. If a sensor value declares interest in a BPEL process variable, then the sensor value consists of the following:

  • The value of the variable at the moment it was modified

  • A time stamp when the variable was modified

  • The activity name and type that modified the BPEL variable

The data format for sensor values is normalized and well-defined using XML schema.

A sensor action is an instruction on how to process sensor values. When a sensor is triggered by Oracle BPEL Process Manager, a new sensor value for that sensor is created. After that, all the sensor actions associated with that sensor are performed. A sensor action typically persists the sensor value in a database or sends the normalized sensor value data to a JMS queue or topic. For integration with Oracle BAM, the sensor value can be sent to the Oracle BAM adapter.

You can define the following types of sensors, either through Oracle JDeveloper or manually by providing sensor configuration files.

  • Activity sensors

    Activity sensors monitor the execution of activities within a BPEL process. For example, they can monitor the execution time of an invoke activity or how long it takes to complete a scope. Along with the activity sensor, you can also monitor variables of the activity.

  • Variable sensors

    Variable sensors are used to monitor variables (or parts of a variable) of a BPEL process. For example, variable sensors can monitor the input and output data of a BPEL process.

  • Fault sensors

    Fault sensors are used to monitor BPEL faults.

You typically add or edit sensors as part of the BPEL modeling of activities, faults, and variables.

These sensors are exposed through the following public SQL views:

  • BPEL_ACTIVITY_SENSOR_VALUES

  • BPEL_FAULT_SENSOR_VALUES

  • BPEL_VARIABLE_SENSOR_VALUES

These views can be joined with the BPEL_PROCESS_INSTANCES view to associate the sensor value with the BPEL process instance that created the sensor values. For more information, see Understanding Sensor Public Views and the Sensor Actions XSD.

When you model sensors in Oracle JDeveloper, two new files are created as part of the BPEL process archive:

  • bpel_process_name_sensor.xml

    Contains the sensor definitions of a BPEL process

  • bpel_process_name_sensorAction.xml

    Contains the sensor action definitions of a BPEL process

For information about how these files are created, see How to Configure Activity, Variable, and Fault Sensors and How to Configure Sensor Actions.

After you define sensors for a BPEL process, you must configure sensor actions to publish the sensor data to a specified destination. If no sensor action is defined for a sensor, then nothing happens at runtime.

The following information is required for a sensor action:

  • Name

  • Publish type

    The publish type specifies the destination in which the sensor data must be presented. You can publish sensor data to the following destination types.

    • Database

      Publishes the sensor data to the reports schema in the database. The sensor data can then be queried using SQL.

    • JMS queue

      Publishes the sensor data to a JMS queue. The XML data is posted in accordance with the Sensor.xsd file. This file is included with Oracle JDeveloper in the following directory:

      /soa/integration/seed/soa/shared/bpel/Sensor.xsd
      

      The Sensor.xsd file is also included in the following directory:

      /soa/integration/jdeveloper/seed/soa/shared/bpel/Sensor.xsd
      
    • JMS topic

      Publishes the sensor data to a JMS topic. The XML data is posted in accordance with the same Sensor.xsd file used with JMS queues.

    • Custom

      Publishes the data to a custom Java class.

    • JMS Adapter

      Uses the JMS adapter to publish to remote queues or topics and a variety of different JMS providers. The JMS queue and JMS topic publish types only publish to local JMS destinations.

  • List of sensors

    The sensors for a sensor action.

18.1.1 Composite Sensors

While BPEL sensors are used to declare interest in specific events throughout the life cycle of a BPEL process instance, composite sensors provide a method for implementing trackable fields on messages. Composite sensors enable you to perform the following tasks:

  • Monitor incoming and outgoing messages.

  • Publish JMS data computed from incoming and outgoing messages.

  • Track composite instances initiated through business event subscriptions.

For information about composite sensors, see Defining Composite Sensors .

18.2 Configuring Sensors and Sensor Actions in Oracle JDeveloper

In Oracle JDeveloper, sensor actions and sensors are displayed as part of Monitor view.

18.2.1 How to Access Sensors and Sensor Actions

To access sensors and sensor actions:

  1. Select Change to Monitor view at the top of Oracle BPEL Designer, as shown in Figure 18-1.

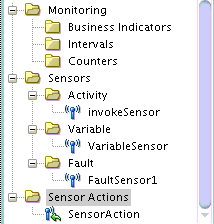
    Figure 18-2 shows the sensor actions and sensors in the Structure window.

    Figure 18-2 Sensors and Sensor Actions Displayed in Oracle JDeveloper
    Description of Figure 18-2 follows
    Description of "Figure 18-2 Sensors and Sensor Actions Displayed in Oracle JDeveloper"

    You typically add or edit sensors as part of the BPEL modeling of activities, faults, and variables.

  2. Add sensor actions by right-clicking the Sensor Actions folder and selecting Create > Sensor Action.

  3. Add activity sensors, variable sensors, or fault sensors as follows:

    1. Expand the Sensors folder.

    2. Right-click the appropriate Activity, Variable, or Fault subfolder.

    3. Click Create.

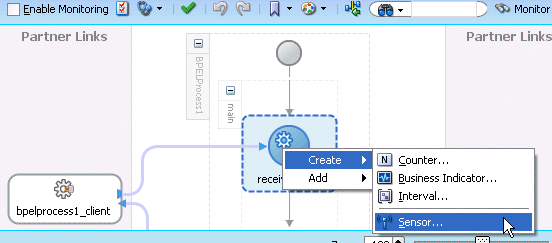
  4. Add sensors to individual activities by right-clicking an activity and selecting Create > Sensor. Figure 18-3 provides details.

    Figure 18-3 Creating an Activity Sensor

    Description of Figure 18-3 follows
    Description of "Figure 18-3 Creating an Activity Sensor"

The following sections describe how to configure sensors and sensor actions.

18.2.2 How to Configure Activity, Variable, and Fault Sensors

This section describes how to configure activity, variable, and fault sensors.

18.2.2.1 To Configure an Activity Sensor:

Assume you are monitoring a loan flow application, and want to know the following:

  • When a scope named GetCreditRating is initiated

  • When it is completed

  • At completion, what is the credit rating for the customer

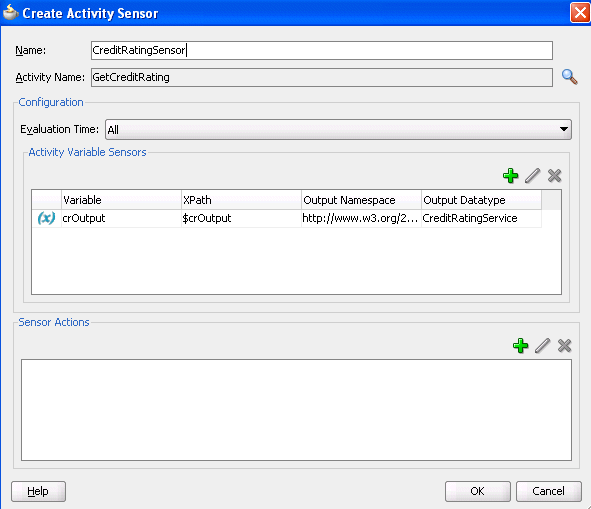
The solution is to create an activity sensor for the GetCreditRating scope in Oracle BPEL Designer, as shown in Figure 18-4.

  1. Select Change to Monitor view at the top of Oracle BPEL Designer.

  2. In the Structure window, expand the Sensors folder.

  3. Right-click Activity, and select Create.

  4. To the right of the Activity Name field, click the Browse icon to select the activity for which to create the sensor. This is a required field.

    Figure 18-4 Creating an Activity Sensor

    Description of Figure 18-4 follows
    Description of "Figure 18-4 Creating an Activity Sensor"

    Activities that have sensors associated with them are identified with a magnifying glass in Oracle BPEL Designer.

    The Evaluation Time list shown in Figure 18-4 controls the point at which the sensor is fired.

  5. Select from the following:

    • All:

      The sensor monitors during the activation, completion, fault, compensation, and retry phases.

    • Activation

      The sensor is fired just before the activity is executed.

    • Completion

      The sensor is fired just after the activity is executed.

    • Fault

      The sensor is fired if a fault occurs during the execution of the activity. Select this value only for sensors that monitor simple activities.

    • Compensation

      The sensor is fired when the associated scope activity is compensated. Select this value only for sensors that monitor scopes.

    • Retry

      The sensor is fired when the associated invoke activity is retried.

    A new entry is created in the bpel_process_name_sensor.xml file:

    <sensor sensorName="CreditRatingSensor"
    
    classname="oracle.tip.pc.services.reports.dca.agents.BpelActivitySensorAgent"
              kind="activity" 
              target="GetCreditRating">
    
      <activityConfig evalTime="all">
        <variable outputNamespace="http://www.w3.org/2001/XMLSchema"
                  outputDataType="int" 
                  target="$crOutput/payload//services:rating"/>
      </activityConfig> 
    </sensor>
    
  6. If you want to create a variable sensor on the activity, then in the Activity Variable Sensors section, click the Add icon. This is an optional field.

  7. If you want to add a sensor action on the activity, then in the Sensor Actions section, click the Add icon. For more information, see How to Configure Sensor Actions.

  8. Click OK.

    Note:

    If you did not specify any values in the Activity Variable Sensors and Sensor Actions sections, you do not receive any validation errors or warning messages in the Log window in Oracle JDeveloper or in any log files. This is the expected behavior.

18.2.2.2 To Configure a Variable Sensor:

If you want to record all incoming loan requests, you can create a variable sensor.

  1. Select Change to Monitor view at the top of Oracle BPEL Designer.

  2. In the Structure window, expand the Sensors folder.

  3. Right-click Variable, and select Create.

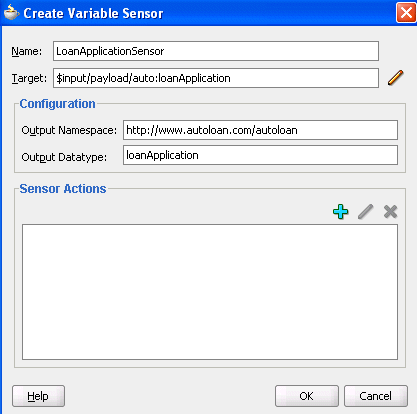
  4. Click the Edit icon to the right of the Target field to create a variable sensor for a variable (for this example, named input), as shown in Figure 18-5.

    Figure 18-5 Creating a Variable Sensor

    Description of Figure 18-5 follows
    Description of "Figure 18-5 Creating a Variable Sensor"

    Based on your selection for the Target field, the Output Namespace and Output Datatype fields are automatically filled in.

    A new entry is created in the bpel_process_name_sensor.xml file:

    <sensor sensorName="LoanApplicationSensor" 
        classname="oracle.tip.pc.services.reports.dca.agents.BpelVariableSensorAgent"
        kind="variable" 
        target="$input/payload">
      <variableConfig outputNamespace="http://www.autoloan.com/ns/autoloan"
                      outputDataType="loanApplication"/> 
    </sensor>
18.2.2.3 To Configure a Fault Sensor:

If you want to monitor faults (for this example, from the identity service), you can create a fault sensor.

  1. Select Change to Monitor view at the top of Oracle BPEL Designer.

  2. In the Structure window, expand the Sensors folder.

  3. Right-click Fault, and select Create.

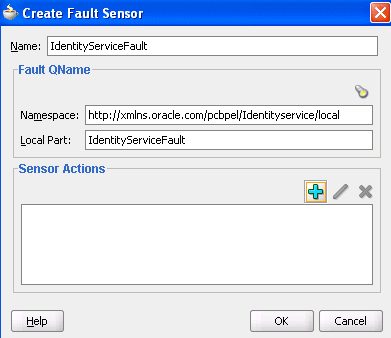
  4. Click the Browse icon above the Namespace field to select to create a fault sensor, as shown in Figure 18-6.

    Figure 18-6 Creating a Fault Sensor

    Description of Figure 18-6 follows
    Description of "Figure 18-6 Creating a Fault Sensor"

    Based on your selection, the Namespace and Local Parts fields are automatically filled in.

  5. If you want to add a sensor action on the fault, then in the Sensor Actions section, click the Add icon. For more information, see How to Configure Sensor Actions.

  6. Click OK.

A new entry is created in the bpel_process_name_sensor.xml file:

<sensor sensorName="IdentityServiceFault"
        classname="oracle.tip.pc.services.reports.dca.agents.BpelFaultSensorAgent"
        kind="fault" 
        target="is:identityServiceFault">
    <faultConfig/>
</sensor>

18.2.3 How to Configure Sensor Actions

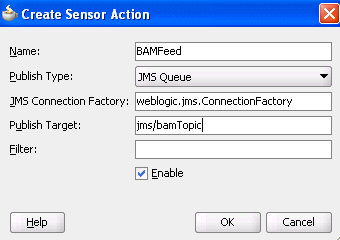
When you create sensors, you identify the activities, variables, and faults you want to monitor during runtime. If you want to publish the values of the sensors to an endpoint (for example, you want to publish the data of the LoanApplicationSensor variable sensor created in Figure 18-5 to a JMS queue), then create a sensor action, as shown in Figure 18-7, and associate it with the LoanApplicationSensor variable.

To configure a sensor action:

  1. Select Change to Monitor view at the top of Oracle BPEL Designer.
  2. In the Structure window, right-click the Sensor Actions folder.
  3. Select Create > Sensor Action.
  4. Enter the details described in Table 18-1.

    Table 18-1 Sensor Actions Dialog

    Field Description

    Name

    Enter a name or accept the default name.

    Publish Type

    Select the destination to which to publish sensor data. For more information, see section Introduction to Sensors.

    JMS Connection Factory

    If your publish type is JMS Queue, JMS Topic, or JMS Adapter, specify the connection factory.

    Publish Target

    If your publish type is JMS Queue, JMS Topic, Custom, or JMS Adapter, specify the publish target. The publish target represents different things depending on the publish type specified:

    • If the publish type is a database, this field is left blank.

    • If the publish type is JMS Queue, JMS Topic, or JMS Adapter, this represents the JMS destination's JNDI name.

    • If the publish type is Custom, this represents the fully-qualified Java class name.

    Filter

    Enter filter logic as a boolean expression. A filter enables you to monitor sensor data within a specific range. For an example of a configured filter, see Figure 18-9.

    Enable

    Deselect this check box to disable a sensor action. By default, sensor actions are enabled. If you disable a sensor action by deselecting this check box, the action does not publish data.

    Figure 18-7 Creating a Sensor Action

    Description of Figure 18-7 follows
    Description of "Figure 18-7 Creating a Sensor Action"

    A new entry is created in the bpel_process_name_sensorAction.xml file:

    <action name="BAMFeed"
            enabled="true"
            publishType="JMSQueue"
            publishTarget="jms/bamTopic"> 
      <sensorName>LoanApplicationSensor</sensorName>
      <property name=“JMSConnectionFactory“> 
        weblogic.jms.ConnectionFactory
      </property>
    </action>

    Note:

    You cannot specify a < (less than) sign in the Filter field of the Sensor Action dialog. If you do, Oracle JDeveloper translates the < sign to &lt; in the bpel_process_name_sensorAction.xml file. In addition, you cannot specify a < sign by directly editing the filename_sensorAction.xml file. This action causes an error.

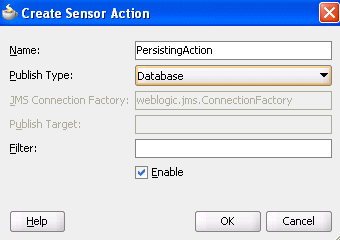
  5. If you want to publish the values of LoanApplicationSensor and CreditRatingSensor to the reports schema in the database, create an additional sensor action, as shown in Figure 18-8, and associate it with both CreditRatingSensor and LoanApplicationSensor.

    Figure 18-8 Creating an Additional Sensor Action

    Description of Figure 18-8 follows
    Description of "Figure 18-8 Creating an Additional Sensor Action"

    A new entry is created in the bpel_process_name_sensorAction.xml file:

    <action name="PersistingAction"
         enabled="true" 
         publishType="BPELReportsSchema">
      <sensorName>LoanApplicationSensor</sensorName> 
      <sensorName>CreditRatingSensor</sensorName>
    </action
    

    The data of one sensor can be published to multiple endpoints. In the two preceding code samples, the data of LoanApplicationSensor was published to a JMS queue and to the reports schema in the database.

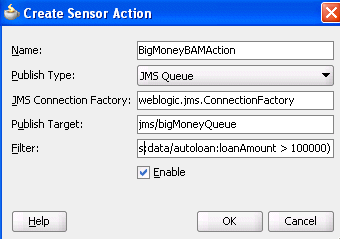
  6. If you want to monitor loan requests for which the loan amount is greater than $100,000, create a sensor action with a filter, as shown in Figure 18-9. There is no design-time validation of the filter query. You must ensure the query is correct.

    Figure 18-9 Creating a Sensor Action with a Filter

    Description of Figure 18-9 follows
    Description of "Figure 18-9 Creating a Sensor Action with a Filter"

    A new entry is created in the bpel_process_name_sensorAction.xml file:

    <action name="BigMoneyBAMAction"
            enabled='true' 
            filter="boolean(/s:actionData/s:payload
                            /s:variableData/s:data
                            /autoloan:loanAmount > 100000)"
            publishType="JMSQueue" 
            publishTarget="jms/bigMoneyQueue">
      <sensorName>LoanApplicationSensor</sensorName> 
      <property name=“JMSConnectionFactory“>
        weblogic.jms.ConnectionFactory 
      </property>
    </action>

    Note:

    • You must specify all the namespaces that are required to configure an action filter in the bpel_process_name_sensorAction.xml configuration file. For example, assume you have a customer XML-schema element with namespace "http://myCustomer" and you want to create a filter on the customer age element. Therefore, you must manually declare the namespace for "http:/myCustomer" in the file before you can use it in your filter. Otherwise, it is not possible to create a valid query. Add xmlns:ns1="http://myCustomer" in the attribute declaration part of the file. You can then use ..../ns1:customer/ns1:age/... in your query.

    • You must specify the filter as a boolean XPath expression.

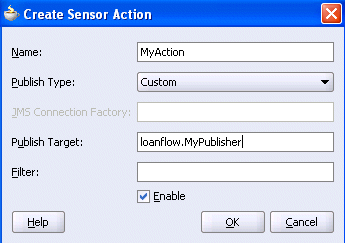
  7. If you have special requirements for a sensor action that cannot be accomplished by using the built-in publish types (database, JMS queue, JMS topic, and JMS adapter), then you can create a sensor action with the custom publish type, as shown in Figure 18-10. The name in the Publish Target field denotes a fully qualified Java class name that must be implemented. For more information, see How to Create a Custom Data Publisher.

    Figure 18-10 Using the Custom Publish Type

    Description of Figure 18-10 follows
    Description of "Figure 18-10 Using the Custom Publish Type"

18.2.4 How to Publish to Remote Topics and Queues

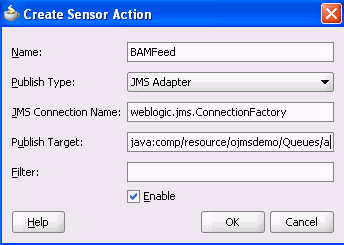
The JMS queue and JMS topic publish types only publish to local JMS destinations. If you want to publish sensor data to remote topics and queues, use the JMS adapter publish type, as shown in Figure 18-11.

Figure 18-11 Using the JMS Adapter Publish Type
Description of Figure 18-11 follows
Description of "Figure 18-11 Using the JMS Adapter Publish Type"

In addition to enabling you to publish sensor data to remote topics and queues, the JMS adapter supports a variety of different JMS providers, including:

  • Third-party JMS providers such as Tibco JMS, IBM WebSphere MQ JMS, and SonicMQ

  • Oracle Enterprise Messaging Service (OEMS) providers such as memory/file and database

If you select the JMS adapter publish type, you must create an entry in the weblogic-ra.xml file, which is updated through editing in the Oracle WebLogic Console. Each JMS connection factory (pool) entry created in this console corresponds to one JNDI entry in weblogic-ra.xml. Update the Sensor Actions dialog with the chosen JNDI name selected during the creation of the JMS connection factory (pool).

For more information about the JMS adapter, see Understanding Technology Adapters.

18.2.5 How to Create a Custom Data Publisher

To create a custom data publisher, perform the following steps:

To create a custom data publisher:

  1. In the Applications window, double-click the BPEL project.

    The Project Properties dialog appears.

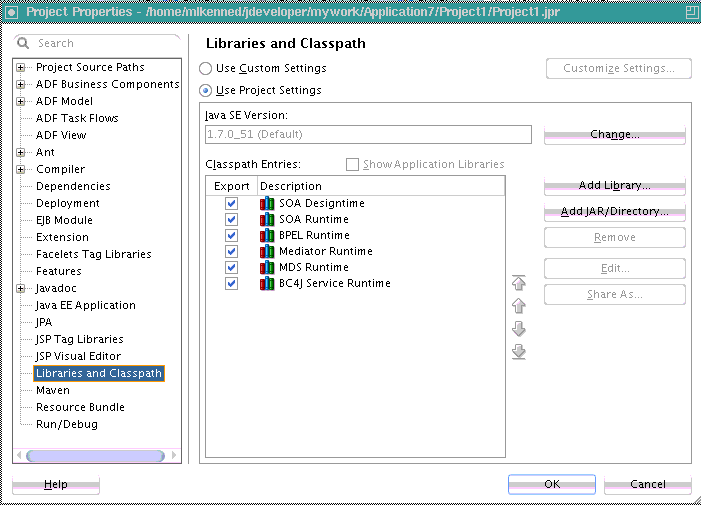
  2. Click Libraries and Classpath.
  3. Browse and select the following:
    SOA_ORACLE_HOME/lib/java/shared/oracle.soainfra.common/11.1.1/orabpel.jar
    

    Figure 18-12 provides details.

    Figure 18-12 Project Properties Dialog

    Description of Figure 18-12 follows
    Description of "Figure 18-12 Project Properties Dialog"
  4. Create a new Java class.

    The package and class name must match the publish target name of the sensor action.

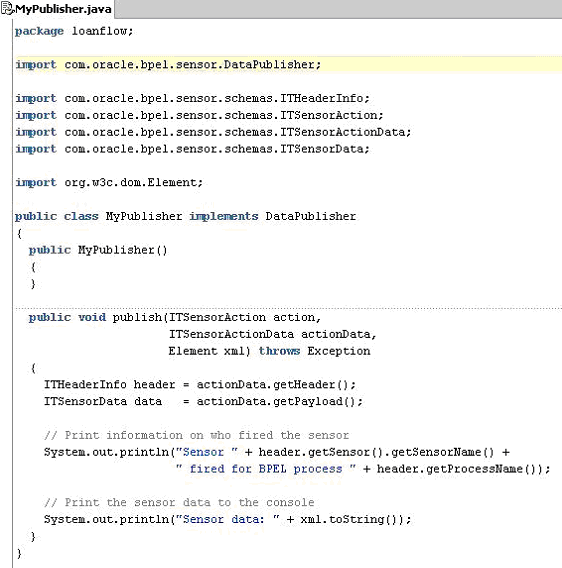
  5. Implement the com.oracle.bpel.sensor.DataPublisher interface.

    This updates the source file and fills in the methods and import statements of the DataPublisher interface.

  6. Using Oracle JDeveloper, implement the publish method of the DataPublisher interface, as shown in the sample custom data publisher class in Figure 18-13.

    Figure 18-13 Custom Data Publisher Class

    Description of Figure 18-13 follows
    Description of "Figure 18-13 Custom Data Publisher Class"
  7. Ensure that the class compiles successfully.

    The next time that you deploy the BPEL process, the Java class is added to the SOA archive (SAR) and deployed.

Note:

Ensure that additional Java libraries needed to implement the data publisher are in the class path.

Oracle BPEL Process Manager can execute multiple process instances simultaneously, so ensure that the code in your data publisher is thread safe, or add appropriate synchronization blocks. To guarantee high throughput, do not use shared data objects that require synchronization.

18.2.6 How to Register the Sensors and Sensor Actions in the composite.xml File

Oracle JDeveloper automatically updates the composite.xml file to include appropriate properties for sensors and sensor actions, as shown in the following exxample:

<composite name="JMSQFComposite" applicationName="JMSQueueFilterApp"
   revision="1.0" label="2007-04-02_14-41-31_553" mode="active" state="on">
  <import namespace="http://xmlns.oracle.com/JMSQueueFilter"
  location="JMSQueueFilter.wsdl" importType="wsdl"/>
    <service name="client">          
      <interface.wsdl interface="http://xmlns.oracle.com/
         JMSQueueFilter#wsdl.interface(JMSQueueFilter)"/>
      <binding.ws
      port="http://xmlns.oracle.com/JMSQueueFilter#wsdl.endpoint(client/
         JMSQueueFilter_pt)"/>
    </service>
    <component name="JMSQueueFilter">
    <implementation.bpel src="JMSQueueFilter.bpel"/>
    <property name="configuration.sensorLocation" type="xs:string"
    many="false">JMSQueueFilter_sensor.xml</property>
    <property name="configuration.sensorActionLocation" type="xs:string"
    many="false">JMSQueueFilter_sensorAction.xml</property>
</component>
<wire>
   <source.uri>client</source.uri>
   <target.uri>JMSQueueFilter/client</target.uri>
</wire>
</composite>

You can specify additional properties with <property name= ...>, as shown in the preceding example.

18.3 Viewing Sensors and Sensor Action Definitions in Oracle Enterprise Manager Fusion Middleware Control

Oracle Enterprise Manager Fusion Middleware Control provides support for viewing the metadata of sensors, sensor actions, and the sensor data created as part of the process execution.

For more information, see Administering Oracle SOA Suite and Oracle Business Process Management Suite.

Note:

Only sensors with an associated database sensor action are displayed in Oracle Enterprise Manager Fusion Middleware Control. Sensors associated with a JMS queue, JMS topic, remote JMS, or custom sensor action are not displayed.

18.4 Configuring BPEL Process Analytics

BPEL process analytics provide the following features:

  • A uniform measurement mechanism across Oracle SOA Suite components such as Oracle BPMN, human workflow, and BPEL processes for collecting disparate data.

  • A runtime infrastructure for evaluating, publishing, and synthesizing measurement events.

For information about BPEL process analytics integration with Oracle Business Activity Monitoring (BAM), see Chapter "Integrating with Oracle SOA Suite" of Monitoring Business Activity with Oracle BAM and Chapter "Gaining Business Insights with Oracle Business Activity Monitoring" of Understanding Oracle SOA Suite.

18.4.1 Introduction to Business Indicators

Business indicators are defined in a SOA composite application to identify objects that contribute to the analytical and metric calculations of components. Business indicators consist of the following types:

  • Measures

    Store the values of a variable such as a sales amount, an employee salary, and so on. Measures only enable data types that are continuous, and are typically numeric values.

  • Dimensions

    Label group or filter measures.

  • Counters

    Track the number of times a process instance completes a marked element.

Metadata specified dimensions and measures are captured as part of the measurement.

Business indicators are designed to be sharable and bindable to multiple BPEL processes within the composite. This enables you to monitor their value changes from one process to another when the composite is executed during analytics runtime.

18.4.2 Introduction to Standard Sampling Points

Standard sampling points are points in a component path at which the component inherently attempts to create a measurement event. Measurement metadata can configure measurements at these standard sampling points. If appropriate measurement metadata exists that enables some or all of the standard sampling point measurement events, then these measurement events are generated, published, and processed. For example, a standard sampling point in a process can be the following:

  • Start and stop a process

  • Start and stop an activity

  • Faults

18.4.3 Introduction to User-Defined Sampling Points

These are the sampling points that you can specify on a component:

  • Measurement mark:

    A single point of measurement for the specified measure.

  • Measurement interval:

    A measurement consisting of a starting point and ending point (therefore, constituting an interval identified by a measurement interval name) typically along the path taken by a component.

  • Measurement counter:

    A measurement that identifies the occurrence of a specific point in the path taken by a component.

Measurements are a combination of a sampling point and a selected business indicator executed at runtime. For more information about measurements, see How to Define Measurements.

18.4.4 How to Access Analytics View

You edit business indicators and measurements in analytics view of a BPEL process in Oracle BPEL Designer.

To access analytics view:

  1. In the SOA Composite Editor, double-click a BPEL process.
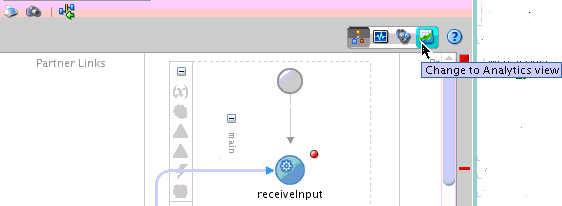
  2. Above the BPEL process in Oracle BPEL Designer, click Change to Analytics view. Figure 18-14 provides details.

    Figure 18-14 Analytics View Icon in Oracle BPEL Designer

    Description of Figure 18-14 follows
    Description of "Figure 18-14 Analytics View Icon in Oracle BPEL Designer"

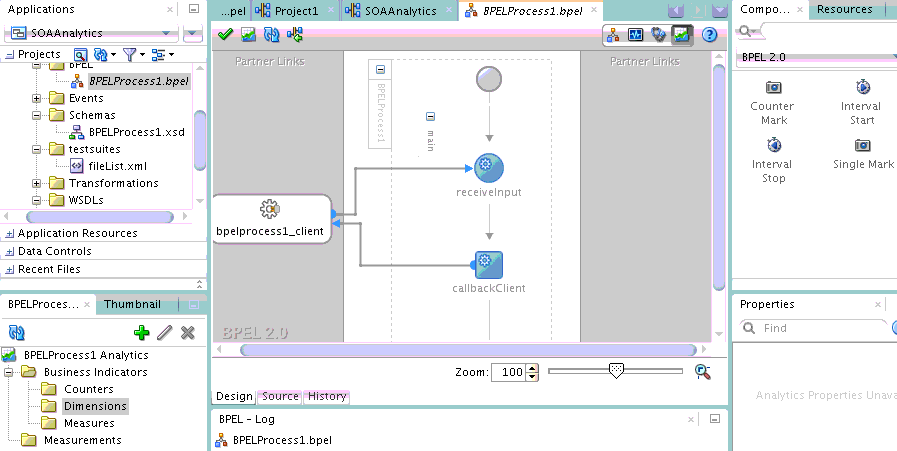
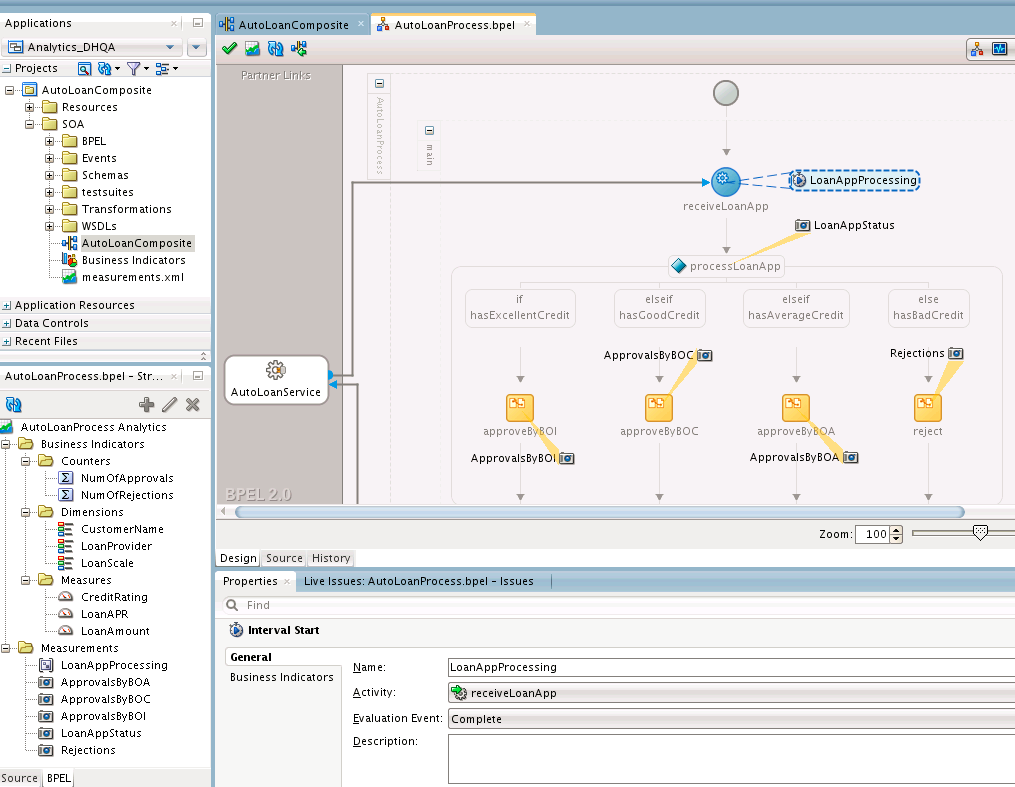
    This displays the BPEL process in analytics view, as shown in Figure 18-15.

    • The Components window displays a palette of measurement marks and intervals that can be dragged onto BPEL process activities.

    • The Structure window displays business indicators for creating counters, dimensions, and measures.

    Figure 18-15 Analytics View of a BPEL Process

    Description of Figure 18-15 follows
    Description of "Figure 18-15 Analytics View of a BPEL Process"

    When business indicator and measurement design is complete, analytics view looks similar to that shown in Figure 18-16.

    • Business indicators (counters, dimensions, and measures) and measurements (intervals and marks) defined for the BPEL process are displayed in the Structure window. You can create, edit, and delete business indicators from the Structure window. You can edit and delete, but not create, measurements from the Structure window. Measurements are created by dragging the appropriate icon from the Components window.

    • Measurement intervals and marks are defined as floaters on top of the read-only activities in the BPEL process. The measurement floaters can be moved around by mouse on top of activities in the BPEL process to achieve the necessary topology.

    • The Property Inspector at the bottom of Oracle BPEL Designer enables you to edit the selected business indicator or measurement. Changes are automatically committed.

    Figure 18-16 Analytics View with Business Indicator and Measurement Design Complete

    Description of Figure 18-16 follows
    Description of "Figure 18-16 Analytics View with Business Indicator and Measurement Design Complete"
18.4.4.1 How to Define Business Indicators

You can bind business indicators to BPEL XPath expression functions during creation. Business indicators are designed to be sharable and bindable to multiple BPEL processes within the composite. This enables you to monitor their value changes from one process to another when the composite is executed during analytics runtime.

You can define the following business indicators in a BPEL process:

  • Define a counter binding for the BPEL process. An available counter is selected and bound to the BPEL process without the need to specify any XPath expression. A counter is meant to count how many times a certain BPEL activity gets executed at runtime. This means there is no need to specify any XPath expression for the binding.

  • Define a dimension binding for the BPEL process. An available dimension is selected and bound to a BPEL XPath expression.

  • Define a measure binding for the BPEL process. An available measure is selected and bound to a BPEL XPath expression.

For more information about business indicators, see Introduction to Business Indicators.

After definition, you can edit and delete business indicators in the Business Indicator Overview Editor described in How to Edit Business Indicators in the Business Indicator Overview Editor.

18.4.4.1.1 Defining Counters

You can define business indicator counters.

To define counters:

  1. Access analytics view in a BPEL process as described in How to Access Analytics View.
  2. In the Structure window, right-click Counters and select Create.

    The Bind Counter dialog is displayed.

  3. Select a name, and click OK. If there is no counter to which to bind, click the Add icon to create a new counter. You can also create counters in the Business Indicator Overview Editor that are then displayed for selection in this dialog. For more information, see How to Edit Business Indicators in the Business Indicator Overview Editor.

    When complete, the Bind Counter dialog looks as shown in Figure 18-17.

    Figure 18-17 Bind Counter Dialog

    Description of Figure 18-17 follows
    Description of "Figure 18-17 Bind Counter Dialog"
18.4.4.1.2 Defining Dimensions

You can define business indicator dimensions.

To define dimensions:

  1. Access analytics view in a BPEL process as described in How to Access Analytics View.
  2. In the Structure window, right-click Dimensions and select Create.

    The Bind Dimension dialog is displayed.

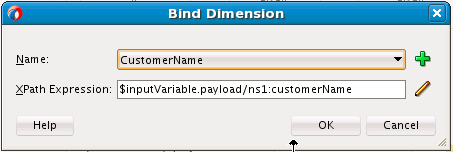
  3. Enter values appropriate to your environment, and click OK. Table 18-2 provides details.

    Table 18-2 Bind Dimension Dialog

    Element Description

    Name

    Select a name. If there is no dimension to which to bind, click the Add icon to invoke the Create Dimension dialog to enter a name and select a data type (boolean, decimal, integer, string or time) for the dimension.

    You can also create dimensions in the Business Indicator Overview Editor that are then displayed for selection in this dialog. For more information, see How to Edit Business Indicators in the Business Indicator Overview Editor.

    Note: Optional ranges can be specified for some data types such as integers and decimals. This enables the dimensions to show their ranges at analytics runtime for better reporting.

    XPath Expression

    Click the Edit icon to invoke the Expression Builder dialog in which to build an XPath expression for binding to the dimension.

    When complete, the Bind Dimension dialog looks as shown in Figure 18-18.

    Figure 18-18 Bind Dimension Dialog

    Description of Figure 18-18 follows
    Description of "Figure 18-18 Bind Dimension Dialog"
18.4.4.1.3 Defining Measures

You can define business indicator measures.

To define measures:

  1. Access analytics view in a BPEL process as described in How to Access Analytics View.
  2. In the Structure window, right-click Measures and select Create.

    The Bind Measure dialog is displayed.

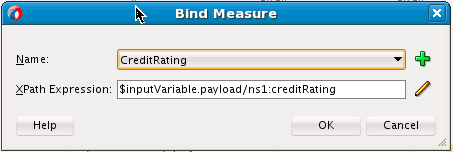
  3. Enter values appropriate to your environment, and click OK. Table 18-3 provides details.

    Table 18-3 Bind Measure Dialog

    Element Description

    Name

    Select a name. If there is no measure to which to bind, click the Add icon to invoke the Create Measure dialog to enter a name and select a measure (decimal or integer).

    You can also create measures in the Business Indicator Overview Editor that are then displayed for selection in this dialog. For more information, see How to Edit Business Indicators in the Business Indicator Overview Editor.

    XPath Expression

    Click the Edit icon to invoke the Expression Builder dialog in which to build the XPath expression for binding to the measure.

    When complete, the Bind Measure dialog looks as shown in Figure 18-19.

    Figure 18-19 Bind Measure Dialog

    Description of Figure 18-19 follows
    Description of "Figure 18-19 Bind Measure Dialog"
18.4.4.2 How to Define Measurements

The Components window consists of the measurement types shown in Figure 18-20:

Figure 18-20 Measurement Types in the Components Window
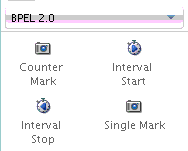
Description of Figure 18-20 follows
Description of "Figure 18-20 Measurement Types in the Components Window"

You drag a measurement type on to a BPEL process activity in the designer for initial creation. Measurements are defined as floaters on top of read-only activities in the BPEL process. You can edit the measurement later in the Property Inspector or by double-clicking the measurement. The measurement floaters can be moved around by mouse on top of the BPEL process to achieve the necessary topology.

Each measurement type includes two tabs:

  • General tab: For defining the impacted activity, the evaluation event that triggers the measurement being taken, the measurement description, and whether the measurement is enabled.

  • Business Indicator tab: For selecting the business indicators for the measurement.

18.4.4.2.1 How to Define a Counter Mark

You can define a counter mark measurement.

To define a counter mark:

  1. Access analytics view in a BPEL process as described in How to Access Analytics View.
  2. From the Components window, drag a Counter Mark icon on to an activity or right-click an activity and select Counter Mark.
  3. Double-click the icon that is added.

    The Counter Mark dialog is displayed.

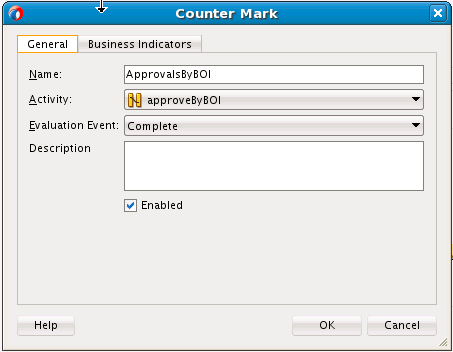
  4. Enter values appropriate to your environment, and click OK. Table 18-4 provides details.

    Table 18-4 Counter Mark Dialog - General Tab

    Element Description

    Name

    Enter the name of the counter mark.

    Activity

    Displays the BPEL activity on which the counter mark is taken.

    Evaluation Event

    Select the specific activity event that triggers the counter mark. It can be one of the five activity events: Activate, Compensate, Complete, Fault, and Retry.

    Description

    Enter an optional description of the counter mark.

    Enabled

    Select whether to enable the counter mark. By default, this measurement is enabled.

    When complete, the General tab of the Counter Mark dialog looks as shown in Figure 18-21.

    Figure 18-21 General Tab of Counter Mark Dialog

    Description of Figure 18-21 follows
    Description of "Figure 18-21 General Tab of Counter Mark Dialog"
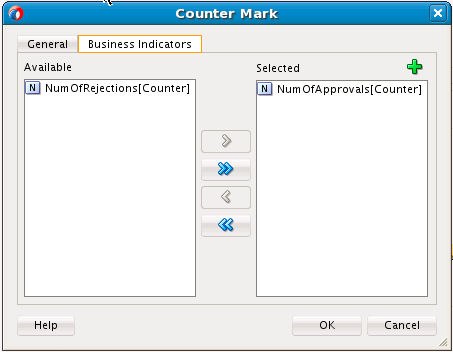
  5. Click the Business Indicators tab.
  6. Move selected business indicators to the Selected section. You can also click the Add icon to create new business indicators. Created business indicators are automatically added to the Selected section.

    Note:

    You can only create and select counters for counter marks. Dimensions are implicitly added to counter marks, and you cannot create and select measures for counter marks. Measures can only be created and selected for interval starts, interval stops, and single marks.

    When complete, the Business Indicators tab looks as shown in Figure 18-22.

    Figure 18-22 Business Indicators Tab

    Description of Figure 18-22 follows
    Description of "Figure 18-22 Business Indicators Tab"
18.4.4.2.2 How to Define an Interval Start

You can define an interval start measurement.

To define an interval start:

  1. Access analytics view in a BPEL process as described in How to Access Analytics View.
  2. From the Components window, drag an Interval Start icon on to an activity or right-click an activity and select Interval Start.
  3. Double-click the icon that is added.

    The Interval Start dialog is displayed.

  4. Enter values appropriate to your environment, and click OK. Table 18-5 provides details.

    Table 18-5 Interval Start Dialog - General Tab

    Element Description

    Name

    Enter the name of the interval start.

    Activity

    Displays the BPEL activity from which the interval starts.

    Evaluation Event

    Select the specific activity event that triggers the start of the interval. It can be one of the five activity events: Activate, Compensate, Complete, Fault, and Retry.

    Description

    Enter an optional description of the interval start.

    Enabled

    Select whether to enable the interval start. By default, this measurement is enabled.

    Note:

    Any name change is propagated to the corresponding interval stop measurement because the interval name is shared by both the interval start and the interval stop measurements.

    In addition, any activity change updates the activity anchor of the interval start floater in the designer.

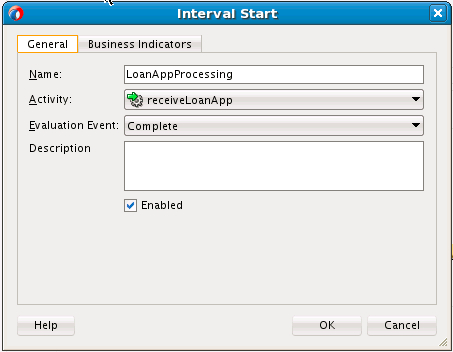
    When complete, the General tab of the Interval Start dialog looks as shown in Figure 18-23.

    Figure 18-23 General Tab of Interval Start Dialog

    Description of Figure 18-23 follows
    Description of "Figure 18-23 General Tab of Interval Start Dialog"
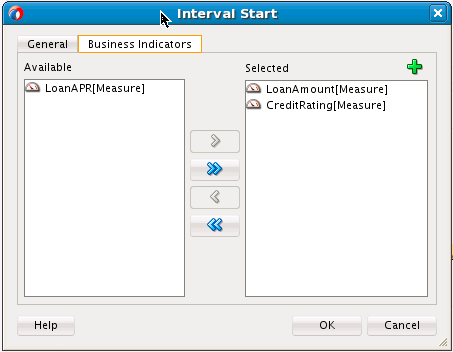
  5. Click the Business Indicators tab.
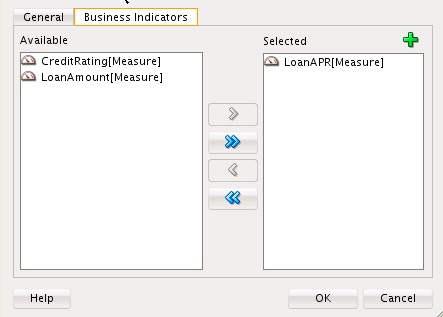
  6. Move selected business indicators to the Selected section. You can also click the Add icon to create new business indicators. Created business indicators are automatically added to the Selected section.

    Note:

    You can only create and select measures for interval starts. Dimensions are implicitly added to interval starts, and you cannot create and select counters for interval starts. Counters can only be created and selected for counter marks.

    Any change on the business indicators for an interval start is propagated to its corresponding interval stop because both the interval start and stop share the same business indicators.

    When complete, the Business Indicators tab looks as shown in Figure 18-24

    Figure 18-24 Business Indicators Tab

    Description of Figure 18-24 follows
    Description of "Figure 18-24 Business Indicators Tab"
18.4.4.2.3 How to Define an Interval Stop

You can define an interval stop measurement.

To define an interval stop:

  1. Access analytics view in a BPEL process as described in How to Access Analytics View.
  2. From the Components window, drag an Interval Stop icon on to an activity or right-click an activity and select Interval Stop.
  3. Double-click the icon that is added.

    The Interval End dialog is displayed.

  4. Enter values appropriate to your environment, and click OK. Table 18-6 provides details.

    Table 18-6 Interval End Dialog - General Tab

    Element Description

    Name

    Enter the name of the interval stop.

    Activity

    Displays the BPEL activity on which the interval stops.

    Evaluation Event

    Select the specific activity event that triggers the stop of the interval. It can be one of the five activity events: Activate, Compensate, Complete, Fault, and Retry.

    Description

    Enter an optional description of the interval stop.

    Enabled

    Select whether to enable the interval stop. By default, this measurement is enabled.

    Note:

    A name change is propagated to its corresponding interval start, because the interval name is shared by both the interval start and the interval stop measurements.

    An activity change updates the activity anchor of the interval stop floater in the designer.

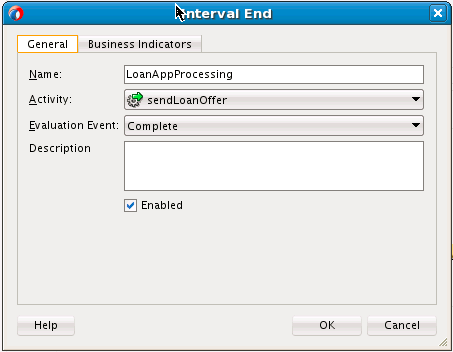
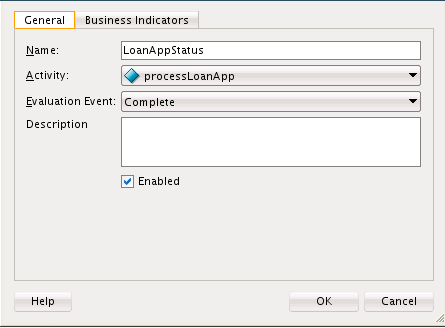
    When complete, the General tab of the Interval End dialog looks as shown in Figure 18-25.

    Figure 18-25 General Tab of Interval End Dialog

    Description of Figure 18-25 follows
    Description of "Figure 18-25 General Tab of Interval End Dialog"
  5. Click the Business Indicators tab.
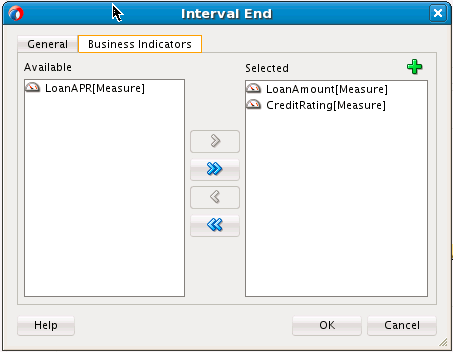
  6. Move selected business indicators to the Selected section. You can also click the Add icon to create new business indicators. Created business indicators are automatically added to the Selected section.

    Note:

    You can only create and select measures for interval stops. Dimensions are implicitly added to interval stops, and you cannot create and select counters for interval stops. Counters can only be created and selected for counter marks.

    Any change on the business indicators for an interval stop is propagated to its corresponding interval start, because both the interval start and stop share the same business indicators.

    When complete, the Business Indicators tab looks as shown in Figure 18-26.

    Figure 18-26 Business Indicators Tab

    Description of Figure 18-26 follows
    Description of "Figure 18-26 Business Indicators Tab"
18.4.4.2.4 How to Define a Single Mark

You can define a single mark measurement.

To define a single mark:

  1. Access analytics view in a BPEL process as described in How to Access Analytics View.
  2. From the Components window, drag a Single Mark icon on to an activity or right-click an activity and select Single Mark.
  3. Double-click the icon that is added.

    The Management Mark dialog is displayed.

  4. Enter values appropriate to your environment, and click OK. Table 18-7 provides details.

    Table 18-7 Management Mark Dialog - General Tab

    Element Description

    Name

    Enter the name of the single mark.

    Activity

    Displays the BPEL activity on which the single mark is taken.

    Evaluation Event

    Select the specific activity event that triggers the single mark. It can be one of the five activity events: Activate, Compensate, Complete, Fault, and Retry.

    Description

    Enter an optional description of the single mark.

    Enabled

    Select whether to enable the single mark. By default, this measurement is enabled.

    Note:

    The activity change updates the activity anchor of the single mark floater in the designer.

    When complete, the General tab of the Management Mark dialog looks as shown in Figure 18-27.

    Figure 18-27 General Tab of Management Mark Dialog

    Description of Figure 18-27 follows
    Description of "Figure 18-27 General Tab of Management Mark Dialog"
  5. Click the Business Indicators tab.
  6. Move selected business indicators to the Selected section. You can also click the Add icon to create new business indicators. Created business indicators are automatically added to the Selected section.

    Note:

    The activity change updates the activity anchor of the single mark floater in the designer.

    When complete, the Business Indicators tab looks as shown in Figure 18-28.

    Figure 18-28 Business Indicators Tab

    Description of Figure 18-28 follows
    Description of "Figure 18-28 Business Indicators Tab"

    Note:

    You can only create and select measures for single marks. Dimensions are implicitly added to single marks, and you cannot create and select counters for single marks. Counters can only be created and selected for counter marks.

18.4.4.3 How to Configure Composite-Level Analytic Sampling Points

You can configure analytic sampling points (process start/stop, activity start/stop) at the SOA composite application level. Composite level configuration applies to all BPEL processes in the composite. For information about configuring analytics at the specific BPEL process level, see How to Configure Process-Level Analytic Sampling Points.

To configure composite-level analytic sampling points:

  1. Above the SOA Composite Editor, click the Configure Analytics icon, as shown in Figure 18-29.

    Figure 18-29 Configure Analytics Icon Above SOA Composite Editor

    Description of Figure 18-29 follows
    Description of "Figure 18-29 Configure Analytics Icon Above SOA Composite Editor"

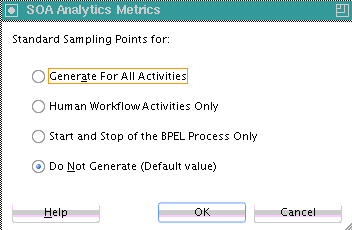
    The SOA Analytics Metrics dialog is displayed, as shown in Figure 18-30.

    Figure 18-30 SOA Analytics Metrics Dialog

    Description of Figure 18-30 follows
    Description of "Figure 18-30 SOA Analytics Metrics Dialog"
  2. Select appropriate options, then click OK. Table 18-8 provides details.

    Table 18-8 Composite Analytics Setting Dialog

    Element Description

    Generate For All Activities

    Generates standard analytic events for all process and activity events.

    Human Workflow Activities Only

    Generates standard analytic events only for human task events.

    Start and Stop of the BPEL Process Only

    Generates standard analytic events for starting and stopping of the BPEL process.

    Do not Generate

    Does not generate any standard analytic events.

18.4.4.4 How to Configure Process-Level Analytic Sampling Points

You can configure analytic sampling points (process start/stop, activity start/stop) at the individual BPEL process level. Process level configuration only applies to the generation of standard analytics events for the specific BPEL process. It does not impact the generation of user-defined measurement events for the process. User-defined measurements always generate their measurement events, if enabled.

For information about configuring analytics at the SOA composite application level, see How to Configure Composite-Level Analytic Sampling Points.

To configure process-level analytic sampling points:

  1. Access the BPEL process in analytics view as described in How to Access Analytics View.
  2. Above the BPEL process, click the Configure Analytics icon, as shown in Figure 18-31.

    Figure 18-31 Configure Analytics Icon

    Description of Figure 18-31 follows
    Description of "Figure 18-31 Configure Analytics Icon"

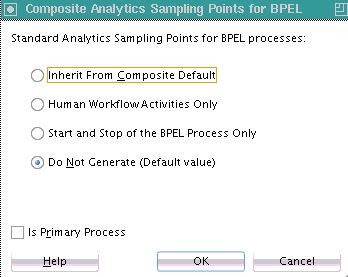
    The Composite Analytics Sampling Points for BPEL dialog is displayed, as shown in Figure 18-32.

    Figure 18-32 Composite Analytics Sampling Points for BPEL Dialog

    Description of Figure 18-32 follows
    Description of "Figure 18-32 Composite Analytics Sampling Points for BPEL Dialog"
  3. Select appropriate options, then click OK. Table 18-9 provides details.

    Table 18-9 Process Analytics Setting Dialog

    Element Description

    Inherit From Composite Default

    Inherits the analytics setting from the composite level analytics configuration described in How to Configure Composite-Level Analytic Sampling Points.

    Human Workflow Activities Only

    Generates standard analytic events for human task activity events.

    Generate For Interactive(s) Only

    Generates standard analytic events only for interactive process and activity events such as human task events.

    Start and Stop of the BPEL Process Only

    Generates standard analytics events for the starting and stopping of the BPEL process.

    Do not Generate

    Does not generate any standard analytic events.

    Is Primary Process

    Select to inform analytics runtime if the process is one of the primary processes for the SOA composite application.

18.4.5 How to Edit Business Indicators in the Business Indicator Overview Editor

You can create, edit, and delete business indicators for the SOA composite application in the Business Indicator Overview Editor, regardless of whether or how these business indicators are bound to specific BPEL processes. This editor does not change the bindings for those business indicators as long as they are not deleted. When a business indicator is deleted, all its bindings with the specific BPEL processes are also deleted.

The Business Indicator Overview Editor is the only way to edit and delete business indicators. From the various dialogs for counters, dimensions, and measures that you access from the Structure window or Property Inspector, you cannot edit or delete the business indicators. You can only edit their bindings to the BPEL process. The view of business indicators from the Structure window or Property Inspector is actually a binding view of the business indicators, and not a view of all the business indicators. Any unbound business indicators do not show up from the Structure window or Property Inspector.

Any relevant change in the Business Indicator Overview Editor is reflected in the Structure window or Property Inspector. Any relevant change from the Structure window or Property Inspector is reflected in the Business Indicator Overview Editor.

To edit business indicators in the Business Indicator Overview Editor:

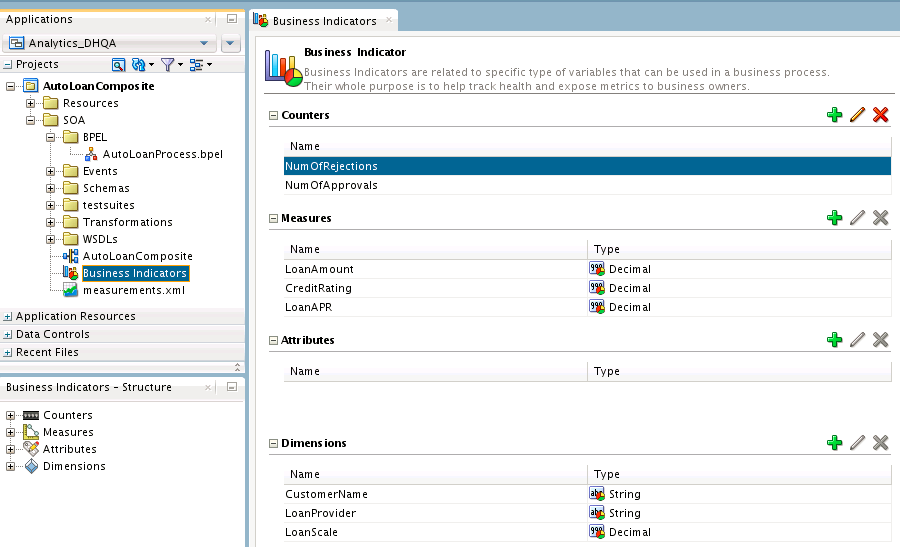
  1. In the Applications window, double-click Business Indicators. Figure 18-33 provides details.

    Figure 18-33 Business Indicators Overview Editor

    Description of Figure 18-33 follows
    Description of "Figure 18-33 Business Indicators Overview Editor"
  2. Create, edit, and delete business indicators for counters, measures, and dimensions, as required.

    Note:

    You can also create a special type of business indicator called an attribute. However, Oracle SOA Suite analytics design time does not currently support attribute binding to BPEL processes. Therefore, you cannot create or bind attributes to the BPEL process in the Structure window or Property Inspector.

18.4.6 Deploying BPEL Analytics

Analytic configurations are included with SOA composite application deployment. If there are no analytics defined in the composite, no deployment of analytics occurs.

The SOA analytics deployment performs the following procedures:

  • Populates the analytics definition (composite, process, activity, role) data objects.

  • Creates the composite-specific physical and logical data objects (process and activity).

Analytics deployment is divided into two steps based on whether the data population is at the composite level or the component (BPEL process) level:

  • Composite-level analytics deployment

    The composite definition data object is populated and the composite-specific physical and logical data objects are created (process and activity). Composite-level analytics deployment is invoked at composite deployment time. This deployment step is performed once for a composite.

  • Component-level analytics deployment

    The process, activity, and role definition data objects are populated. Component-level analytics deployment is invoked at component deployment time. This deployment step is performed for each component of the composite.

18.4.7 Viewing BPEL Analytics at Runtime

The measurement events based on the deployed analytics metadata are triggered. BPEL process and activity events such as start and stop trigger the measurement events. A measurement event captures the values of all business indicators defined for the measurement from the BPEL process service engine, and can be synthesized and published to Oracle BAM.

BPEL process and activity events themselves can also be published to Oracle BAM based on analytics sampling control. BPEL process and activity events also capture applicable business intelligence values.

BPEL measurement events are published to SOA analytics data objects (process and activity) in BAM.

For information about BPEL process analytics integration with Oracle Business Activity Monitoring (BAM), see Integrating with Oracle SOA Suite in Monitoring Business Activity with Oracle BAM and Gaining Business Insights with Oracle Business Activity Monitoring in Understanding Oracle SOA Suite.