11 Monitoring SOA Composite Applications
This chapter includes the following topics:
-
Monitoring SOA Composite Application Performance Summary Metrics
-
Monitoring the Service Components and Binding Components of a SOA Composite Application
For more information, see Introduction to SOA Composite Applications.
Monitoring SOA Composite Application Performance Summary Metrics
You can view a summary of SOA composite application performance metrics on the Performance Summary page.
-
Access this page through one of the following options:
From the SOA Composite Menu... From the SOA Folder in the Navigator... -
Select Monitoring > Performance Summary.
-
Under soa-infra, expand the folder.
-
Select a specific SOA composite application.
-
From the SOA Composite menu, select Monitoring > Performance Summary.
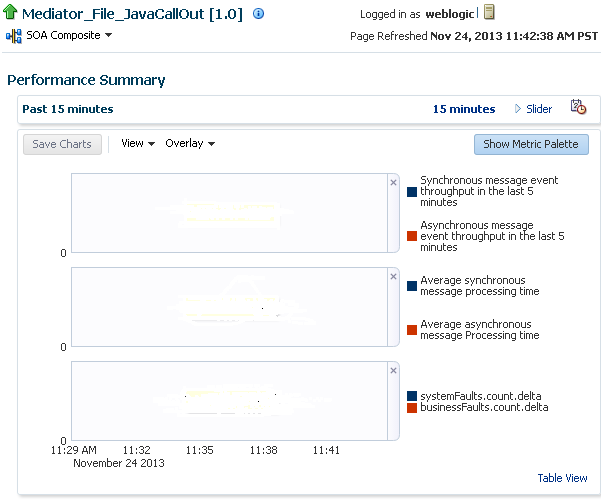
The Performance Summary page provides a graphical representation of the following information by default:
-
Total number of business flow instances since the last server restart.
-
Total number of faults since the last server restart.
-
-
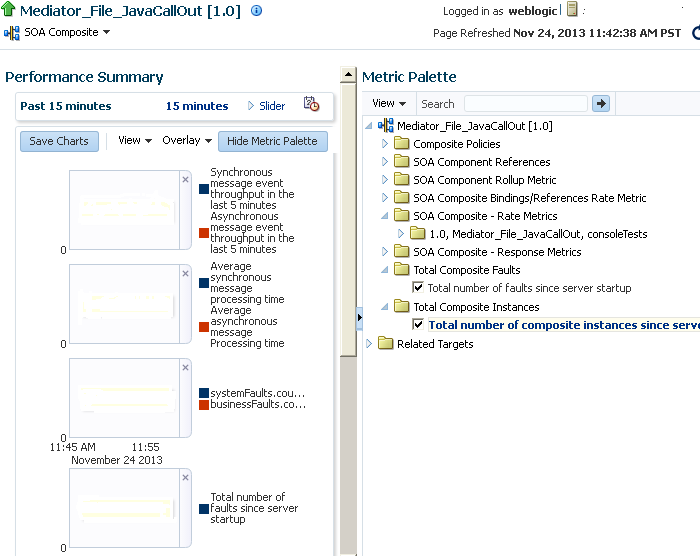
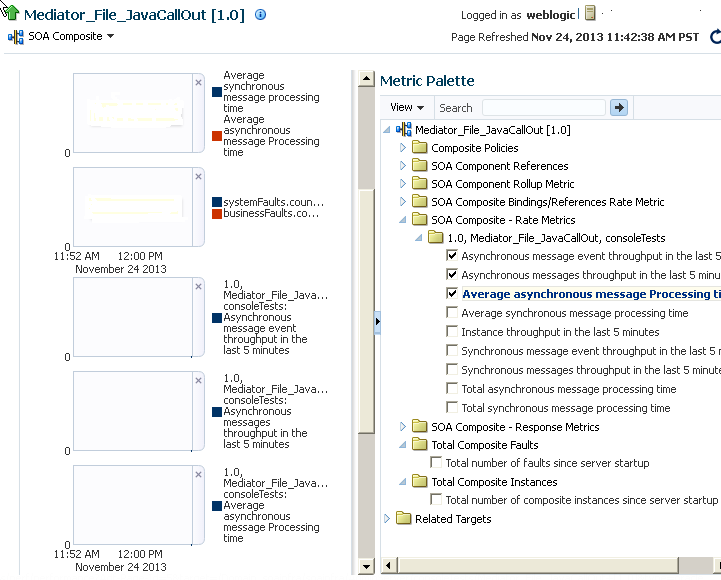
Click Show Metric Palette to display a hierarchical tree of all metrics for the SOA composite application. The tree organizes the metrics into various categories of performance data.
-
Expand a folder and select a metric in the Metric Palette to display a performance chart that shows the changes in the metric value over time. The chart refreshes automatically to show updated data.
-
Click Slider to display a slider tool that lets you specify the time frame shown in the charts.
For more information about the Performance Summary page, see the online Help for the Performance Summary page and Section "Viewing the Performance of Oracle Fusion Middleware" of Administering Oracle Fusion Middleware.
For information about monitoring SOA Infrastructure performance summary metrics, see Monitoring SOA Infrastructure Performance Summary Metrics.
For information about monitoring message delivery processing requests, see Monitoring Message Delivery Processing Requests.
For information about monitoring service engine statistics, see the following:
-
Monitoring BPEL Process Service Engine Request and Thread Performance Statistics.
-
Monitoring Business Rules Service Engine Performance Statistics
-
Monitoring Human Workflow Service Engine Active Requests and Operation Performance Statistics
-
Monitoring BPMN Process Service Engine Performance Statistics
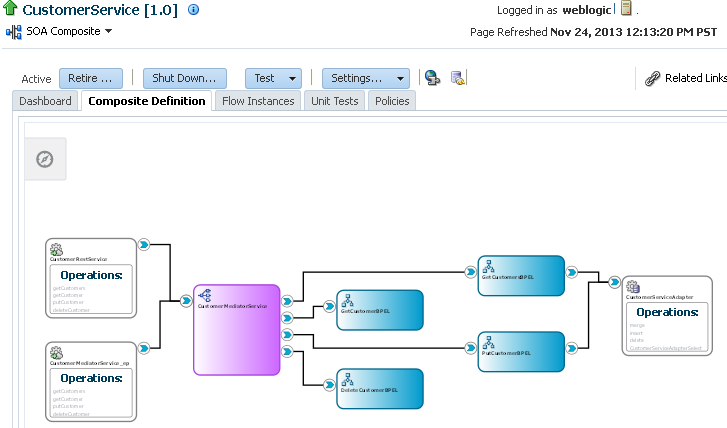
Viewing the SOA Composite Application Diagram
You can view a diagram of the SOA composite application you designed in Oracle JDeveloper in Oracle Enterprise Manager Fusion Middleware Control.
Note:
If the SOA composite application was designed using a Release 11g version of Oracle JDeveloper, the diagram cannot be displayed, and you receive an error message. To resolve this issue, reopen the composite in the Release 12c version of Oracle JDeveloper and redeploy it.
-
Access this page through one of the following options:
From the SOA Infrastructure Menu... From the SOA Infrastructure Home Page... -
Select Home.
-
Select the Deployed Composites tab.
-
In the Composite section, select a specific SOA composite application.
-
Click the SOA Folders tab.
-
Click View Composites for the SOA Folder that contains the composite.
-
Select a specific SOA composite application.
-
-
Click Composite Definition.
The Design view of the SOA composite application is displayed.
-
Above the diagram, click the Show Control Panel icon.
-
Select an option to customize the view of the diagram:
-
zoom to fit
-
zoom in
-
zoom out
-
-
Click the Source tab to display the
composite.xmlsource file of the SOA composite application.
Monitoring the Service Components and Binding Components of a SOA Composite Application
You can monitor the service components and binding components of a SOA composite application and the total number of messages processed and average processing time of the service and reference binding components.
To monitor the service components and binding components of a SOA composite application:
-
Access this page through one of the following options:
From the SOA Infrastructure Menu... From the SOA Folder in the Navigator... -
Select Home.
-
Select the Deployed Composites tab.
-
In the Composite section, select a specific SOA composite application.
-
Under soa-infra, expand the folder.
-
Select a specific SOA composite application.
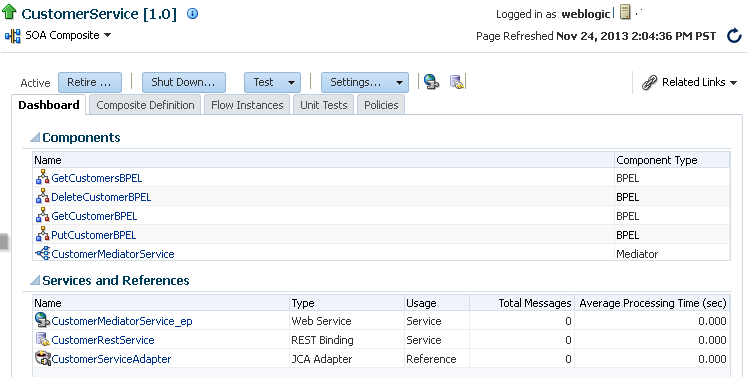
The Dashboard page displays the following details:
-
A summary of composite lifecycle state actions at the top of the Dashboard page (retire, activate, shut down, and start up). For information about these states, see Managing the State of Deployed SOA Composite Applications.
-
The name and type of service components used in this SOA composite application.
-
The name and type of service (inbound) and reference (outbound) binding components used in this SOA composite application.
-
Details about the total number of messages processed and average processing time of the service and reference binding components
-
-
In the Name column of the Components section, click a service component to access its home page.
-
In the Name column of the Services and References section, click a service or reference to access its home page.
For more information, see the following sections:
-
Administering Oracle Fusion Middleware for details about viewing and searching log files
