 Install and Use the Coherence VisualVM Plug-In to Manage and Monitor a Coherence Cluster
 Before You Begin
This 15-minute tutorial shows you how to install the Coherence VisualVM application and use its management utility to manage and monitor a Coherence cluster.
Background
The Coherence VisualVM plug-in aggregates the Coherence MBean data and shows a concise operational view of a single Coherence cluster. The management information presented over time enables real-time analysis and troubleshooting. You can also connect to clusters by using Java Management Extensions (JMX) or through management over REST (available in Coherence versions 12.2.1.4 and above).
The plug-in is an ideal tool for monitoring and managing Coherence clusters during the development and testing lifecycle. This tutorial uses the power of the Coherence JMX support along with the ease of use of the VisualVM plug-in application to monitor a Coherence cluster.
What Do You Need?
- Java SE version 11.0.6 or later. You can download the JDK from the Java SE Downloads page.
- A standalone installation of Oracle Coherence 14.1.1.0 software. You can obtain the software distribution from the Oracle Coherence Software Downloads page. For instructions to install, see Installing Oracle Coherence.
- VisualVM release 2.0.6 or later which is available from https://visualvm.github.io/ (select Download Standalone).
- A basic working knowledge of Linux commands and command line syntax, including the Bourne Again Shell (
/bin/bash).
Note: This tutorial uses Oracle Coherence 14.1.1.0. However, the VisualVM plug-in also supports older versions of Coherence. See Supported Coherence Versions.
 Install the Plug-in From Coherence VisualVM
The Coherence VisualVM Plug-in is available from the list of plug-ins in VisualVM versions 2.0.6 and above.
- Launch VisualVM from the
bindirectory under the VisualVM install directory by using the following commands:cd install_directory/bin./visualvm - From the VisualVM main menu, select Tools and click Plugins.
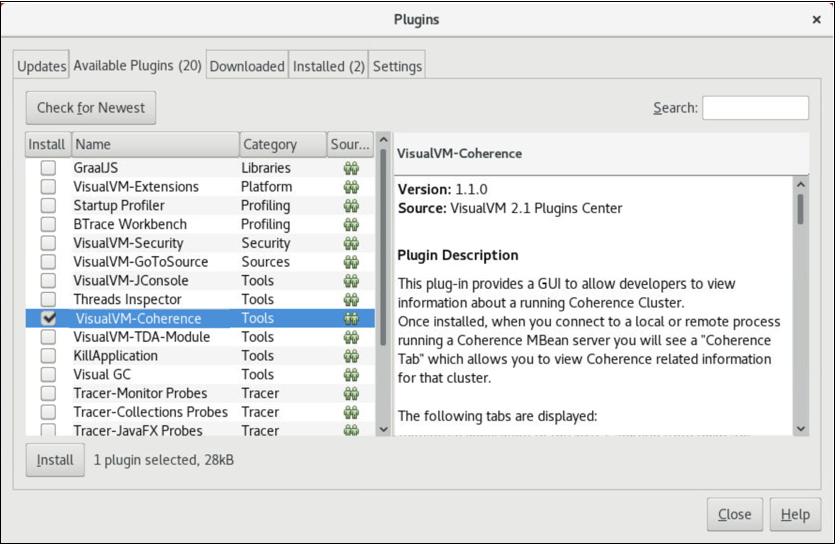
- If the VisualVM-Coherence plug-in is not displayed in the Available Plugins tab, click Check for Newest.
- Select the Install checkbox for the VisualVM-Coherence plug-in. The details of the plug-in are displayed in the right pane.
- Click Install.
- On the Plugin Installer Welcome screen, click Next.
- In the Plugin Installer License Agreement screen, check I accept and click Install.
- The plug-in begins to install. When the installation completes, click Finish.
 Start and Monitor a Coherence Cluster Using the Coherence VisualVM Plug-in
- Go to the Coherence installation directory and run the
cache-server.shscript:cd INSTALL_DIR/coherence/bin./cache-server.shThe
cache-serverscript starts a cache server using the default configuration. - From the VisualVM Applications tree, expand Local and double-click the Coherence cluster member process ‘Coherence DefaultCacheServer’. The right pane of the VisualVM window now includes a tab for the newly selected process.
- From the Coherence DefaultCacheServer tab, click Oracle Coherence to monitor the Coherence cluster using the Coherence-VisualVM plug-in.
The Oracle Coherence pane, displays several tabs. The following tabs appear for all Coherence clusters.
- Cluster Overview - View the summary graphs to understand the total cluster memory available and used, packet publisher and receiver success rates, and load averages for machines running Coherence. Use this information to understand the cluster’s operations and identify potential performance and high availability issues.
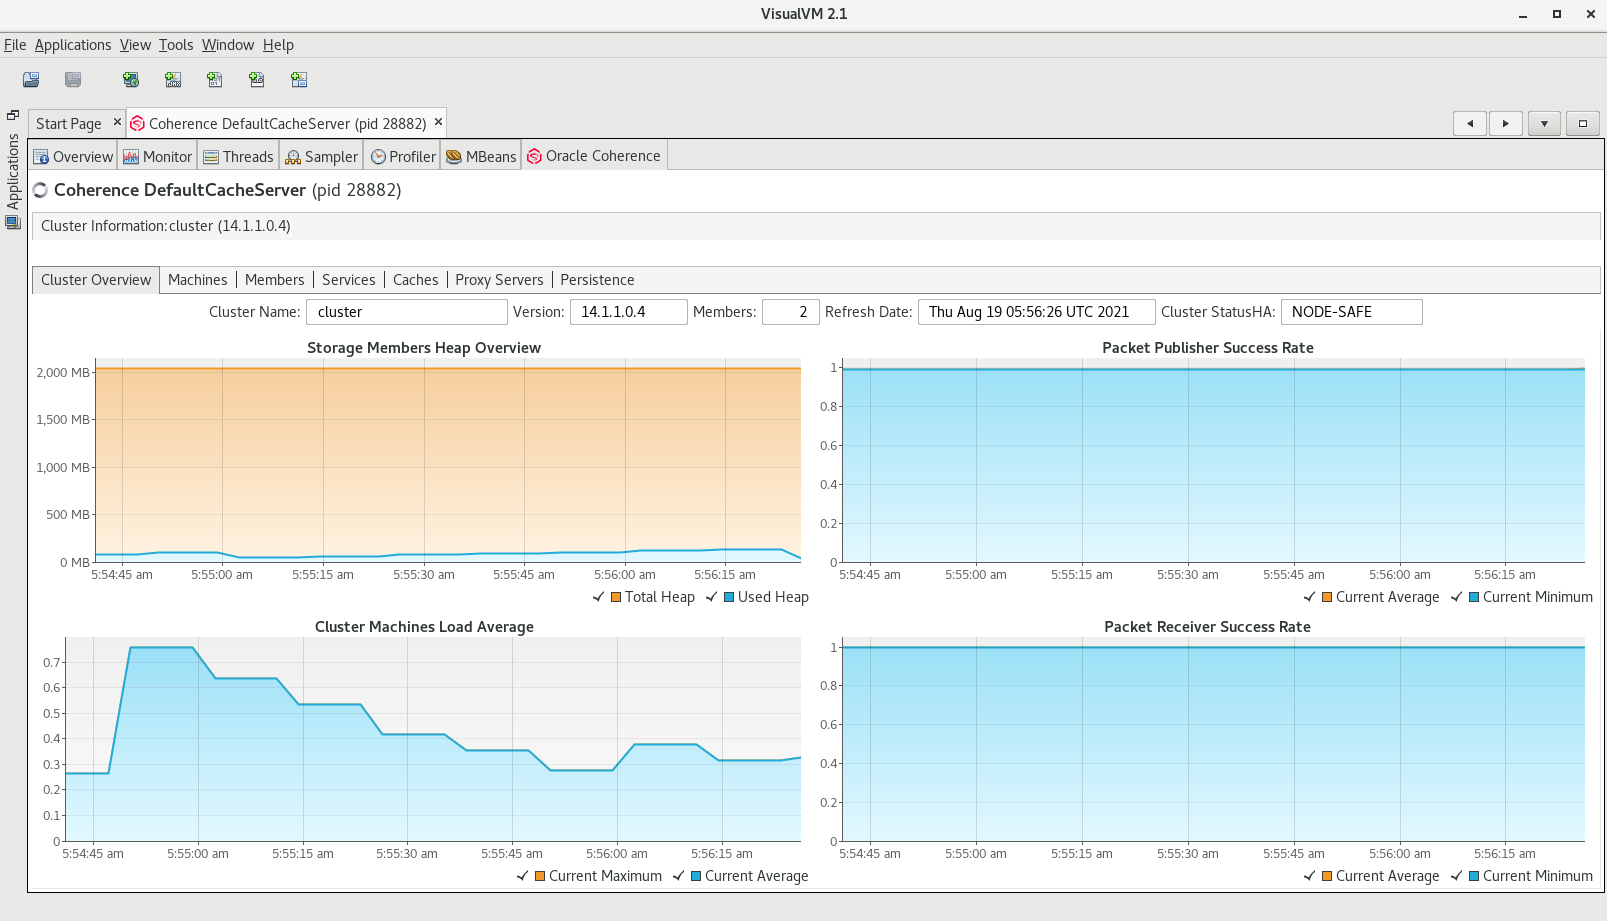
Description of the screen [cluster_overview.png] - Machines - View the list of the physical machines that make up the Coherence cluster. Use this information to monitor the load on each server and to identify any servers that are in danger of using all of their available memory.
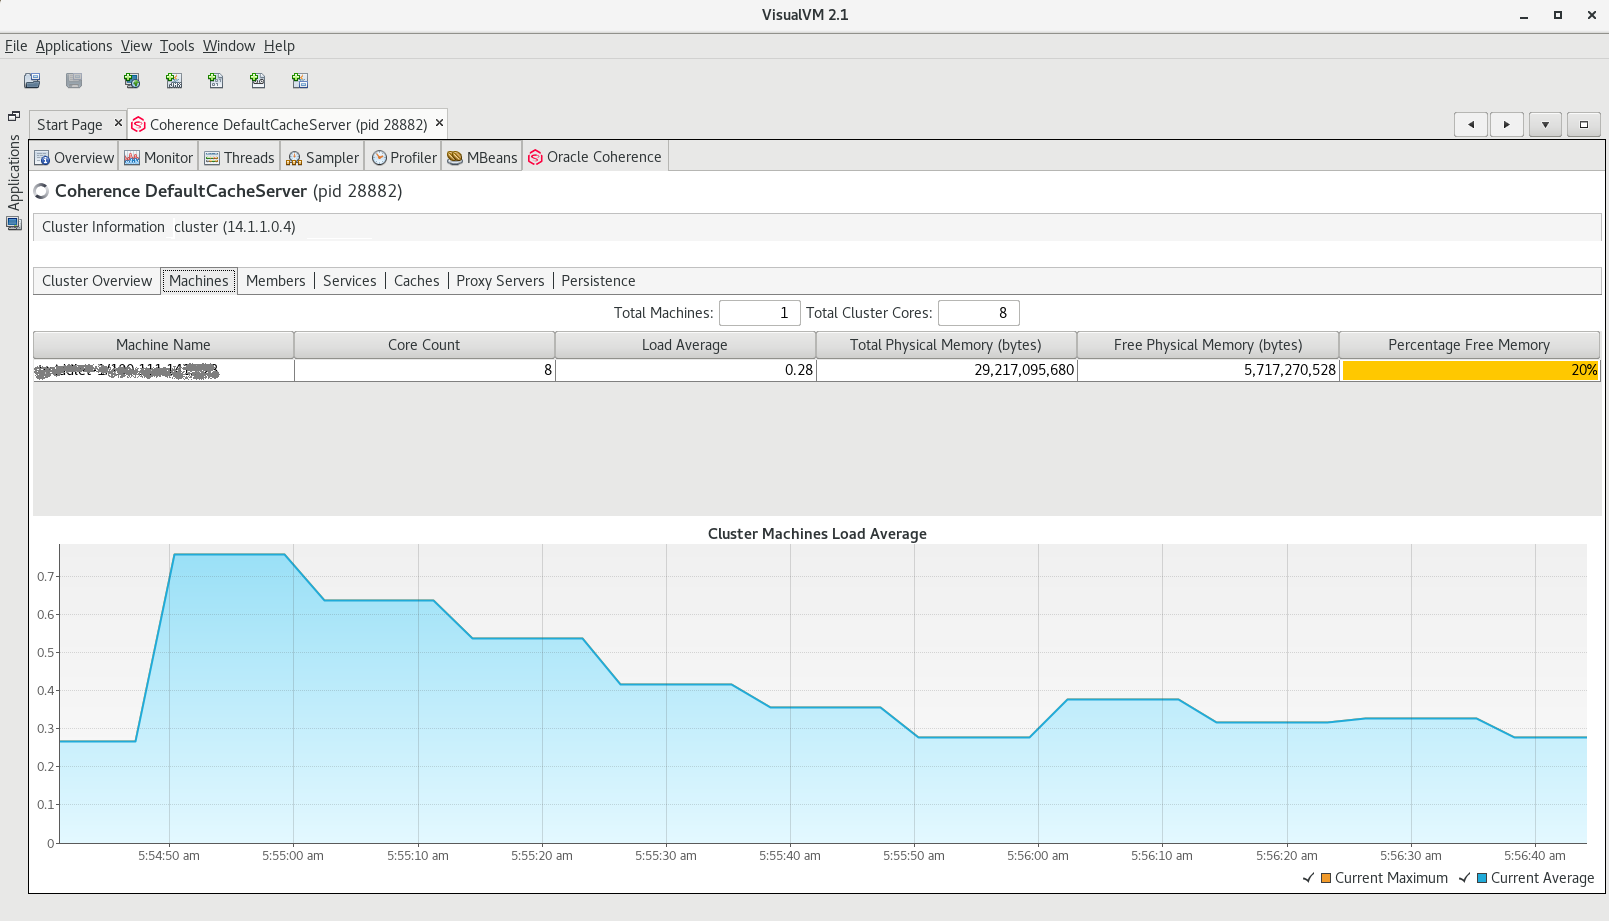
Description of the screen [machines.png] - Members - View the full list of Coherence members/nodes, including individual publisher/receiver success rates, memory, and send queue sizes. Use this information to monitor the cluster and to identify and diagnose potential memory issues for a member as well as the cluster as a whole.
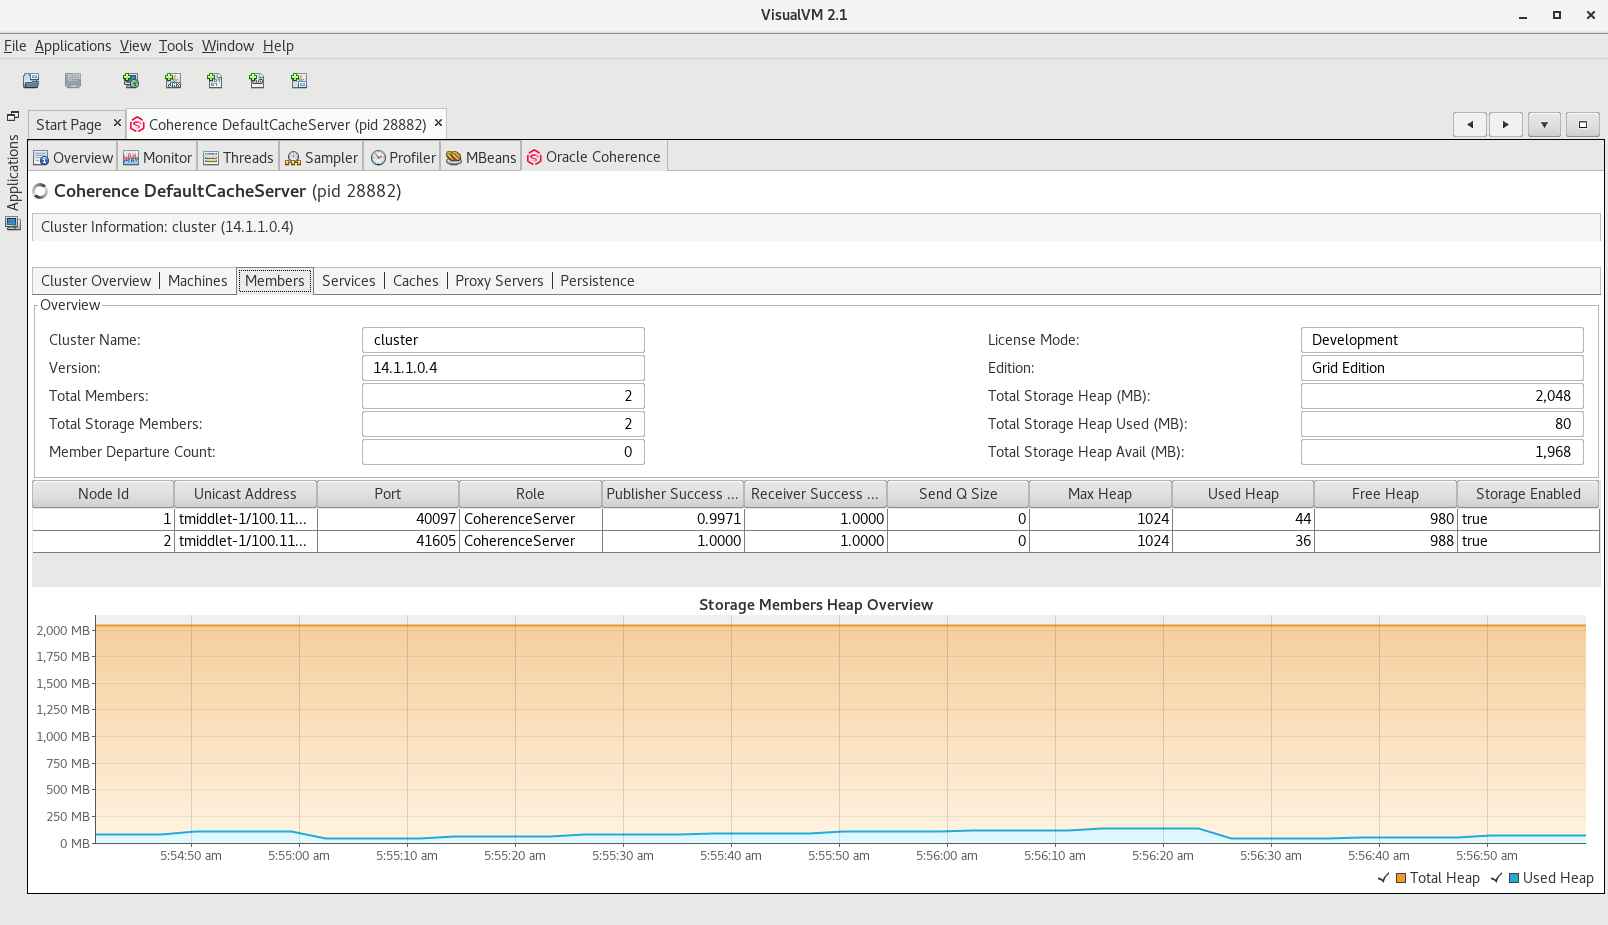
Description of the screen [members.png] - Services - View information about cluster services including service partition counts and statusHA values. Use this information to monitor services in the cluster and to identify potential performance issues with service threads.
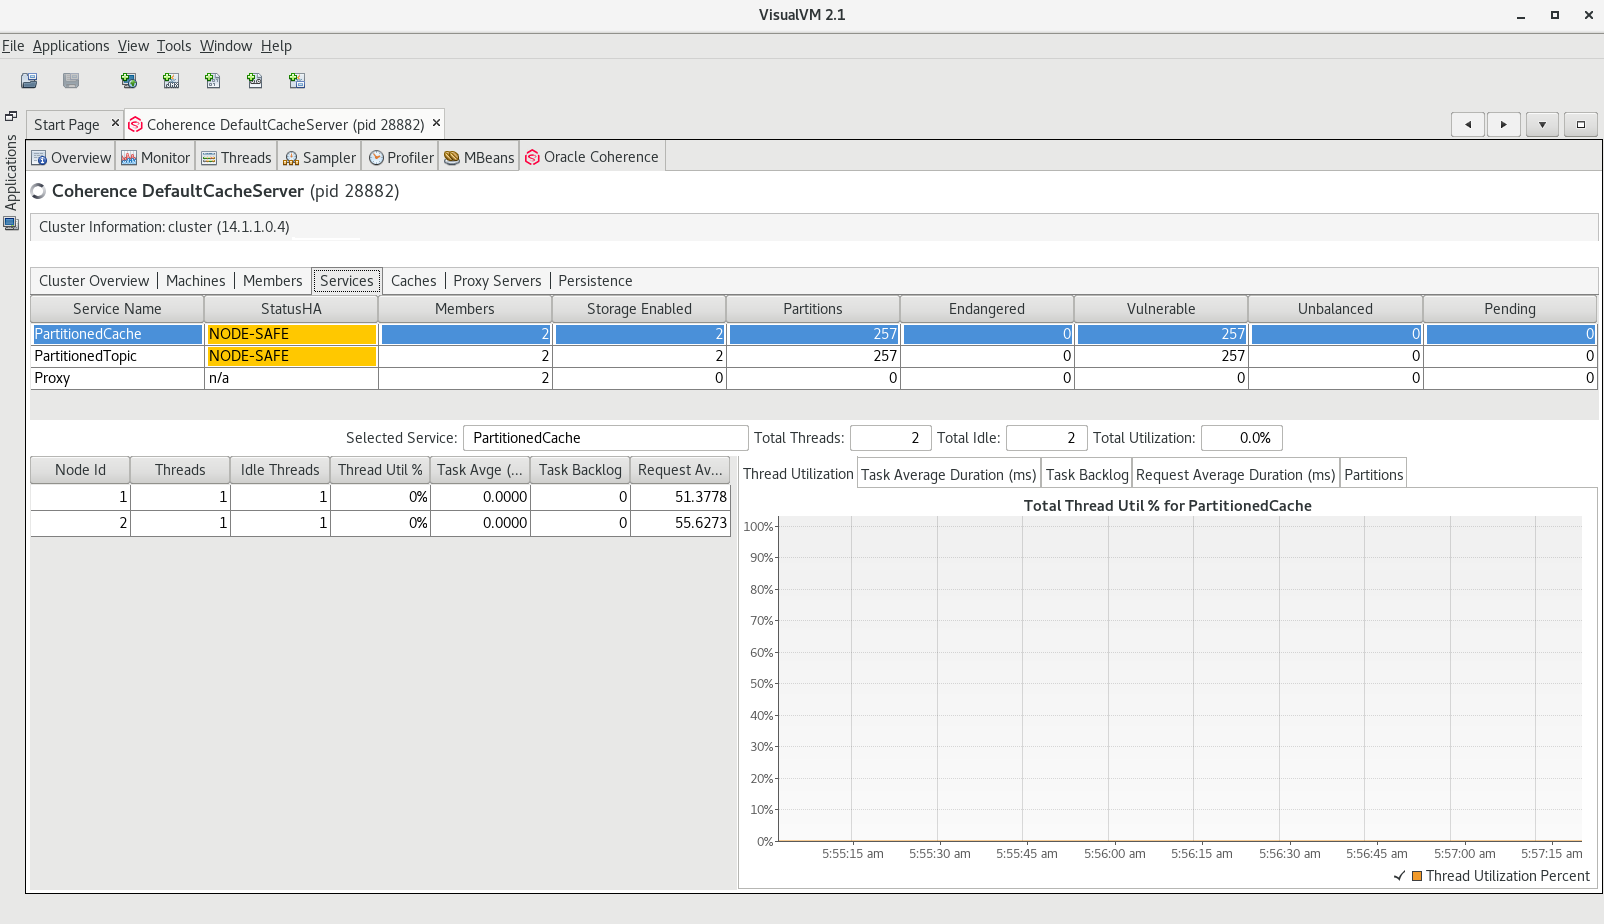
Description of the screen [services.png] - Caches - View information about caches, including their size and memory usage information. Use this information to get a detailed view of cache statistics and to identify potential performance issues with cache queries.
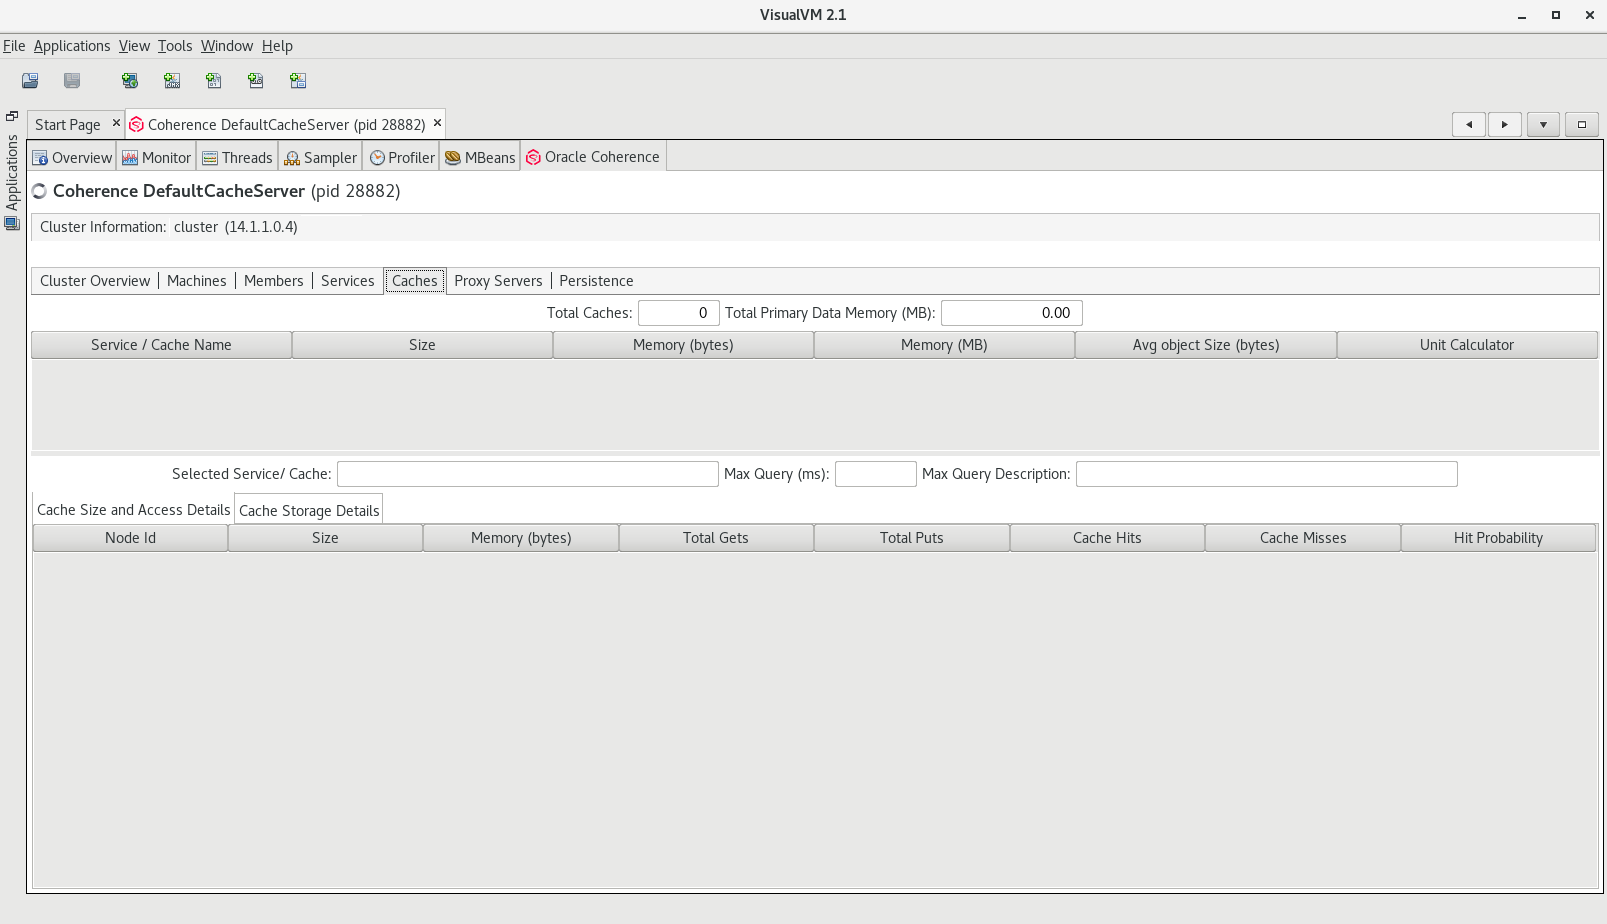
Description of the screen [caches.png] - Proxy Servers - View information about proxy servers in the cluster, the number of connections across each proxy server, and total connections. Use this information to monitor Coherence*Extend clients that are connecting to a proxy and to identify potential performance issues on the proxy.
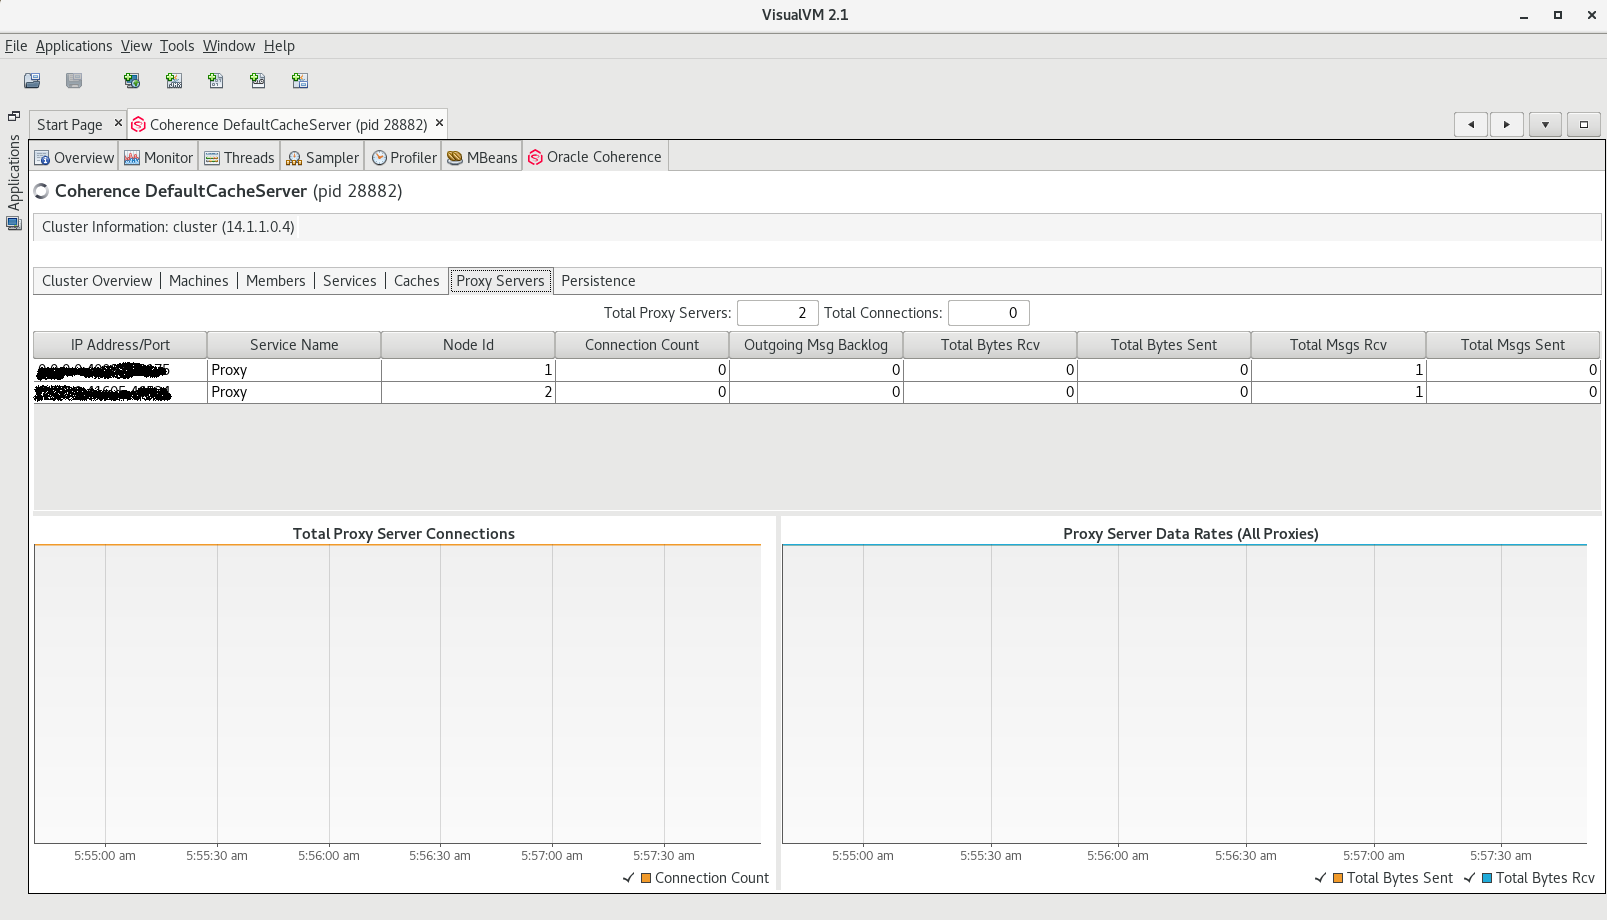
Description of the screen [proxy_servers.png] - Persistence - View information about each service configured with persistence. Use this information to understand about the active space used and any additional latencies.
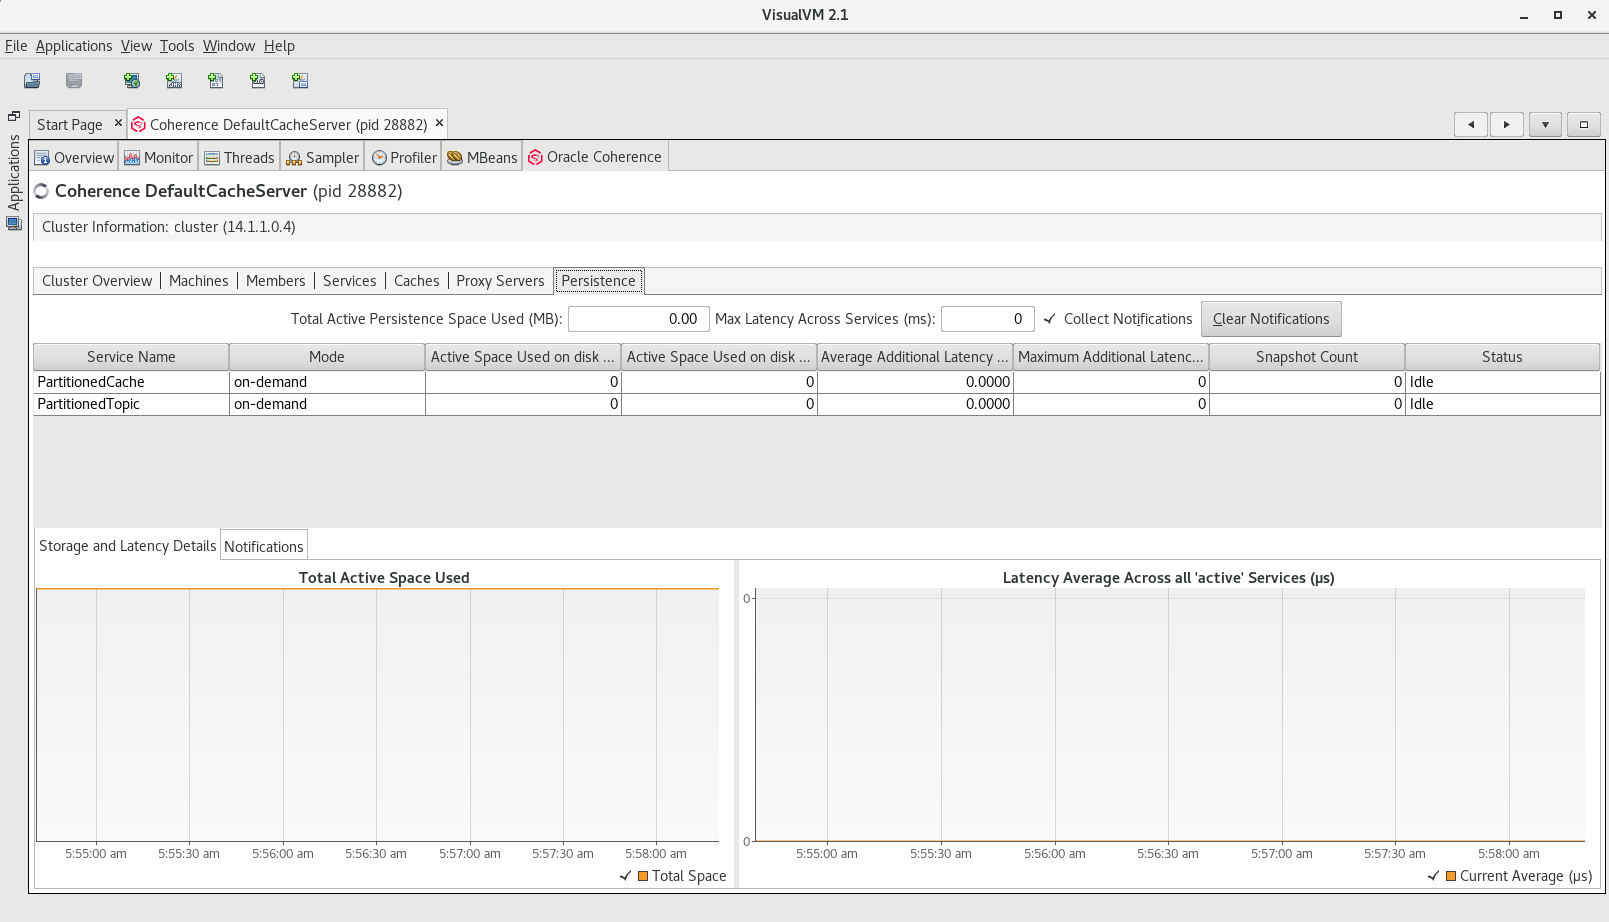
Description of the screen [persistence.png] Depending upon the edition and functionality of Coherence you are using, the following optional tabs are displayed:
- HTTP Servers
- Coherence*Web
- Federation
- Elastic Data
- JCache
- HotCache
For details on these tabs, see Monitoring Capabilities.
4. Exit VisualVM.