2 Working with Events
This section discusses how to use the event listing as a starting point for performance analysis. It describes how to drill down into specific requests and diagnose potential bottlenecks and problem areas using instrumentation and sampling tree as well as analyzing method statistics.
What can I do with the Events List?
The Events List is the starting point for performance analysis. It provides you with a list of events the server has processed during a specified date and time range. Duration of time taken to process each event can help you determine what events require further analysis.
The Events List is the default page that you see when you sign in, as shown.

Description of the illustration events-list.png
When you first access this page, the date and time range is set from the present to 1 hour back, and the list of events during that time are displayed by default. You can scope a different set of events by changing one or both date/time selections. Click Apply to refresh the view. Click Get Recent Data to get the set of events up to the last hour.
The following information is provided for each event shown. You can sort events by Timestamp, Type, or Duration.
| Event | Description |
|---|---|
| Timestamp | Displays the date and time the event was processed. By default, the events are sorted to display the latest event first. |
| Type | Displays the HTTP method for this request (GET/POST) |
| Event | Displays the event name as (.....path/resource); the host name and port part of the event may be truncated to only show the beginning of the path.
You can hover over the name to display the full URL as well as any query strings. Click the name to view the details for this event. For more information about event details, see How do I locate hot paths in my code?. |
| Duration (ms) | Displays the time (in milliseconds) taken to process this event. |
How do I locate hot paths in my code?
Use the Event Details page to drill down to a specific request’s profile information and identify hot paths and methods using the instrumented method tree, sampling method tree, as well as SQL and method statistics.
WebCenter Portal Performance Pack is automatically configured to ignore non-essential information and track only key methods; therefore, when you drill down on a specific request you’re not overwhelmed with a massive amount of data to search through. The Event Details page contains the following sections to help you pinpoint possible problem areas:
-
Event Details — Shows top-level information about the event
-
Instrumented Method Tree — Shows how much time is being spent on individual key methods
-
Sampling Method Tree — Compliments the instrumented method tree by identifying cases where the configured methods may have missed other key methods
-
SQL — Shows how much time was spent making calls to the database
-
Method Statistics — Shows method timings associated with this method within the scope of this particular event (request)
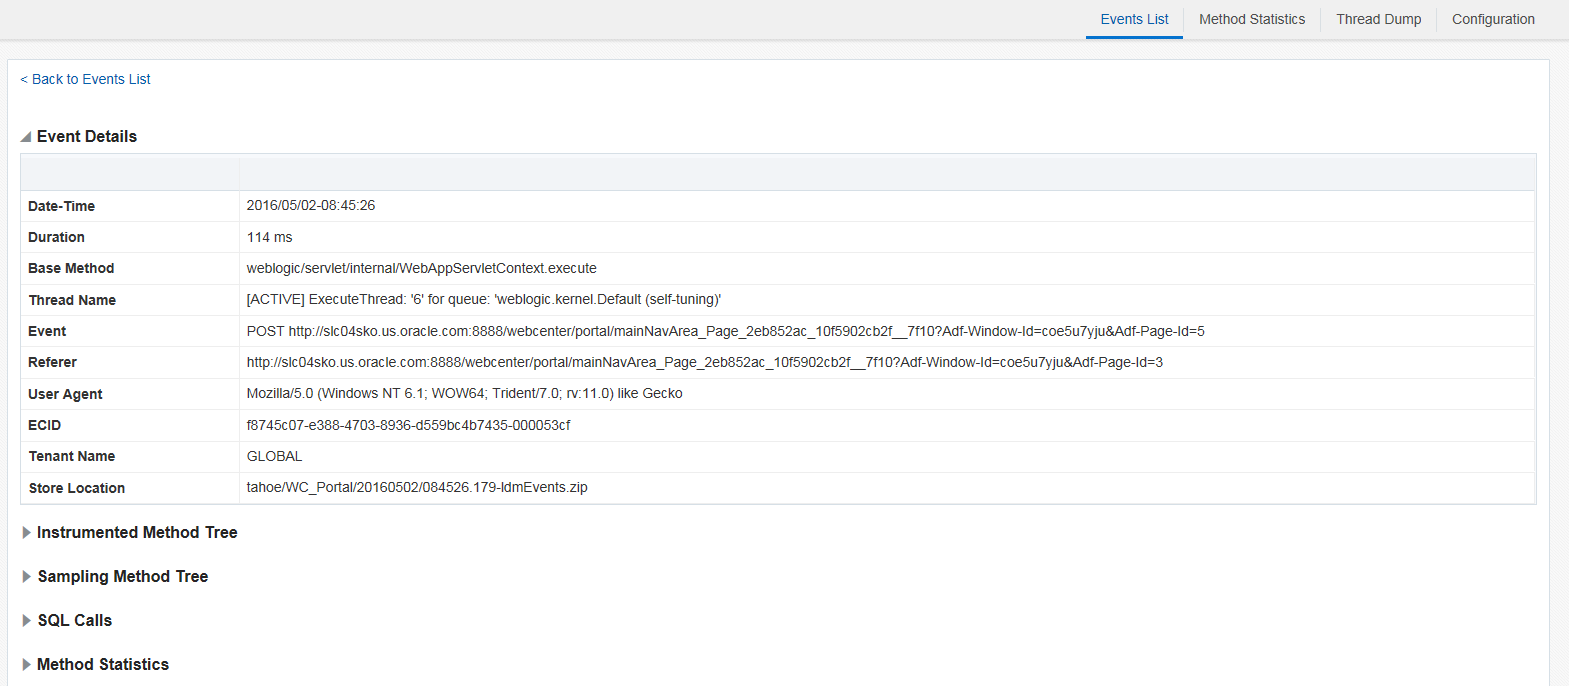
Description of the illustration event-details.png
You can collapse and expand each section so that you can zero in on the most critical information needed.
About Event Details
The event details provides information about the selected event, including but not limited to:
-
Timestamp — Date and time the event was processed by the server
-
Duration — Displays the total time taken to process the event.
-
Base Method — Displays the root method as
package/class.method -
Event — Displays the HTTP method (GET/POST) followed by a separator and the full URL, and any parameters
-
User Agent — Displays the account that the customer used for authentication on the application (the target application being monitored)
About the Instrumented Method Tree
Because of the complexity of our code, a single request may contain a significant number of methods. With that in mind, we use a configuration algorithm to only include key methods in the instrumented method tree so that you can immediately focus on what is important for performance analysis. The instrumented tree is represented as a hierarchical table of data. Using this hierarchical tree format, you can easily determine the most expensive methods because those methods have a pink background and their statistics are highlighted in red. It’s OK to ignore the high-level methods, which by nature are slower as they contain other methods. For example, the base method weblogic/servlet/internal/WebAppServletContext.execute appears slow because the time reflects the total timing for the whole request.
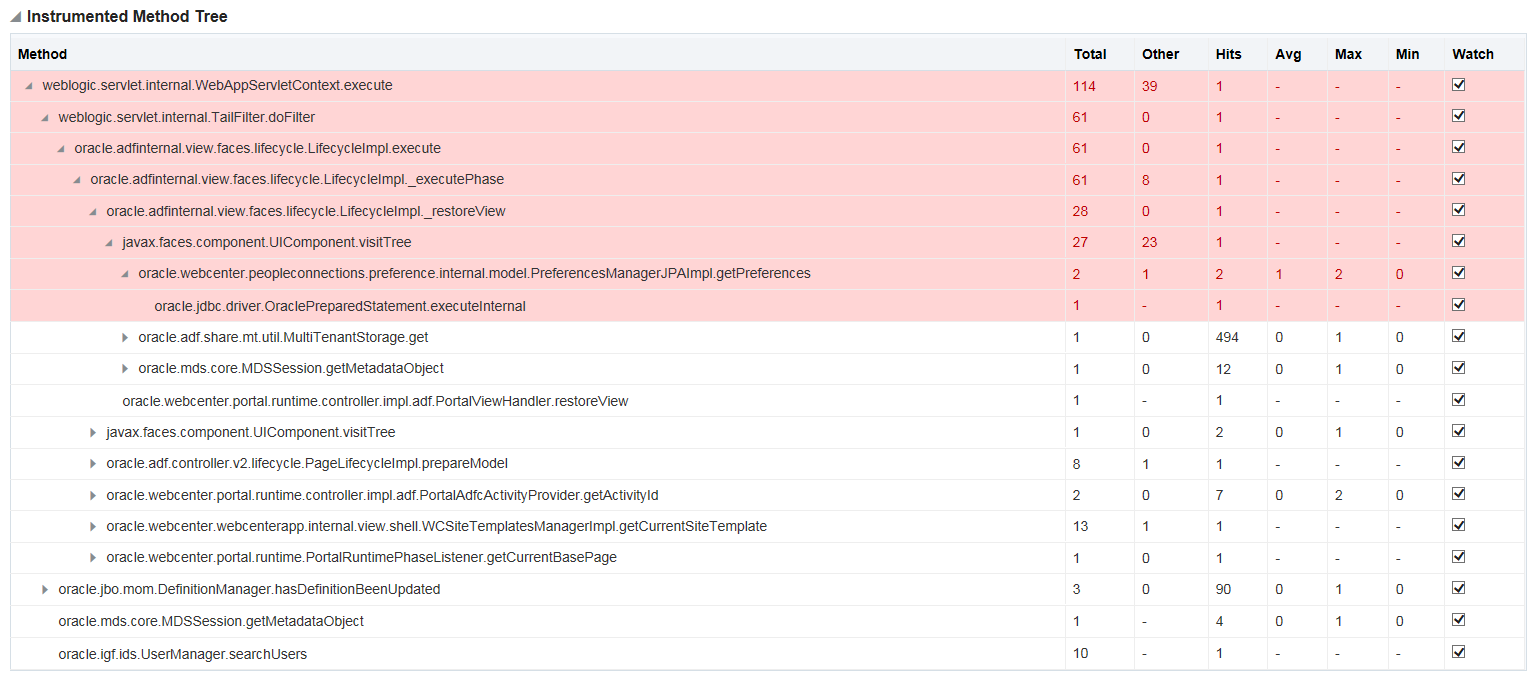
Description of the illustration event-details-instrument.png
Although you want to ignore the actual high-level method, you should drill down further into this method by expanding the node and seeing if in fact it’s a hot path with low-level methods eating up the time. The following information can help you determine areas that need further investigation.
| Instrumented Tree Item | Description |
|---|---|
| Method | Displays as package/class.method. The full method is shown in a tooltip on hover.
|
| Total Time | Displays the total time spent on this method. |
| Other Time | Indicates the time taken by methods that are not included in instrumentation. |
| Hits | Number of times this method is called during execution of the request |
| Min/Max/Avg | If the number of hits is greater than 1 for this method, the minimum, maximum, and average times are calculated. |
| Watch | By default, all methods in the tree are watched. Click here to remove the method from the instrumentation. |
The sampling method tree works alongside the instrumented method tree because it can catch expensive methods that are not yet instrumented. Therefore, if you see a large Other Time statistic calculated, you should examine the methods included in the sampling.
Note:
When you remove a method from instrumentation only that method is removed. Lower-level methods remain in the tree as they are selected based on the algorithm not because they are children of an instrumented method.About the Sampling Method Tree
The sampling method tree operates in concert with the instrumented method tree. The stack traces are sampled periodically and this tree displays the methods that are slower than the sampling rate. For example, if a request takes 1 second to execute and the sampling rate is 50 milliseconds, sampling is done 20 times. The sampling method tree shows you the frequency (weight) a method was tracked during the lifecycle of the request and if it’s taking too long to process. By default, the Sampling rate is set to 50 milliseconds, but you can change the rate based on your requirements.
For more information about changing the default rate and other pertinent configuration settings, see How do I change configuration settings to suit my system needs?.
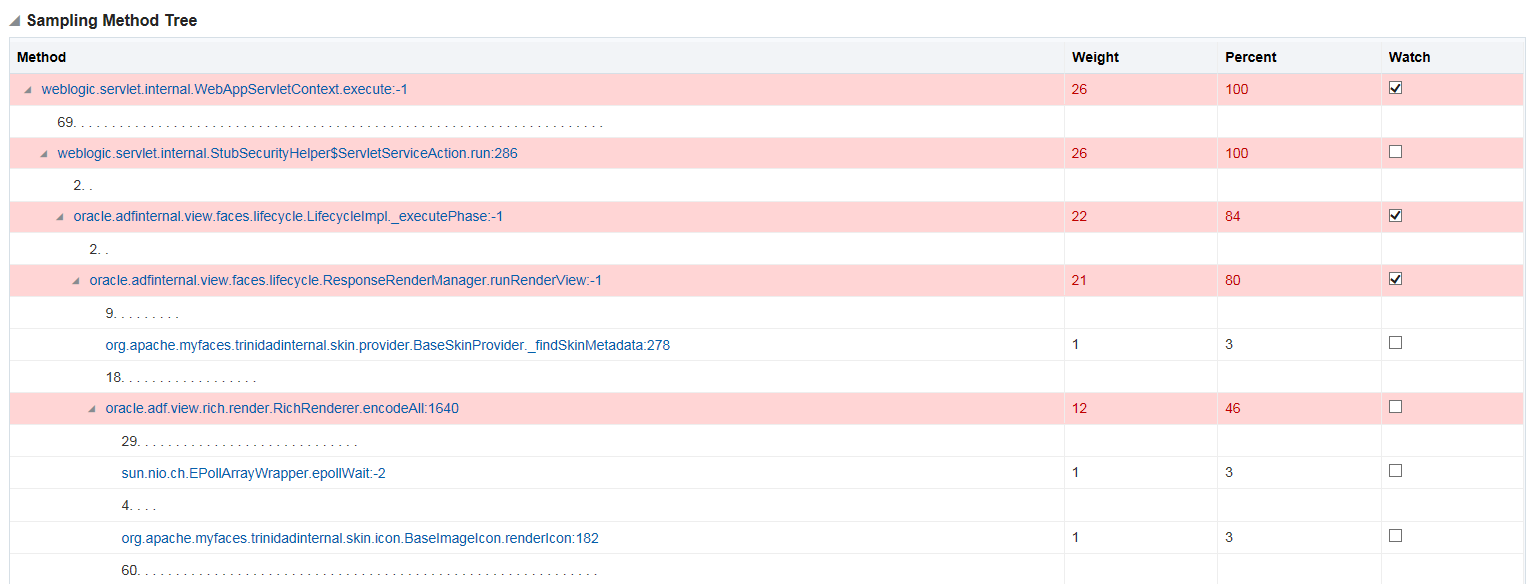
Description of the illustration event-details-sampling.png
The tree is represented as a hierarchical table of data. Just like the instrumented tree, you can expand or collapse the methods inside the tree. Instead the table indicates the number of child processes. To see these methods, just click on the method. This opens the Method Calls Details dialog, which displays the complete call stack for this method. From this dialog you can select to watch any methods in the calling stack.
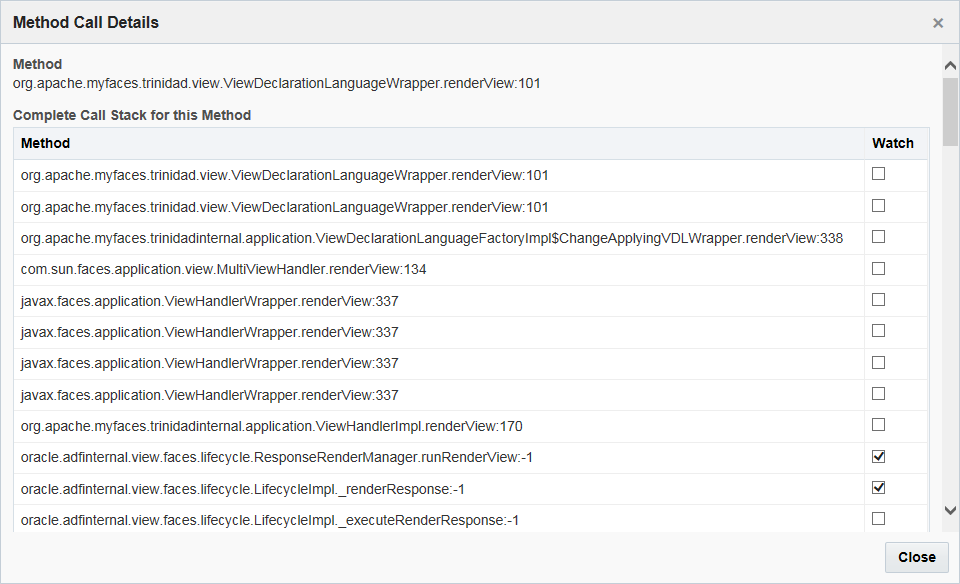
Description of the illustration method-call-details.png
If you find any methods in the sampling tree that you think should be instrumented for further analysis you can select to watch them. You don’t have to stop and restart the tool to add a method to the configuration for instrumentation.
-
Select the Watch option.
-
Go to WebCenter Portal and execute the request.
-
Go to the Event List and drill down on the new request.
You can see the method that you chose to watch is now included in the instrumented method tree. You don’t have to stop and restart the target portal server.
Note:
The sampling tree also displays any methods in your custom code that is slowing down the system performance. You can choose to instrument these slow class.methods by simply selecting to Watch them.About SQL
When processing requests, Oracle products, including WebCenter Portal, could make some calls to the database. The SQL section contains a listing of all these calls during the processing of this request. It shows how many times each call was made as well as the average time it takes to process. Hover over the SQL name to view the full SQL. You can copy the full SQL to the clipboard.
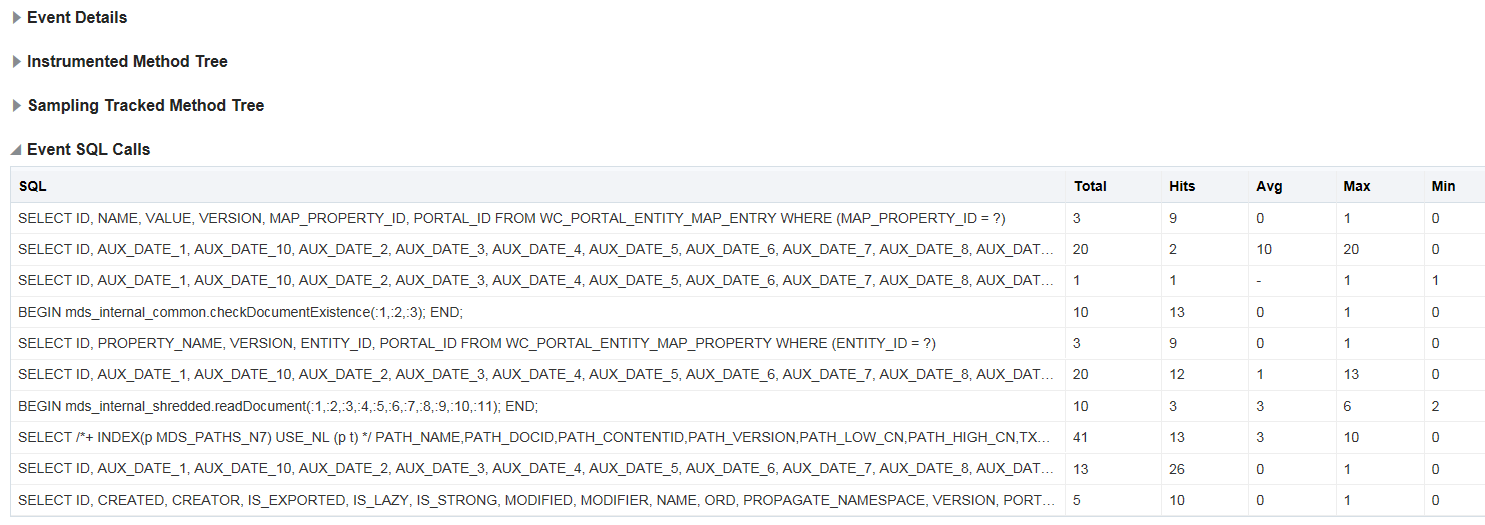
Description of the illustration event-details-sql.png
This information, along with the information gleaned from the instrumentation method tree and sampling method tree can be very useful in narrowing your performance issue.
About Method Statistics
The Method Statistics section provides aggregated statistics for all the methods executed for this request in a list. Instead of expanding and collapsing nodes to find specific methods, you can locate them more easily here. You can then see from the aggregated statistics if they are expensive and need to be optimized.
For more information about method statistics, see How do I find methods for optimization?.