45 Analyzing Portal Usage
Use the Analytics service to monitor real-time usage and activity reporting for your portal.
Note: Oracle WebCenter Portal has deprecated the support for Jive features (announcements and discussions). If you have upgraded from a prior release to Release 12c (12.2.1.4.0), Jive features remain available in your upgraded instance but Oracle support is not provided for these features. In the next release, Jive features will not be available even in the upgraded instances
For Analytics task flows to work, the Analytics schema (ACTIVITIES) must be installed and configured, and a connection set up between WebCenter Portal and the Analytics Collector. For more information about the Analytics schema and how to manage the Analytics service backend, see Managing Analytics.
This chapter describes how to add Analytics task flows to portal pages at runtime. To learn how to add Analytics task flows at design time using Oracle JDeveloper, see Developing for Oracle WebCenter Portal.
Permissions:
To perform the tasks in this chapter, you must have the WebCenter Portal Administrator role or a custom role that grants at least the following permission:
Portal Server: Manage Configuration
For more information about permissions, see About Application Roles and Permissions.
Topics:
Parent topic:Administering Portals in WebCenter Portal
About the Analytics Task Flows and Service
The Analytics service allows WebCenter Portal administrators and portal managers to track and analyze WebCenter Portal traffic and usage. The Analytics service provides the following basic functionality:
-
Usage Tracking Metrics: The Analytics service collects and reports metrics of common WebCenter Portal functions, including community and portlet traffic.
-
Behavior Tracking: The Analytics service can be used to analyze WebCenter Portal metrics to determine usage patterns, such as page visit duration and usage over time.
-
User Profile Correlation: The Analytics service can be used to correlate metric information with user profile information. Usage tracking reports can be viewed and filtered by user profile data such as country, company or title.
Note: Profile information is cached meaning that changes to a user profile are not visible in reports until the cache is updated. The default cache time is 60 minutes, but this value can be changed by your administrator.
About the Analytics Administration Page
An analytics console that displays metrics for the entire Oracle WebCenter Portal is available to WebCenter Portal administrators with the Manage Configuration permission. The console consists of four pages, grouping several different reports:
-
Summary Metrics – portal traffic, page views, and login metrics
-
Portal Metrics – Portal usage and response times
-
Portlet Metrics – Portlet views and response times
-
Service Metrics – Usage of searches, documents, wikis, blogs and discussions
Out-of-the-box, this console is only available through a business role page named Analytics. It is the WebCenter Portal administrator’s responsibility to grant people permissions to see the Analytics page. This page is intended for anyone who needs to analyze access and usage statistics; this could include administrators, sales or marketing managers or directors, business analysts, and so on.
Just like other business role pages, the Analytics page is pushed to all the users to whom it is assigned, appearing in the Home portal. Once the Analytics page is available in the Home portal, users can show and hide the page through the Manage Page dialog.
Working with Analytics Task Flows
This section describes the Analytics task flows, including how to add them to a portal page, how to customize them, how to change their properties, and how to personalize report views.
This section contains the following topics:
Understanding Analytics Task Flows
This section lists and describes all the Analytics task flows that are provided with WebCenter Portal. Note that those marked with “Administrator” are only available to users with an Administrator account, and those marked with “System Administrator” are only available to system administrators.
The following task flows are available out-of-the-box:
Application Analytics:
Portal Analytics:
Portlet Analytics:
Service Analytics:
Note: The images shown in the following sections represent one view of each report. However each report can be customized to display the data in different ways (for example, a bar chart, a pie chart, a line chart, or a table). For information on customizing reports, see Customizing Analytics Reports and Personalizing Your Analytics Report.
WebCenter Traffic
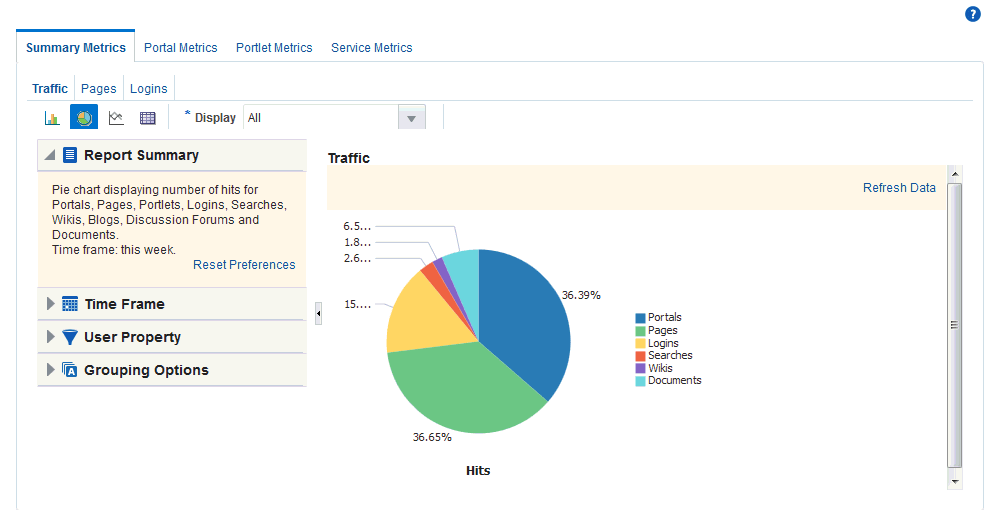
The WebCenter Traffic task flow displays a summarized view for common events within the portal. Use this task flow to track application-wide events—portal views, page views, portlet views, logins, number of searches, wiki views, blog views, discussion forum views, and document views. For more information, see WebCenter Traffic in Building Portals with Oracle WebCenter Portal.
Page Traffic (Administrator)
The Page Traffic task flow displays the number of page hits and the number of unique users that have visited any portal page. Use this task flow to quickly see the most visited pages (top pages) and/or the least visited pages (bottom pages). For more information, see Page Traffic (Administrator) in Building Portals with Oracle WebCenter Portal.
Login Metrics (System Administrator)
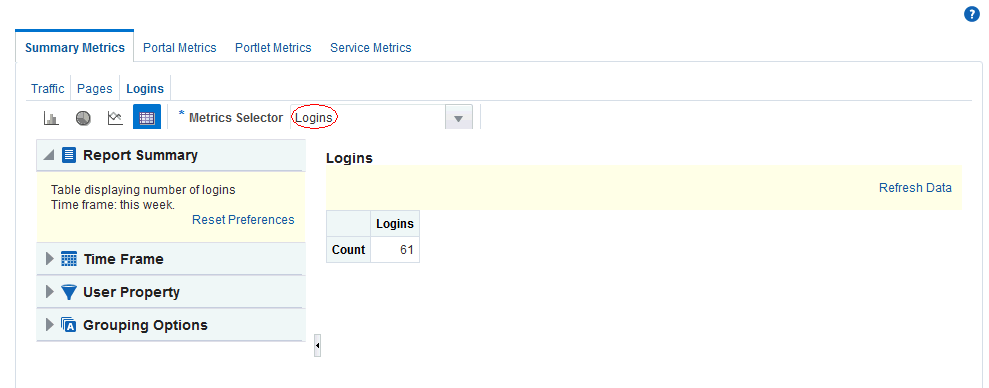
The Login task flow (Figure 2) reports the number of times users log in to WebCenter Portal.
Use this task flow to see the total number of portal logins and/or the number of times unique users logged into WebCenter Portal.
Portal Traffic (System Administrator)
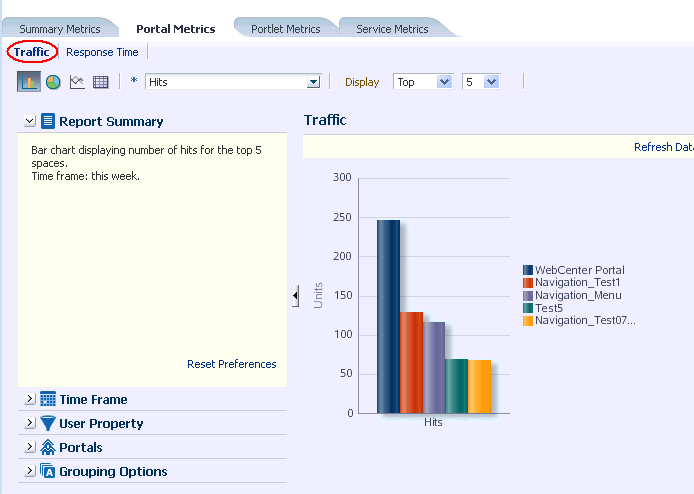
The Portal Traffic task flow (Figure 3) displays usage information—the number of page hits, number of unique users, and the number of unique visits (multiple consecutive page views within the same portal during the same WebCenter Portal session is treated as one visit)—for individual portals.
Use this task flow to quickly see the most popular portals (top), and the least popular portals (bottom). You can filter the data to only show specific portals or show all portals.
Note: The Home portal is not included in the data.
Portal Response Time (System Administrator)
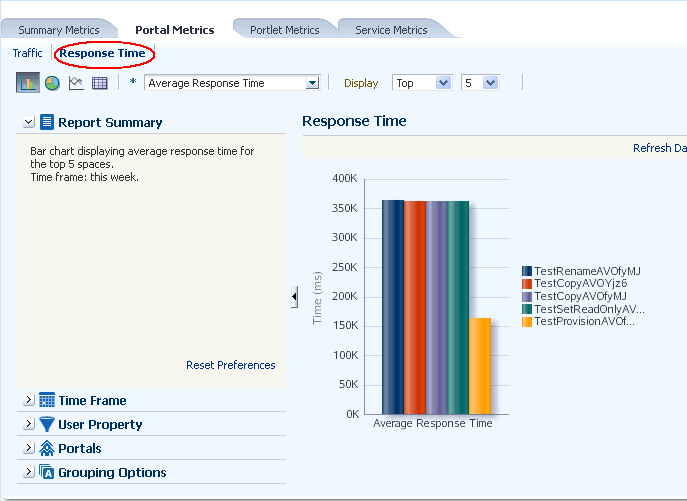
The Portal Response Time task flow (Figure 4) displays page performance information—average, minimum, or maximum response time—for individual portals over any time period you specify. Use this task flow to quickly see the slowest portals (bottom), and the fastest portals (top). You can filter the data to only show specific portals or show all portals.
Note: The Home Portal is not included in the data.
Portlet Traffic (Administrator)
The Portlet Traffic task flow displays portlet usage information—the number of portlet hits (the number of times a portlet is displayed) and number of unique users that access a portlet.
Use this task flow to quickly see the most popular portlets (top), and the least popular portlets (bottom). You can filter the data to only show specific portlets or show all portlets. Similarly, you can filter the portlet data by portal. For more information, see Portlet Traffic (Administrator) in Building Portals with Oracle WebCenter Portal.
Portlet Instance Traffic (Administrator)
The Portlet Instance Traffic task flow displays usage information—the number of portlet hits (the number of times a portlet is displayed) and number of unique users that access a portlet—for individual portlet instances. If the same portlet displays on several different pages, each placement is considered as a portlet instance.
Use this task flow to quickly see the most popular portlet instances (top), and the least popular portlet instances (bottom). You can filter the data to only show specific portlet instances or show all portlet instances. Similarly, you can filter the portlet data by portal. For more information, see Portlet Instance Traffic (Administrator)in Building Portals with Oracle WebCenter Portal.
Portlet Response Time (Administrator)
The Portlet Response Time task flow displays performance information—average, minimum, and maximum response time—for individual portlets. Use this task flow to quickly see the slowest portlets (bottom), the fastest portlets (top), and compare performance data. Portlet response times are important because there is often a direct link between page performance and the slowest portlets. When troubleshooting poor performance within a portal, it is important to identify the worst performing portlets. You can filter the data to only show specific portlets or show all portlets. Similarly, you can filter the portlet data by portal. For more information, see Portlet Response Time (Administrator)in Building Portals with Oracle WebCenter Portal.
Portlet Instances Response Time (Administrator)
The Portlet Instances Response Time task flow displays performance information—average, minimum, and maximum response time—for individual portlet instances. If the same portlet displays on several different pages, each placement is considered as a portlet instance.
Use this task flow to quickly see the slowest portlet instances (bottom), the fastest portlet instances (top), and compare performance data. You can filter the data to only show specific portlet instances or show all portlet instances. Similarly, you can filter the portlet data by portal. For more information, see Portlet Instances Response Time (Administrator) in Building Portals with Oracle WebCenter Portal.
Search Metrics
The Search Metrics task flow tracks searches performed within the portal. Use this task flow to quickly see the most popular (top) and least popular (bottom) search phrases. For more information, see Search Metricsin Building Portals with Oracle WebCenter Portal.
Document Metrics (System Administrator)
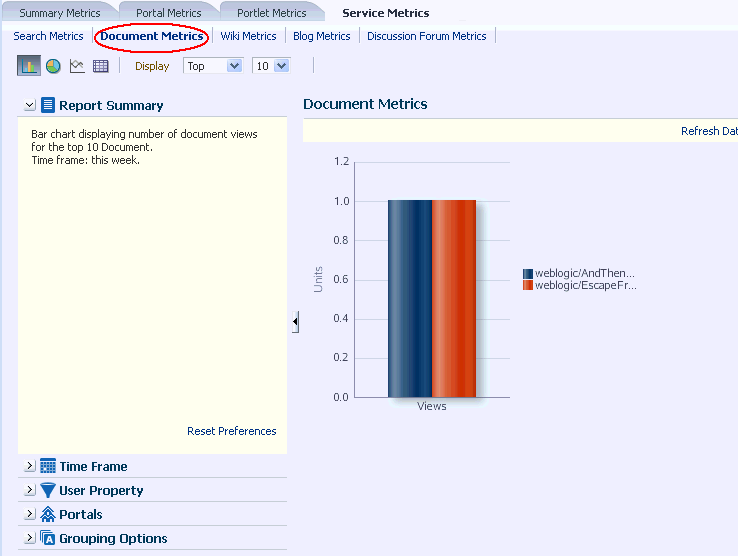
The Document Metrics task flow (Figure 5) tracks how often a document is accessed. Use this task flow to quickly see the most popular (top) and least popular (bottom) documents. You can filter the data to only show specific portals or show all portals.
Note: Documents in the Home Portal are included in this report.
Note: If you have two different documents with the same name, they are treated as two separate documents. The metrics include the parent folder for context.
Wiki Metrics (System Administrator)
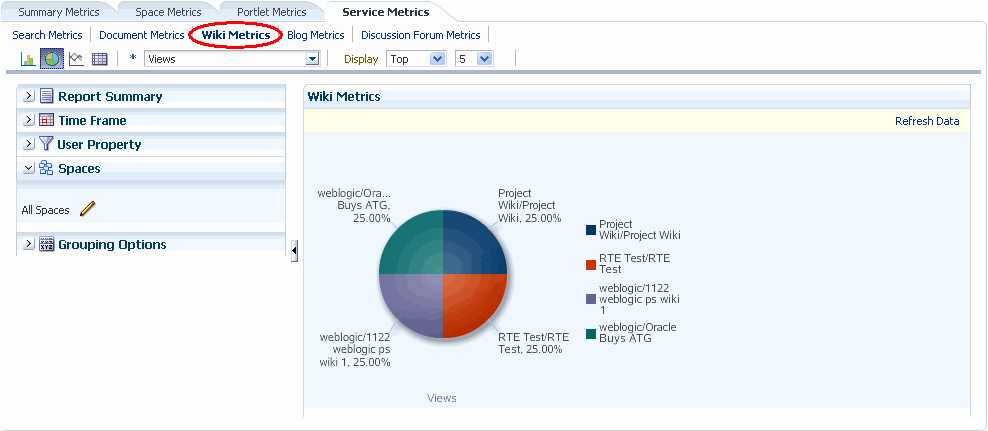
The Wiki Metrics task flow (Figure 6) tracks how often wikis are accessed within WebCenter Portal. Use this task flow to quickly see the most popular (top) and least popular (bottom) wikis. You can filter the data to only show specific portals or show all portals.
Blog Metrics (System Administrator)
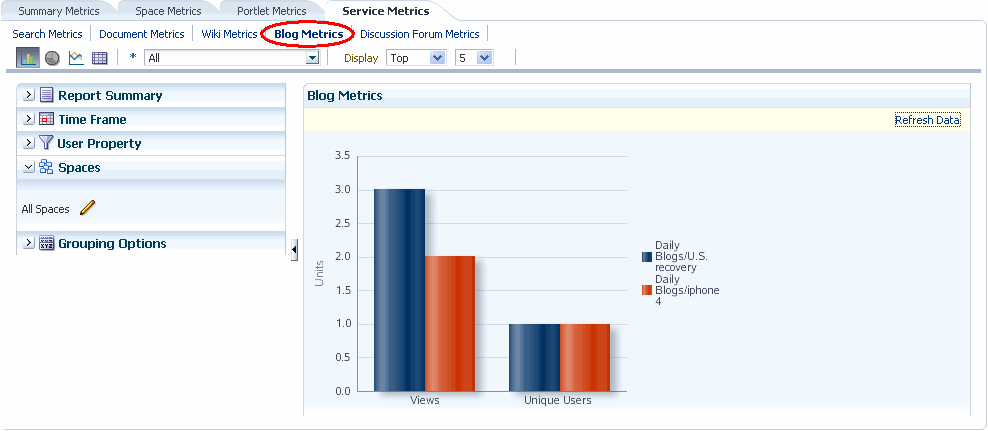
The Blog Metrics task flow (Figure 7) tracks how often blogs are accessed within WebCenter Portal. Use this task flow to quickly see the most popular (top) and least popular (bottom) blogs. You can filter the data to only show specific portals or show all portals.
Discussion Forum Metrics (System Administrator)
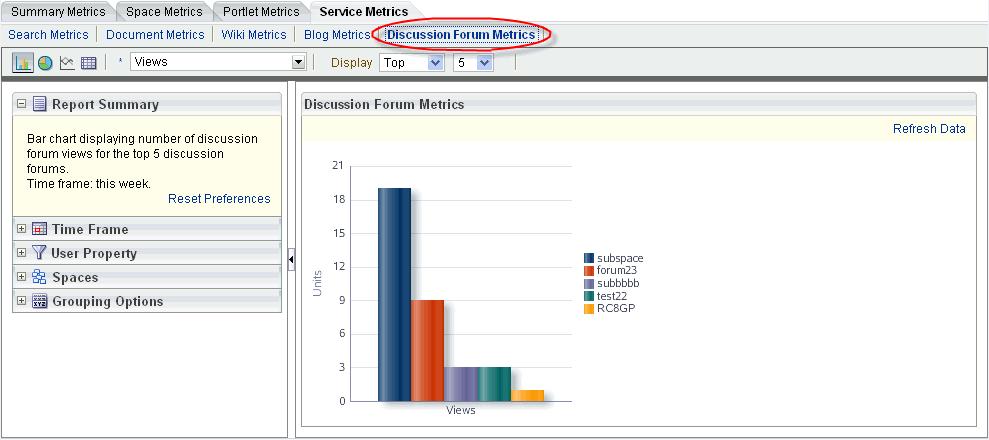
The Discussion Forum Metrics task flow (Figure 8) tracks discussion forums within WebCenter Portal. Use this task flow to quickly see the most popular (top) and least popular (bottom) discussions. You can filter the data to only show specific portals or show all portals.
Adding Analytics Task Flows to a Page
The process of adding an Analytics task flow to a page is the same as for any other task flow (for more information, see Adding Analytics to a Portalin Building Portals with Oracle WebCenter Portal). The process varies only in where you find these task flows in the resource catalog. All the Analytics task flows are under the Analytics folder.
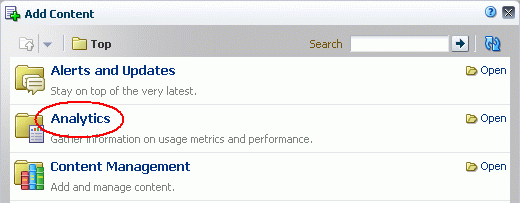
Note: When you add an Analytics task flow to a page in a portal, it displays information only for that portal, not for all portals.
Customizing Analytics Reports
You can set defaults for Analytics reports by editing the report settings in page Edit mode. Any changes you make while in Edit mode will become the default report settings for all users in page View mode.
For example, you can edit the Analytics page, changing the following settings on the Summary Metrics page in the Traffic report: set the report type to pie chart, set the time frame to this week, and remove Discussion Forums from the display. When users visit the Analytics page, those settings will be applied by default. Users can then edit the report as necessary for their needs. This can be useful if there are particular settings you know are commonly used by your users, or to customize a particular instance of an Analytics task flow on a group-specific page.
You can also configure report settings to specify the controls available to users in View mode. For more information, see Customizing Analytics Reports in Building Portals with Oracle WebCenter Portal.
Personalizing Your Analytics Report
Analytics task flows include display options at the top of the report and query options to the left of the report. These options enable you to personalize the report for your needs by changing the metrics included in the report and the way the report is presented. Most options are the same for all Analytics task flows.
This section includes the following subsections:
Report Display Options
The report display options at the top of the report enable you to select the type of report, select the type of metrics to include, and, for some task flows, control the top/bottom range to display.
Report Types
You can display your report as a bar chart, pie chart, line chart, or table depending on the display and query options you select. To choose your report type, click the associated icon.
Table 45-1 lists the report types available for different display and query options. It includes the following columns:
-
Selected Metrics specifies what has been selected in the list of metrics, a single metric or multiple metrics.
Note: Search Metrics and Document Metrics task flows show only those single metrics; there is no list to select metrics.
-
Group By Options specifies what has been selected in the Grouping Options section to the left of the report, No Selection or one of the available selections.
-
Bar, Pie, Line, and Table specify whether you can view that type of report with the specified selections.
Table 45-1 Display Options for the Analytics Task Flows
| Selected Metrics | Group By Option | Bar | Pie | Line | Table |
|---|---|---|---|---|---|
|
Single metric Login Traffic task flow |
No selection |
N |
N |
N |
Y |
|
Single metric All other task flows |
No selection |
Y |
Y |
N |
Y |
|
Single metric |
Time interval, user property, or Both* |
Y |
N |
Y |
Y |
|
Multiple metrics WebCenter Traffic and Login Traffic task flows |
No selection |
Y |
Y |
N |
Y |
|
Multiple metrics All other task flows |
No selection |
Y |
N |
Y |
Y |
|
Multiple metrics WebCenter Traffic and Login Traffic task flows |
Time interval or user property |
Y |
N |
Y |
Y |
|
Multiple metrics All other task flows |
Time interval or user property |
N |
N |
N |
Y |
|
Multiple metrics Login Traffic task flow |
Both* |
N |
N |
N |
Y |
* The grouping option Both is available only for the Login Traffic task flow.
Metrics
You can select which type of metrics to include in your report. Your metrics options differ depending on the task flow you are using:
-
WebCenter Traffic: Portals, Pages, Portlets, Logins, Searches, Wikis, Blogs, Discussion Forums, Documents
-
Page Traffic: Hits, Unique Users
-
Login Metrics: Logins, Unique Users
-
Space Traffic: Hits, Unique Users, Visits
-
Space Response Time: Average Response Time, Minimum Response Time, Maximum Response Time
-
Portlet Traffic: Hits, Unique Users
-
Portlet Instance Traffic: Hits, Unique Users
-
Portlet Response Time: Average Response Time, Minimum Response Time, Maximum Response Time
-
Portlet Instance Response Time: Average Response Time, Minimum Response Time, Maximum Response Time
-
Search Metrics: This task flow shows only search metrics, so it does not include an option to select metrics.
-
Document Metrics: This task flow shows only document metrics, so it does not include an option to select metrics.
-
Wiki Metrics: Views, Unique Users
-
Blog Metrics: Views, Unique Users
-
Discussion Forum Metrics: Views, Unique Users
To select which metrics to include in your report, select the metrics from the list above the report.

Top, Bottom, or Custom Ranges
With some task flows you can specify whether you want to see the top, bottom, all, or a custom ranges of metrics in your report. Use these options to see the most and least popular items in your portal.
To display the top or bottom ranges of metrics in your report, in the lists above the report, select Top or Bottom, and then select a number to define the range.
To display a custom range, in the list above the report, select Specify, then click Select.
The top and bottom options are available for Pages, Portlet Traffic, Portlet Instances Traffic, Response Time, Portlet Response Time, Portlet Instances Response Time.
The custom range option is available for Pages, Traffic, Response Time, Portlet Traffic, Portlet Instances Traffic, Response Time, Portlet Response Time, Portlet Instances Response Time, Search Metrics, Document Metrics, Wiki Metrics, Blog Metrics, Discussion Forum Metrics.
Query Options
Analytics task flows include the following query options to the left of the report:
-
Report Summary
Displays a summary of the selected display and query options shown in the report.
-
Time Frame
Enables you to specify the date range for the metrics displayed in the report. You can select from the following options: Yesterday, Today, This Week, Last Week, This Month, Last Month, Last Three Months, Last Six Months, This Year, Last Year, or you can specify your own date range.
-
User Property
Enables you to filter your report by user property. After selecting a property from the list, you can specify a value that the property must contain or must not contain, and only metrics that apply to the filtered property display in the report.
-
Property: Select a property on which to filter the report. You can select City, Company, Country, Department, Display Name, Employee ID, IM User, Manager, Phone, State or Province, Street, Title, or ZIP code
-
Operator: Select how you want to filter the property. You can select Contains or Does Not Contain.
-
Value: Type a value on which to filter the property.
Note: To search using a wildcard (for example, % or ?), you must prefix the wildcard with a forward slash (\). For example, to search for give or giving, type
giv\%in the Value box. -
-
Additional Options
Enables you to include Home portal pages in report data. These options are available with the Pages task flow (in the Page Traffic report).
-
Portals
When Analytics task flows display in the Home portal or on a business role page, you can choose which portals to include in your report. When Analytics task flows are used within a particular portal, only metrics only for that portal display; the Portals option is unavailable (grayed out).
To specify the portals to include in your report, click the Portal Filter icon to display the Specify Portals popup. Select the portals you want to include in your report, using Ctrl+click and Shift+click to select multiple portals.
This option is not available with the Traffic, Logins, or Search Metrics task flows.
-
Grouping Options
Enables you to select an option by which to group the metrics in your report. You can group by a time interval (Hour, Day, Week, Month, or Year), a user property, or, with the Logins task flow, both.
Note: This setting affects the available display options for the report (see Table 1).
Setting Analytics Task Flow Properties
The Analytics service task flows have associated properties, which users with sufficient privileges can access through the task flows’ View Actions menu. For example, select Parameters to show the Parameters dialog (Figure 11).
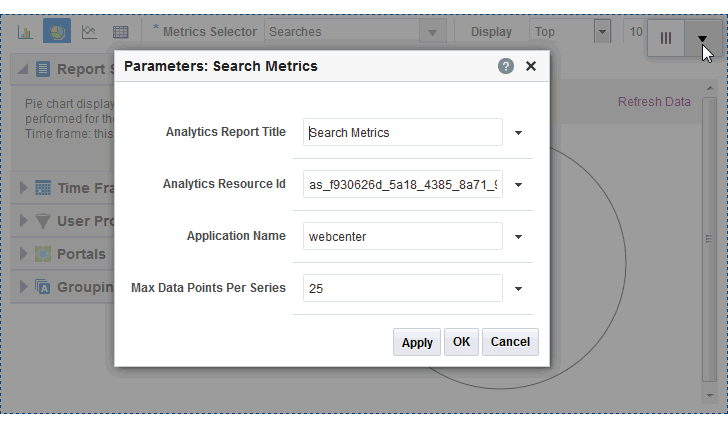
The following sections provide information about properties of the Analytics service task flows and describe the task flow parameters:
About the Analytics Service Task Flow Properties
When you edit a page, the View Actions menu appears in the toolbar of the Analytics task flows when you click the task flow. The View Actions menu provides access to the properties dialogs: Parameters, Access, Display Options, Style, and Content Style.
- Parameters control the default task flow content. For descriptions of each parameter, see Analytics Service Task Flow Parameters. Parameters can be wired to events, and can be used facilitate the wiring of the task flow to page parameters and page definition variables. For more information, see Wiring Pages, Task Flows, Portlets, and UI Components in Building Portals with Oracle WebCenter Portal.
-
Access settings show or hide the component to specific roles, users, or groups. For more information, see Setting Component Access in Building Portals with Oracle WebCenter Portal.
- The Display Options, Style, and Content Style properties affect the appearance and behavior of the task flow for all users. These properties are common to all task flows. For more information, see Modifying Components in Building Portals with Oracle WebCenter Portal.
The Parameters and Display Options dialogs provide access to an Expression Language (EL) editor, which you can use to select or specify a variable value instead of a constant value. Click the  icon next to a property, then select Expression Builder to open the editor.
Note: When you enter EL in the Display Options dialog, the parser reports an error only if it detects invalid syntax, such as a missing closing bracket. Validation is performed only on syntax, not on the expression value. Generic Display Options are those cataloged in Setting Component Display Options Properties in Building Portals with Oracle WebCenter Portal.
EL validation is not performed on non-generic display options. If you need EL assistance, an application developer can provide an EL expression; see Expression Language Expressions in Developing for Oracle WebCenter Portal.
Analytics Service Task Flow Parameters
Table 45-2 describes the parameters that are unique to the Analytics service task flows.
Table 45-2 Analytics Task Flow Parameters
| Parameter | Description |
|---|---|
|
Analytics Report Title |
Specifies the display title that appears above the analytics data. Note:
|
|
Analytics Resource Id |
Specifies the MDS document used to store user customizations/application customizations for the task flow instance in MDS. Warning: Do not edit this value. |
|
Application Name* |
Specifies the WebCenter Portal application for which you want to display analytics data. For WebCenter Portal, this is always The analytics database can be used to store event data from multiple applications so this parameter is required to identify which application data to display. If omitted, the task flow displays analytics data for all supported WebCenter Portal applications. |
|
Max Data Points Per Series |
Indicates the maximum number of data points to be displayed in a bar or line chart. The default value is 25. Valid values are between 1 and 1000. Note: Increasing the number of data points might increase the time it takes to render the report. |