Chapter 2 Health Tab
Use the Health tab to monitor the overall health and status of your Oracle VM environment, and to view historical statistics such as memory and CPU usage. The System Statistics Collection service must be enabled for information to be updated on this tab. See Section 7.4, “Preferences” for information on how to configure this service.
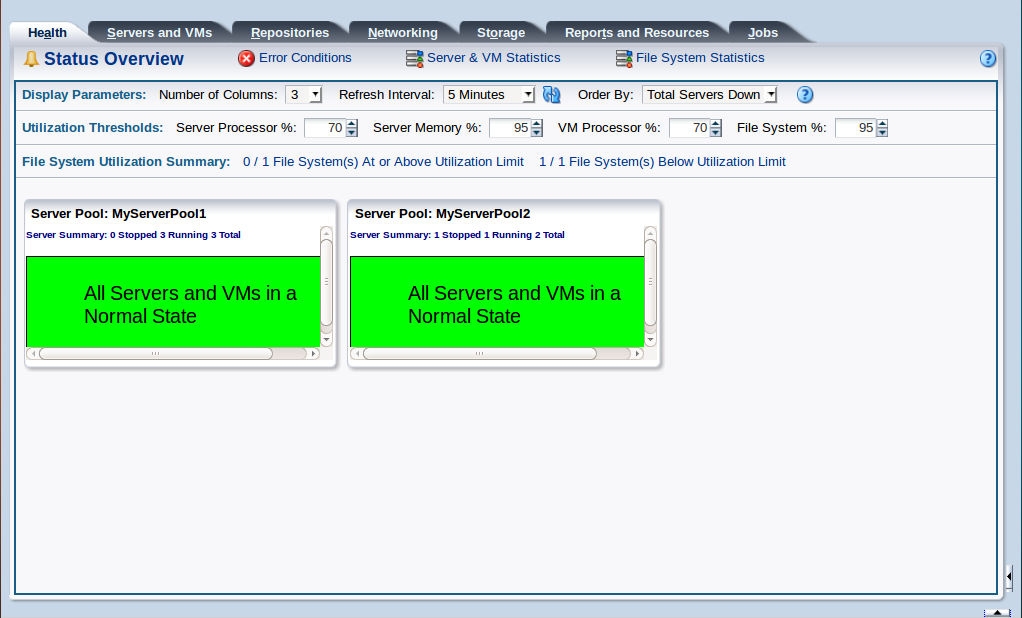
Figure 2.1, “Health tab” shows the Health tab.
The Health tab contains the subtabs set out in Table 2.1, “Health Subtabs”.
|
Subtab |
Description |
|---|---|
|
Displays information about each server pool, Oracle VM Server summary, and the number of Oracle VM Servers that are running or stopped. |
|
|
Displays an up-to-date view of all error conditions and warnings. |
|
|
Displays historical statistics for your Oracle VM Servers and virtual machines. |
|
|
Displays utilization statistics for file systems that are in use by Oracle VM Servers within the environment.. |
![]() Section 1.9, “Help Icon” displays context sensitive help about
the Health tab.
Section 1.9, “Help Icon” displays context sensitive help about
the Health tab.
2.1 Status Overview
The dashboard displays information about each server pool, Oracle VM Server summary, and the number of Oracle VM Servers that are running or stopped. Note that information is not displayed for Oracle VM Servers or virtual machines that are not assigned to a server pool.
A green, yellow, or red status is displayed for each server pool:
Green: All Oracle VM Servers and virtual machines are in a normal state.
Yellow: One or more Oracle VM Server(s) has a CPU or memory utilization above the specified limit. One or more virtual machine(s) has a CPU utilization above the specified limit. One or more file systems has a utilization above the specified limit. Click the hyperlink to view detailed information. See Section 2.1.2, “Detailed Information Dialog” for more information on this dialog.
Red: One or more Oracle VM Server(s) has unacknowledged events indicating a down state that needs operator attention. Click the hyperlink to view detailed information.
The information displayed here is dependent on the statistics collection facility being enabled. If this facility is disabled, a message is displayed to indicate that statistics for health monitoring are unavailable and that the statistics collection facility must be enabled if you wish to use this feature in the future. More information on enabling and configuring the statistics collection facility is available in Section 7.4, “Preferences”. Also note that statistics collection is an asynchronous and periodic service, so the information displayed on the Health tab is not in real time, but is dependent on the statistics collection and file system statistics intervals that are configured for this service.
2.1.1 Toolbar
This section contains the toolbar options in the Status Overview subtab of the Health tab.
Display Parameters
The Display Parameters options allow you to control how the information in the Status Overview subtab is displayed. The following options are available:
-
Number of Columns: Sets the number of columns displayed. Select between 1 to 10 columns.
-
Refresh Interval: Sets the interval between which the statistics are refreshed. Select 30 seconds, 1, 2, 5 or 10 minutes. The default setting is 5 minutes.
-
Order By: Sets the sort order for the information. Sort by Total Servers Down, Total VMs Down, or Alphabetically.
These settings are persistent across each user login, as described in Section 1.3, “User Preference Persistence”.
Utilization Thresholds
The Utilization Thresholds options at the top of the panel allows you to set the parameters available to trigger different health warnings. The following options are available:
-
Server Processor %: Sets the percentage of processor utilization on an Oracle VM Server to trigger a warning. The default setting is 70%. Note that this setting does not apply to Unassigned Servers.
-
Server Memory %: Sets the percentage of memory utilization on an Oracle VM Server to trigger a warning. The default setting is 95%. Note that this setting does not apply to Unassigned Servers.
-
VM Processor %: Sets the percentage of processor utilization for a virtual machine to trigger a warning. The default setting is 70%. Note that this setting does not apply to Unassigned Virtual Machines.
-
File System %: Sets the percentage of file system utilization for an Oracle VM Server to trigger a warning. The default setting is 95%.
These settings are persistent across each user login, as described in Section 1.3, “User Preference Persistence”.
File System Utilization Summary
The File System Utilization Summary toolbar provides two links to allow you to view information about file systems that are either above or below the utilization threshold. The link text indicates the number of file systems that are being monitored and the number of these that are either above or below the utilization threshold. Clicking on either link provides a listing of the file systems that match the criteria specified by the link text.
The information displayed in the resulting dialog lists the file systems in a tabulated format. The following columns are presented:
-
Name: The name of the file system, as stored in Oracle VM Manager.
-
Storage Device: The name of the storage device where the file system is located. This column is not displayed if the storage type is a file server.
-
Total Size (GiB): The total size of the file system measured in gibibytes.
-
Available Size (GiB): The amount of free or available space on the file system measured in gibibytes.
-
Used Size (GiB): The amount of space that is currently used on the file system measured in gibibytes.
-
Utilization (%): The calculated percentage of space currently used on the file system.
-
Last Refreshed: The date and time when the last file system statistics were collected and refreshed.
Note that if System Statistics Collection is disabled as described in Section 7.4, “Preferences”, a message notifying you that the service is disabled and not available for health monitoring is displayed in this toolbar instead.
2.1.2 Detailed Information Dialog
When a Yellow or Red status is shown for a server pool in the Status Overview dashboard, the message appears as a hyperlink that opens a dialog containing more detailed information to describe the incident that needs attention. This dialog provides facilities to discover events leading up to an incident.
The dialog toolbar includes various icons to help you resolve
any issues. Select the item in the table that you wish to act
on. Click the Events icon
![]() to view more information about the events within the log related
to the item that you are working with. You may need to
acknowledge particular events in order to resolve an issue. See
Section 1.10.4.2, “Events Perspective” for information on
acknowledging events.
to view more information about the events within the log related
to the item that you are working with. You may need to
acknowledge particular events in order to resolve an issue. See
Section 1.10.4.2, “Events Perspective” for information on
acknowledging events.
2.2 Error Conditions
The Error Conditions subtab displays an up-to-date view of all error conditions and warnings.
The table view in the Error Conditions subtab includes the following fields:
-
Severity: The severity level assigned to the error event.
-
Timestamp: The date and time the error event occurred.
-
Modify Time: The last recorded date and time the error event was modified.
-
Name: The name of the object associated with the error event.
-
Category: The category of the object associated with the error event.
-
Type: The type of error event according to Oracle VM Manager's event categorization model.
-
Summary: A summary description of the error event.
-
Acknowledged: Whether the error event has been acknowledged.
-
User Acknowledgeable: Whether the error event can be acknowledged by the user.
Alongside each event entry in the table, there is an arrow that allows you to expand the view for each entry. This displays the full Description for the event.
2.2.1 Toolbar
The Error Conditions subtab of the Health tab includes the toolbar items:
-
View: Controls the columns to display, and the sort order of columns.
-
Refresh Interval: Sets the interval between which the statistics are refreshed. Select 30 seconds, 1, 2, 5 or 10 minutes. The default setting is 5 minutes.
-
Refresh Now: The
 icon refreshes the statistical information.
-
Include Acknowledged: Provides an option to view acknowledged error events. To see a history of acknowledged events, select Yes in the drop-down list. The default setting is No.
2.3 Server and VM Statistics
Oracle VM Manager periodically collects vital statistics such as memory and CPU usage. Select the Server and VM Statistics subtab of the Health tab to view historical statistics for your Oracle VM Servers and virtual machines. Note that statistics collection is an asynchronous and periodic service, so the information displayed on the Health tab is not in real time, but is dependent on the statistics collection interval that is configured for this service. Furthermore, the historical period over which you are able to view this data is limited to the statistics collection hold time value configured for this service. Views of different statistical information are provided by clicking on elements in the navigation pane.
You can disable statistics collection in Oracle VM Manager from the Preferences subtab of the Reports and Resources tab. For more information about disabling statistic collection, and the implications of doing so, see Section 7.4, “Preferences”.
2.3.1 Toolbar
The navigation pane toolbar on the Statistics subtab of the Health tab, includes the following item:
2.3.2 Server Pools Folder
By clicking on the Server Pools folder in the navigation tree in the navigation pane, you can view the following statistical information about server pools:
-
Server Pool Name: The name of the server pool. The following columns are available, presenting information for each server pool:
-
Processors:
-
Server Total: Total number of processors of all Oracle VM Servers in the server pool.
-
VM Allocated: Total number of processors available for use by virtual machines in the server pool.
-
VM Used: Total number of processors in use by virtual machines in the server pool.
-
-
Memory (GiB):
-
Total: Total amount of memory, in GiB, in the server pool.
-
Configured: Total amount of memory, in GiB, available for use by virtual machines in the server pool.
-
Used: Total amount of memory, in GiB, in use by virtual machines in the server pool.
-
-
Last Refreshed: The date and time when the last server pool statistics were collected and refreshed.
-
The toolbar items include:
|
Toolbar Option |
Icon |
Description |
|---|---|---|
|
View |
A drop down which controls the columns to display, and the sort order of columns. |
|
|
Refresh Interval |
Sets the interval between which the statistics are refreshed. Select 30 seconds, 1, 2, 5 or 10 minutes. The default setting is 5 minutes. These settings are persistent across each user login, as described in Section 1.3, “User Preference Persistence”. |
|
|
Refresh View Now |
|
Refreshes the statistical information. |
2.3.3 Server Pool Item
By expanding the Server Pools node in the navigation pane, you can click on individual server pools. Clicking on a server pool displays the following statistical data:
-
Server Name: The name of the Oracle VM Server. The following columns are available, presenting information for each Oracle VM Server:
-
Processors:
-
Utilization (%): The percentage of total processors in use on the Oracle VM Server.
-
Total: The number of processors available on the Oracle VM Server.
-
-
Memory (GiB):
-
Utilization (%): The percentage of total memory in use on the Oracle VM Server.
-
Total: The memory, in GiB, on the Oracle VM Server.
-
Usable by VMs: The memory, in GiB, available for use on the Oracle VM Server.
NoteUsable memory is a calculated value. As a result it is possible for the sum of the usable memory value and the used memory value to be greater than the total memory.
-
Used: The memory, in GiB, in use by the operating system, its processes, and virtual machine management.
-
-
Last Refreshed: The date and time when the last server statistics were collected and refreshed. This field may appear blank if no statistics have been collected. This may occur if the server is stopped.
-
The toolbar items include:
|
Toolbar Option |
Icon |
Description |
|---|---|---|
|
View |
A drop down which controls the columns to display, and the sort order of columns. |
|
|
Refresh Interval |
Sets the interval between which the statistics are refreshed. Select 30 seconds, 1, 2, 5 or 10 minutes. The default setting is 5 minutes. These settings are persistent across each user login, as described in Section 1.3, “User Preference Persistence”. |
|
|
Refresh View Now |
|
Refreshes the statistical information. |
|
|
Opens a dialog containing a line graph view of the statistics as they are refreshed. |
2.3.3.1 Server Line Graph
Oracle VM Server statistics are displayed for running Oracle VM Servers using the Server Statistics dialog.
-
Click the Health tab.
-
Select the server pool in which the Oracle VM Server resides in the navigation tree. Alternatively, select the Unassigned Servers folder.
-
Select the Oracle VM Server in the management pane table, and click Line Graph
 in the management pane toolbar.
-
Select the number of minutes for which to display statistics for the Oracle VM Server in the Display From field. You can either enter the number of minutes, or use the arrows to incrementally change the minutes. You can enter between 1 minute, and the maximum number of minutes for which statistics are held. This upper limit is set using the Preferences subtab of the Reports and Resources tab. See Section 7.4, “Preferences” for more information on setting the maximum time for which statistics are held.
Set the refresh interval using the Refresh Interval drop down.
The Processor Utilization and Memory Utilization for the Oracle VM Server is displayed in the line graphs.
Click OK to close the dialog.
2.3.4 Server Item
By expanding a Server Pool item in the navigation tree, you can select Oracle VM Servers in the server pool. Clicking on an Oracle VM Server displays the following statistical data:
-
Virtual Machine Name: The name of the virtual machine. The following columns are available, presenting information for each virtual machine:
-
Processors:
-
Configured: The number of processors set in the virtual machine.
-
Current: The number of processors in use by the virtual machine.
-
Utilization (%): The percentage of the total processors in use by the virtual machine.
-
-
Memory (GiB):
-
Configured: The amount of memory, in GiB, set for the virtual machine.
-
Used: The memory, in GiB, in use by the virtual machine.
-
-
Last Refreshed: The date and time when the last virtual machine statistics were collected and refreshed. This field may appear blank if no statistics have been collected. This may occur if a virtual machine is stopped.
-
The toolbar items include:
|
Toolbar Option |
Icon |
Description |
|---|---|---|
|
View |
A drop down which controls the columns to display, and the sort order of columns. |
|
|
Refresh Interval |
Sets the interval between which the statistics are refreshed. Select 30 seconds, 1, 2, 5 or 10 minutes. The default setting is 5 minutes. |
|
|
Refresh View Now |
|
Refreshes the statistical information. |
|
|
Opens a dialog containing a line graph view of the statistics as they are refreshed. |
2.3.4.1 Virtual Machine Line Graph
Virtual machine statistics for processor utilization are displayed for running virtual machines using the Virtual Machine Statistics dialog.
-
Click the Health tab.
-
Select the Oracle VM Server on which the virtual machine resides in the navigation tree.
-
Select the virtual machine in the management pane, and click Line Graph
in the management pane toolbar.
-
Select the number of minutes for which to display statistics for the virtual machine in the Display From field. You can either enter the number of minutes, or use the arrows to incrementally change the minutes. You can enter between 1 minute, and the maximum number of minutes for which statistics are held. This upper limit is set using the Preferences subtab of the Reports and Resources tab. See Section 7.4, “Preferences” for more information on setting the maximum time for which statistics are held.
Set the refresh interval using the Refresh Interval drop down.
The Processor Utilization for the virtual machine is displayed in the line graph.
Click OK to close the dialog.
2.3.5 Unassigned Servers Folder
By clicking on the Unassigned Servers folder in the navigation tree, you can view the following statistical information:
-
Server Name: The name of the Oracle VM Server. The following columns are available, presenting information for each Oracle VM Server:
-
Processors:
-
Utilization (%): The percentage of total processors in use on the Oracle VM Server.
-
Total: The number of processors available on the Oracle VM Server.
-
-
Memory (GiB):
-
Utilization (%): The percentage of total memory in use on the Oracle VM Server.
-
Total: The memory, in GiB, on the Oracle VM Server.
-
Usable by VMs: The memory, in GiB, available for use on the Oracle VM Server.
NoteUsable memory is a calculated value. As a result it is possible for the sum of the usable memory value and the used memory value to be greater than the total memory.
-
Used: The memory, in GiB, in use by the operating system, its processes, and virtual machine management.
-
-
Last Refreshed: The date and time when the last server statistics were collected and refreshed. This field may appear blank if no statistics have been collected. This may occur if the server is stopped.
-
The toolbar items include:
|
Toolbar Option |
Icon |
Description |
|---|---|---|
|
View |
A drop down which controls the columns to display, and the sort order of columns. |
|
|
Refresh Interval |
Sets the interval between which the statistics are refreshed. Select 30 seconds, 1, 2, 5 or 10 minutes. The default setting is 5 minutes. |
|
|
Refresh View Now |
|
Refreshes the statistical information. |
|
|
Opens a dialog containing a line graph view of the statistics as they are refreshed. |
2.3.5.1 Server Line Graph
Oracle VM Server statistics are displayed for running Oracle VM Servers using the Server Statistics dialog.
-
Click the Health tab.
-
Select the server pool in which the Oracle VM Server resides in the navigation tree. Alternatively, select the Unassigned Servers folder.
-
Select the Oracle VM Server in the management pane table, and click Line Graph
in the management pane toolbar.
-
Select the number of minutes for which to display statistics for the Oracle VM Server in the Display From field. You can either enter the number of minutes, or use the arrows to incrementally change the minutes. You can enter between 1 minute, and the maximum number of minutes for which statistics are held. This upper limit is set using the Preferences subtab of the Reports and Resources tab. See Section 7.4, “Preferences” for more information on setting the maximum time for which statistics are held.
Set the refresh interval using the Refresh Interval drop down.
The Processor Utilization and Memory Utilization for the Oracle VM Server is displayed in the line graphs.
Click OK to close the dialog.
2.3.6 Unassigned Servers Item
By expanding the Unassigned Servers folder in the navigation tree, you can select Oracle VM Servers that are not part of a server pool. Clicking on an Oracle VM Server displays the following statistical data:
-
Virtual Machine Name: The name of the virtual machine. The following columns are available, presenting information for each virtual machine:
-
Processors:
-
Configured: The number of processors set in the virtual machine.
-
Current: The number of processors in use by the virtual machine.
-
Utilization (%): The percentage of the total processors in use by the virtual machine.
-
-
Memory (GiB):
-
Configured: The amount of memory, in GiB, set for the virtual machine.
-
Used: The memory, in GiB, in use by the virtual machine.
-
-
Last Refreshed: The date and time when the last virtual machine statistics were collected and refreshed. This field may appear blank if no statistics have been collected. This may occur if a virtual machine is stopped.
-
The toolbar items include:
|
Toolbar Option |
Icon |
Description |
|---|---|---|
|
View |
A drop down which controls the columns to display, and the sort order of columns. |
|
|
Refresh Interval |
Sets the interval between which the statistics are refreshed. Select 30 seconds, 1, 2, 5 or 10 minutes. The default setting is 5 minutes. |
|
|
Refresh View Now |
|
Refreshes the statistical information. |
| Line Graph |
|
Opens a dialog containing a line graph view of the statistics as they are refreshed. |
2.3.6.1 Virtual Machine Line Graph
Virtual machine statistics for processor utilization are displayed for running virtual machines using the Virtual Machine Statistics dialog.
-
Click the Health tab.
-
Select the Oracle VM Server on which the virtual machine resides in the navigation tree.
-
Select the virtual machine in the management pane, and click Line Graph
in the management pane toolbar.
-
Select the number of minutes for which to display statistics for the virtual machine in the Display From field. You can either enter the number of minutes, or use the arrows to incrementally change the minutes. You can enter between 1 minute, and the maximum number of minutes for which statistics are held. This upper limit is set using the Preferences subtab of the Reports and Resources tab. See Section 7.4, “Preferences” for more information on setting the maximum time for which statistics are held.
Set the refresh interval using the Refresh Interval drop down.
The Processor Utilization for the virtual machine is displayed in the line graph.
Click OK to close the dialog.
2.3.7 Unassigned Virtual Machines Folder
By clicking on the Unassigned Virtual Machines folder in the navigation tree, you can view the following statistical information:
-
Virtual Machine Name: The name of the virtual machine. The following columns are available, presenting information for each virtual machine:
-
Processors:
-
Configured: The number of processors set in the virtual machine.
-
Current: The number of processors in use by the virtual machine.
-
Utilization (%): The percentage of the total processors in use by the virtual machine.
-
-
Memory (GiB):
-
Configured: The amount of memory, in GiB, set for the virtual machine.
-
Used: The memory, in GiB, in use by the virtual machine.
-
-
Last Refreshed: The date and time when the last virtual machine statistics were collected and refreshed. This field may appear blank if no statistics have been collected. This may occur if a virtual machine is stopped.
-
The toolbar items include:
|
Toolbar Option |
Icon |
Description |
|---|---|---|
|
View |
A drop down which controls the columns to display, and the sort order of columns. |
|
|
Refresh Interval |
Sets the interval between which the statistics are refreshed. Select 30 seconds, 1, 2, 5 or 10 minutes. The default setting is 5 minutes. |
|
|
Refresh View Now |
|
Refreshes the statistical information. |
|
|
Opens a dialog containing a line graph view of the statistics as they are refreshed. |
2.3.7.1 Virtual Machine Line Graph
Virtual machine statistics for processor utilization are displayed for running virtual machines using the Virtual Machine Statistics dialog.
-
Click the Health tab.
-
Select the Oracle VM Server on which the virtual machine resides in the navigation tree.
-
Select the virtual machine in the management pane, and click Line Graph
in the management pane toolbar.
-
Select the number of minutes for which to display statistics for the virtual machine in the Display From field. You can either enter the number of minutes, or use the arrows to incrementally change the minutes. You can enter between 1 minute, and the maximum number of minutes for which statistics are held. This upper limit is set using the Preferences subtab of the Reports and Resources tab. See Section 7.4, “Preferences” for more information on setting the maximum time for which statistics are held.
Set the refresh interval using the Refresh Interval drop down.
The Processor Utilization for the virtual machine is displayed in the line graph.
Click OK to close the dialog.
2.4 File System Statistics
Oracle VM Manager periodically collects vital statistics about file system utilization. Select the File System Statistics subtab of the Health tab to view the current statistics reported for each file system in use by your Oracle VM Servers. Statistics are only collected for file systems that are mounted within your Oracle VM environment for the purpose of hosting a repository.
Note that statistics collection is an asynchronous and periodic service, so the information displayed on the Health tab is not in real time, but is dependent on the file system statistics collection interval that is configured for this service. Furthermore, the historical period over which you are able to view this data is limited to the statistics collection hold time value configured for this service.
Statistics for file systems are organized by the storage where they are hosted. There are top-level nodes for File Servers, Local File Systems and Shared File Systems. You can expand these nodes in the navigation pane to list all of the storage for which file system statistics are available. Clicking on a storage node in the navigation pane updates the management pane to display the file systems available for that storage node and displays the relevant statistics.
You can disable statistics collection in Oracle VM Manager from the Preferences subtab of the Reports and Resources tab. For more information about disabling statistic collection, and the implications of doing so, see Section 7.4, “Preferences”.
The toolbar at the top of the management pane provides the following options:
|
Toolbar Option |
Icon |
Description |
|---|---|---|
|
View |
A drop down which controls the columns to display, and the sort order of columns. |
|
|
Refresh Interval |
Sets the interval between which the statistics are refreshed. Select 70 seconds, 2, 5 or 10 minutes. The default setting is 2 minutes. |
|
|
Refresh View Now |
|
Refreshes the statistical information. |
|
|
Opens a dialog containing a line graph view of the statistics as they are refreshed. |
The table displayed in the management pane for any file server or storage entity includes the following columns:
-
Name: The name of the file system, as stored in Oracle VM Manager.
-
Storage Device: The name of the storage device where the file system is located. This column is not displayed if the storage type is a file server.
-
Total Size (GiB): The total size of the file system measured in gibibytes.
-
Available Size (GiB): The amount of free or available space on the file system measured in gibibytes.
-
Used Size (GiB): The amount of space that is currently used on the file system measured in gibibytes.
-
Utilization (%): The calculated percentage of space currently used on the file system.
-
Last Refreshed: The date and time when the last file system statistics were collected and refreshed.
2.4.1 File System Statistics Line Graph
Statistics for file system utilization are displayed for using the File System Statistics dialog.
-
Click the Health tab.
-
Select the File System Statistics subtab of the Health tab.
-
Select the file system in the management pane, and click Line Graph
in the management pane toolbar.
-
Select the number of minutes for which to display statistics for the file system in the Display From field. You can either enter the number of minutes, or use the arrows to incrementally change the minutes. You can enter between 70 seconds and 10 minutes.
Set the refresh interval using the Refresh Interval drop down.
The File System utilization is displayed in the line graph.
Click OK to close the dialog.