In this section Hide
In the Breakdown Details dialog box, if you click Every Distinct Value, the report includes a column or row for every distinct (unique) value of the variable. This option uses the values available at the time the report is run, not at the time you define the report.
1. In the Breakdown Details dialog box, click Every Distinct Value.
2. To include a column or row in the report to represent all values for the variable (including null values if Include a category for Null values is checked), check Include a category for ALL selected values. For reports that display percentages, the report must include a row or column for All.
Note: If a case is counted in multiple columns or rows, a count in the All column or row is not necessarily the same as the total of counts in other columns or rows of the report. Also, percentages in the columns or rows may add up to greater than 100 percent.
3. To include a column or row to represent null (missing) values for the variable, check Include a category for Null values.
4. Click OK.
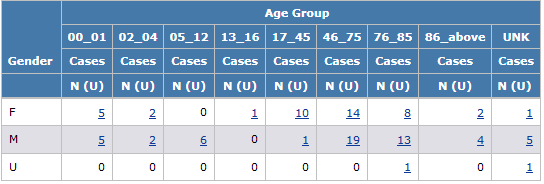
In the following example, the All row shows the number of cases with any of the Gender values for each Age Group. The All column shows the number of cases with any Age Group for each Gender. Also, the NULL column shows the number of cases (in this example, none) that have no Age Group for each Gender.

Note: See Specifying Content Details for information about the behavior of the All row when unique counts are shown for column variables.