3 Working with Cohort Criteria and Queries
This chapter contains the following topics:
Categories and Topics
The query criteria are grouped into three broad data categories—Patient information, Clinical data, and Genomic data.
Each category is further divided into multiple topics where you can drill into specific parameters.
Patient Information
Demographics
Figure 3-1 Patient Information Demographics options
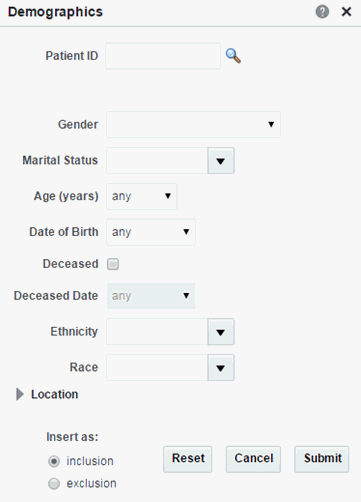
Description of ''Figure 3-1 Patient Information Demographics options''
Table 3-2 Demographics Details
| Field Name | Definition | Sample Value or Values |
|---|---|---|
|
Patient ID or Subject ID |
Double-blinded unique identifier for the Patient. Also known as the Oracle ID |
- |
|
Gender |
Patient's gender |
Male, Female |
|
Marital Status |
Patient's marital status |
Married, Single, Separated, Divorced |
|
Age (in Years) |
Patient's chronological age |
- |
|
Date of Birth |
Patient's date of birth |
- |
|
Deceased Date |
Patient's decease date |
- |
|
Ethnicity |
Code to reflect Patient's ethnicity |
- |
|
Race |
Code to reflect Patient's race |
- |
|
City |
Code for Patient's City of residence |
- |
|
State |
Code for Patient's State of residence |
- |
|
Zip Code |
Code for Patient's Zip code |
- |
|
County |
Code for Patient's County |
- |
|
Country |
Code for Patient's Country |
- |
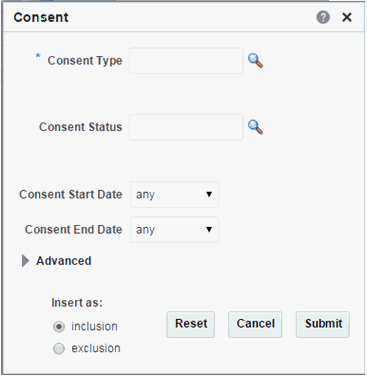
Consent
Table 3-3 Consent Screen Fields
| Prompt Heading | Definition | Sample Value |
|---|---|---|
|
Consent Type Code |
Authorization for specified medical care. |
Procedure Consent, Specimen Consent |
|
Consent Status |
The status of the consent form. |
Active, Pending, Refused |
|
Consent Start Date |
The period start date of the patient's consent. |
- |
|
Consent End Date |
The period end date of the patient's consent. |
- |
Clinical Data
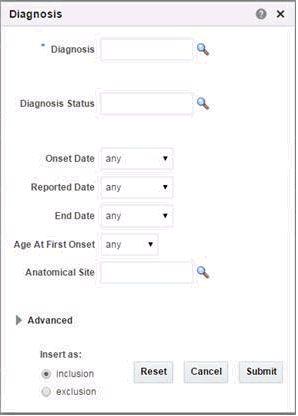
Diagnosis
Click the magnifying glass icon for Diagnosis, to search either by Diagnosis Code or Diagnosis Name.
Table 3-4 Diagnosis Screen Fields
| Prompt Heading | Definition | Sample Value |
|---|---|---|
|
Diagnosis |
Code that classifies the patient's clinical condition. |
Most commonly identified with ICD codes. |
|
Diagnosis Status |
Code that reflects the status of the Diagnosis |
Active, New, Recurring |
|
Onset Date |
Date of the onset |
- |
|
Reported Date |
Date when the diagnosis was recorded by a service provider |
- |
|
End Date |
Date of resolution. |
- |
|
Age at First Onset |
Age of the patient at first onset (years) |
- |
|
Anatomical Site |
Anatomical site or sites related to the diagnosis |
- |
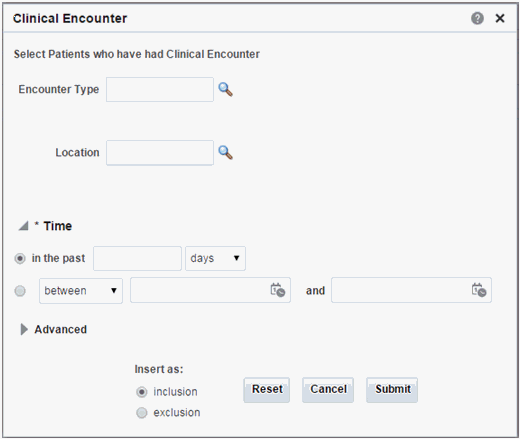
Clinical Encounter
Click the magnifying glass icon, next to Encounter Type, to search either by Encounter Code or Encounter Name.
Table 3-5 Clinical Encounter Screen Fields
| Prompt Heading | Definition | Sample Value |
|---|---|---|
|
Encounter Type |
Type of clinical encounter that individual has undergone, valid values may be inpatient, outpatient |
Inpatient, Outpatient |
|
Location |
Facility where it took place, generally name of the hospital, clinic, doctors office and so on |
Sequoia Hospital, Medical Associates, Mass General Hospital Ear and Nose Dept |
|
Time |
Date when encounter took place |
- |
|
Datasource |
Name of the data system actual clinical data is coming from |
EMR1, EMR2 |
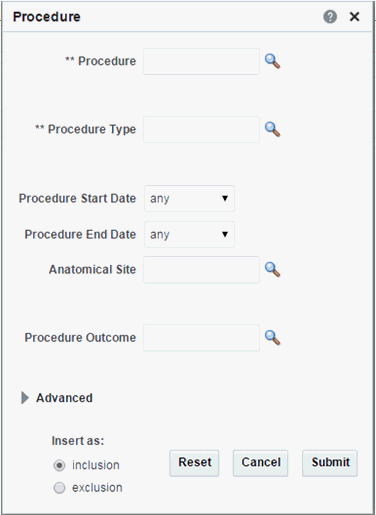
Procedure
Click the magnifying glass icon for Procedure, to search either by Procedure Code or Procedure Name.
Table 3-6 Procedure Screen Fields
| Prompt Heading | Definition | Sample Value |
|---|---|---|
|
Procedure |
A discreet intervention performed by a clinician. Procedures are most commonly identified with CPT codes |
- |
|
Procedure Type |
A sub categorization of procedures |
Surgical, Radiology, Diagnostic |
|
Procedure Start Date |
The date when the procedure began |
- |
|
Procedure End Date |
The date when the procedure concluded |
- |
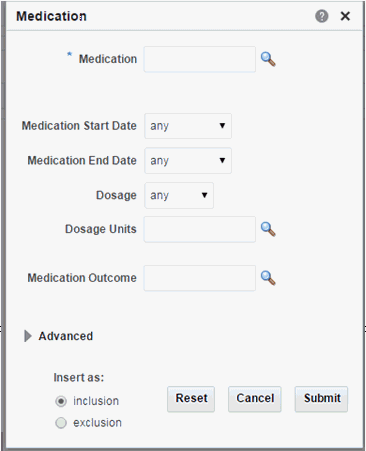
Medication
Click the magnifying glass icon for Medication to search either by Medication Code or Medication Name. There are two search modes available. For details, see Medication Search Modes.
Table 3-7 Medication Screen Fields
| Prompt Heading | Definition | Sample Value |
|---|---|---|
|
Medication |
A pharmaceutical substance intended to provide therapeutic benefit. |
NDC codes, RxNorm codes |
|
Medication Start Date |
The start date for the administration of the medication. |
- |
|
Medication End Date |
The end date for the administration of the medication. |
- |
|
Dosage |
The medication's dosage. |
- |
|
Dosage Units |
Code for the medication dosage's units. |
- |
|
Medication Outcome |
Clinical outcome of taking a given medication as assessed by clinician or medical professional |
Partial Recovery, Full Recovery, Adverse Reaction |
Medication Search Modes
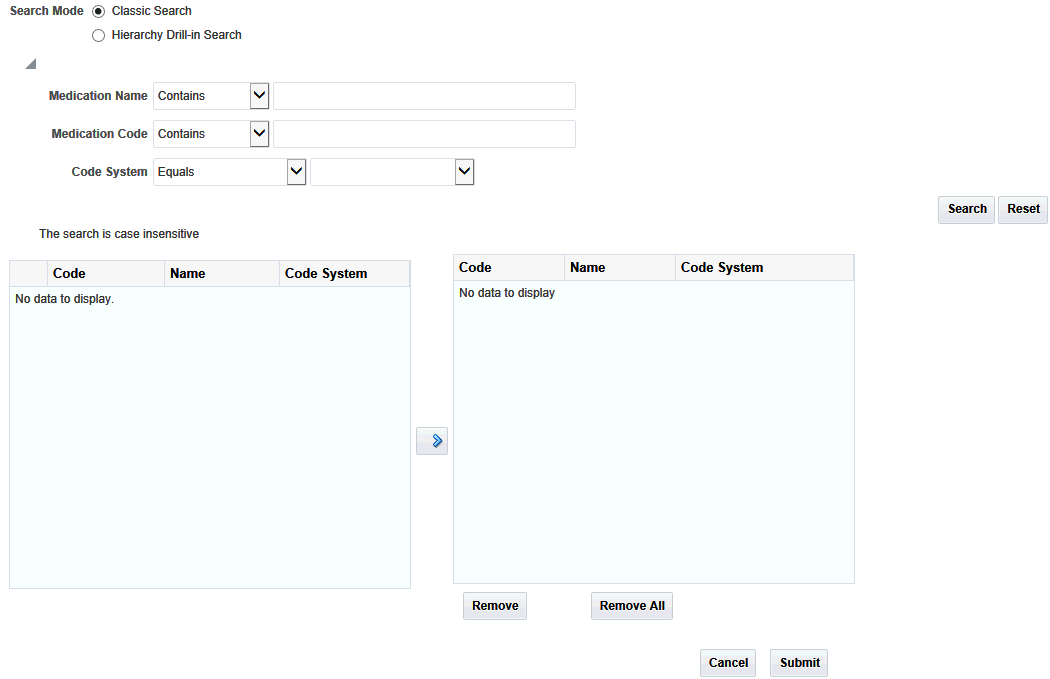
The Medication search menu supports the following two search modes:
Classic search lets you search for Medication codes based on medication name, medication code and code system. These parameters can be used with the following options:
-
Starts with
-
Ends with
-
Equals
-
Does not equal
-
Contains (this is the default value)
-
Does not contain
-
Is blank
-
Is not blank
To perform a search in classic mode:
-
Navigate to Cohort Query > Clinical Data > Medication.
-
Click the magnifying glass icon next to the Medication field.
-
Select Classic Search.
-
Specify the search criteria either by using the above parameters individually or in combination, along with the available operators.
-
Click Search.
-
The Code, Code Name and Code System of the matching codes are displayed on the left. Expand the list items to view details about code hierarchy and the Code Description.
If you have not specified any search criteria, then all codes at all levels of hierarchy from all the hierarchies are listed.
-
Select any number of rows on the left and copy them to the right hand side selection list using the > button.
-
Click Submit at the bottom of the screen. All the selected codes are used for defining query criteria in the Cohort Query.
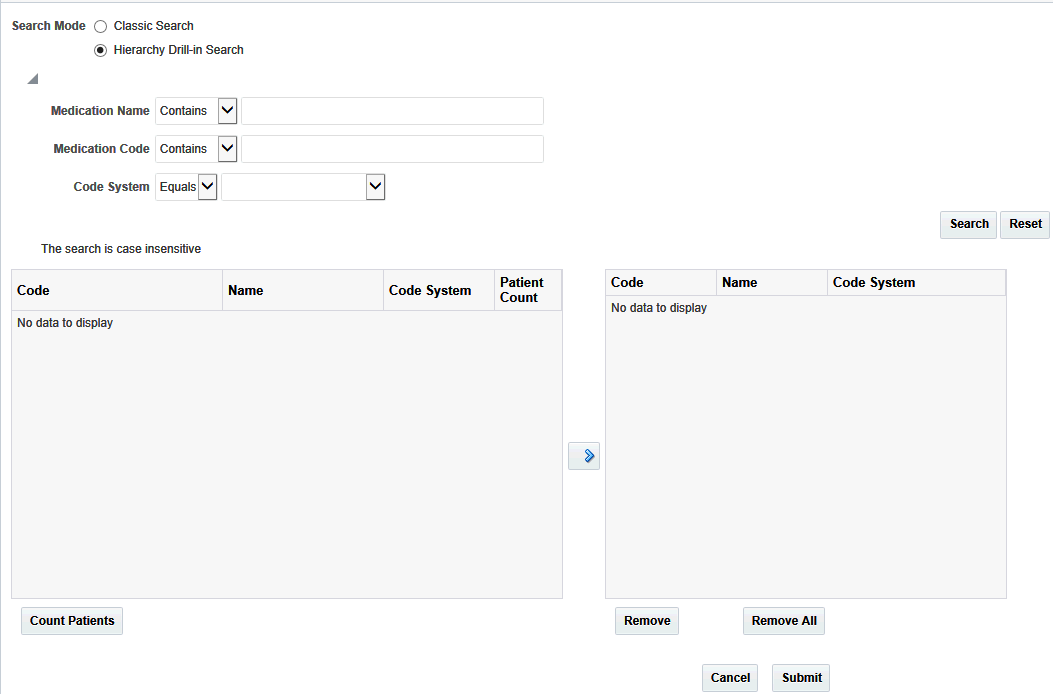
Hierarchy Drill-in search lets you search for Medication codes based on medication name, medication code and code system. These parameters can be used with the options:
-
Starts with
-
Equals
-
Contains (this is the default value)
-
Navigate to Cohort Query > Clinical Data > Medication.
-
Click the magnifying glass icon next to the Medication field.
-
Select Hierarchy Drill-in Search.
-
Specify the search criteria either by using the above parameters individually or in combination, along with the available operators.
The drop down list for Code System lets you select multiple Code Systems.
-
Click Search.
-
The matching codes are displayed on the left. The entire hierarchy in which the matching code is present, is listed as a hyperlink. Click the hyperlink to view an indented list where each child level code is displayed at one indent level more than its parent code.
If you have not specified any search criteria, then all the codes at all the levels of hierarchy, from all the hierarchies are listed.
Figure 3-9 Matching Codes from Hierarchy Drill-in Search
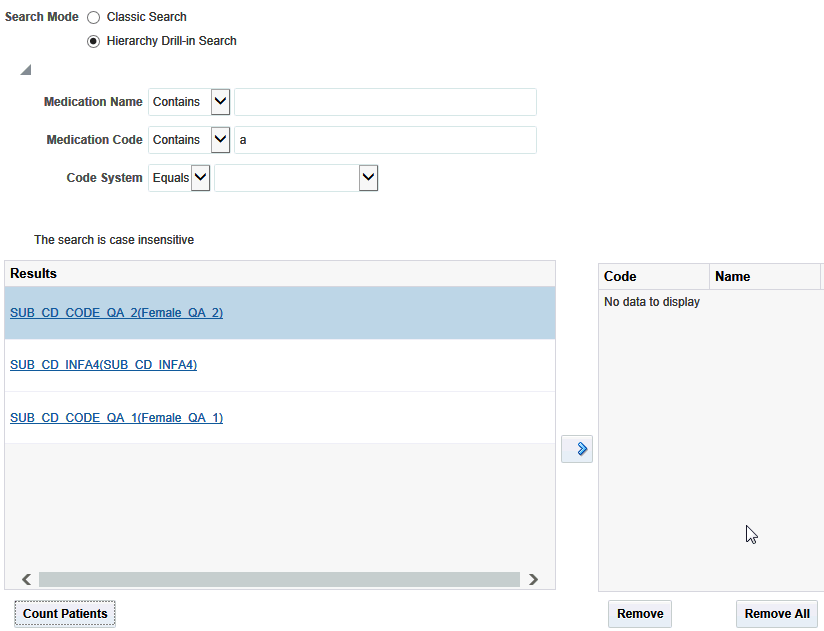
Description of ''Figure 3-9 Matching Codes from Hierarchy Drill-in Search''
-
To view the count of patients who were given the medication represented by the Code, select Code(s) and click Count Patients. The count is cumulative of the selected Code and all its child Codes.
For example, if Second Level Child Code is selected, then the count corresponds to the Patients who were given the Medication represented by Second Level Child Code or Medications represented by any of the children of the Second Level Child Code.
-
Select any number of rows on the left and copy them to the right hand side selection list using the > button.
-
Click Submit. All the selected codes are used for defining query criteria in the Cohort Query.
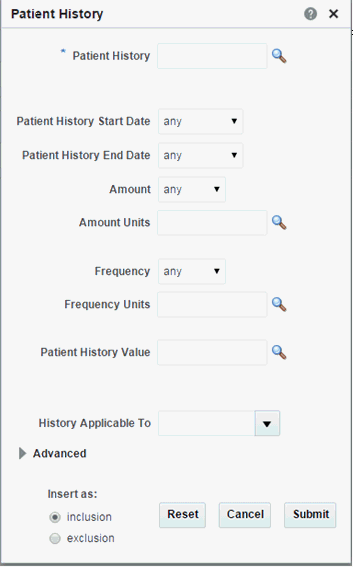
Patient History
Click the magnifying glass icon for Patient History to search either by Medication Code or Medication Name.
Note:
In the Patient History dialog, the History Type by default uses the Equals operator and lists the first 100 history types only. If there are more than 100 history type values in your data, you can search using other operators like "Starts with," "Contains," and so on.Table 3-8 Patient History Screen Fields
| Prompt Heading | Definition | Sample Value |
|---|---|---|
|
Patient History |
A coded representation of the Patient History |
Smoking, Obesity |
|
Patient History Start Date |
Date when this history was known to be active |
- |
|
Patient History End Date |
Date when this history is known to no longer be active |
- |
|
Amount |
Numerical value |
For example, 1 |
|
Amount Units |
Unit of Measure |
For example, mmHg |
|
Frequency |
Numerical Value |
For example, 12 |
|
Frequency Units |
Unit of Measure |
For example, TPDAY (times per day) |
|
Text Value or Code |
Value of history which is represented by text or coded. |
Yes, No, Frequently, Rarely |
|
History Applicable To |
For Familial History, this will contain type of blood relative, which may have a history value |
Father, Mother, Paternal grandmother, Paternal Grandfather |
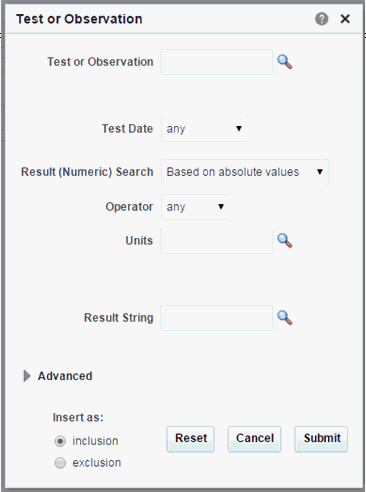
Test or Observation
Click the magnifying glass for Test or Observation to search either by Test or Observation Code, Test or Observation Name. The units will be filtered based on the selected Test or Observation.
Note:
In the Search Test or Observation dialog, the Test or Observation Type by default uses the Equals operator and lists the first 100 types only. If there are more than 100 Test or Observation type values in your data, you can search using other operators like "Starts with," "Contains," and so on.Table 3-9 Test or Observation Screen Fields
| Prompt Heading | Definition | Sample Value |
|---|---|---|
|
Test or Observation |
Any kind of medical intervention performed to aid in the diagnosis or detection of disease |
Blood Pressure |
|
Test Date |
The date the test was performed |
May-12-2012 |
|
Result (numeric) Search |
The Test result |
140, 90 |
|
Operator |
This search mode enables searching numeric results with UoMs based on reference range or absolute values. |
|
|
Units |
The Test units of measure |
mmHg |
|
Result String (text) |
Textual Test result, also Notes or remarks for the Test |
Positive/Negative |
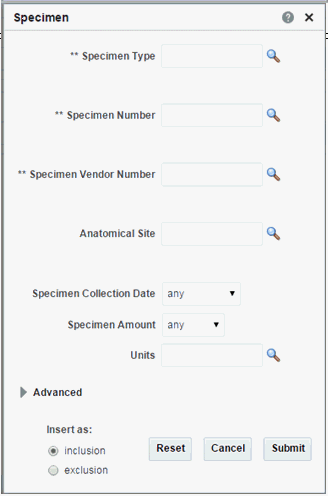
Specimen
Note:
The three fields of and Specimen Type, Specimen Number, Specimen Vendor are used in combination to search for particular data. Click the magnifying glass icon next to each field, to specify the appropriate criteria.Table 3-10 Specimen Screen Fields
| Prompt Heading | Definition | Sample Value |
|---|---|---|
|
Specimen Type Name |
A coded description for the type of Specimen. |
Blood, Urine, Sputum |
|
Specimen Number |
A unique identifier for a specimen. |
- |
|
Specimen Vendor Number |
A unique identifier for a source of the specimen, namely lab the specimen was analyzed. |
Harvard-CancerInstitute01, MIT-Whitehead-Lodish5 |
|
Anatomical Site |
The target site of the intervention. |
- |
|
Specimen Collection Date |
Date the specimen was collected. |
- |
|
Specimen Amount |
The amount of the specimen collected. |
- |
|
Units |
The units of measure for the specimen collected. |
Mg/dL, millimoles/liter |
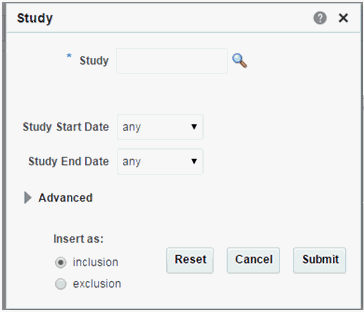
Study
Click the magnifying glass icon for Study, to search either by Study Code or Study Name.
Table 3-11 Study Screen Fields
| Prompt Heading | Definition | Sample Value |
|---|---|---|
|
Study (Name or Identifier) |
A reference to a particular study. |
NOT-A-STUDY (any genomic data that is not explicitly tied to study would be categorized there), Glioblastoma Study |
|
Study Start Date |
The start date for the study. |
- |
|
Study End Date |
The end date for the study. |
- |
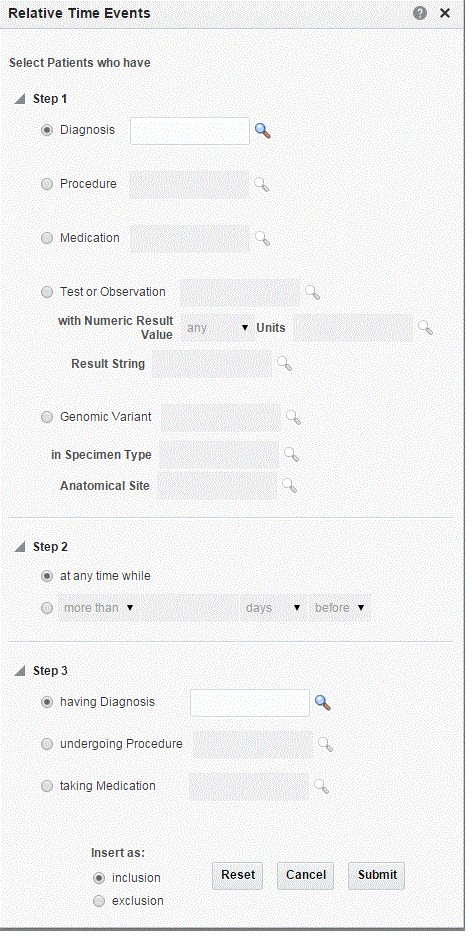
Relative Time Events
Frequently, the events that drive cohort or patient set searches are relevant to finding patients that may have certain event dependencies such as being diagnosed with a disease after taking a medication.
You can search for such patients based on relative time event dependencies. You can set this criteria and search for patients who have a history of one clinical (or genomic change) event relative to another.
In other words, you can specify a search for patients that took a certain medication or a set of medications within 30 days before being diagnosed with a specific disease. You can also search for patients who had a procedure performed on them two months after starting a medication.
To select relative time events:
-
Specify the event data to start your event.
-
Specify the relative time condition. This is how the events in Step 1 and Step 3 relate to each other.
-
Specify the related event to associate with the event in Step 1.
The search criteria is interpreted - Search for patients that experienced Event X at any time while, certain amount of time before or after Event Y. The idea is that X is the original event, Y is the associated event, and the time frame describes the time relationship between the two events, for the given patient.
The events listed for selection in Step 1 or Step 3 are present in Clinical or Genomics Data categories.
However, it is important to explain what the Relative time conditions are in Step 2 and how their meaning translates into SQL:
-
at any time while - the meaning of this relative time condition is to find any events that overlap with each other in terms of their occurrence. For example, if we have two distinct events with start and end dates, as long as at some point in time both events were true, this condition is satisfied.
Example 1:
Event in Step 1 - Started on May 1, 2010 - ended on June 29, 2011
Event in Step 3 - Started on June 10, 2011 - till present
The two events have overlap between June 10-29, 2011 thus the condition is satisfied.
Example 2:
Event in Step 1 - Started on Dec 1, 2010 - ended on Dec 12, 2011
Event in Step 3 - was performed on August 3, 2011
The two events have overlap on August 3, 2011 thus the condition is satisfied.
Example 3:
Event in Step 1 - Started on May 1, 2010 - ended on June 29, 2011
Event in Step 3 - Started on June 10, 2009 - till present
The two events have overlap between May 1, 2010 and June 29, 2011 thus the condition is satisfied.
The dates used for time comparing each event type are as follows:
-
Diagnosis: Reported Date - End Date (if null, use present date)
-
Procedure: Start Date - End Date (if null, use present date)
-
Medication: Start Date - End Date (if null, use present date)
-
Test or Observation: Test Date (single day event only)
-
Gene Variant: Specimen Collection Date for end date use present date
-
-
(more than / less than / exactly) [ ] (days / weeks / months / years) (before / after) - the meaning of this relative time condition is to find any events that have start or occurrence dates that relate to each other with the time period specified by the condition.
Examples:
Start date of Event in Step 1 is more than 5 weeks before Start date of Event in Step 3
Occurrence, for example, Test Date of Test or Observation in Step 1 is less than 1 month before Start Date of Medication in Step 3
Gene Variant Specimen Collection Date in Step 1 is exactly 1 day after Procedure Start Date in Step 3
The dates used for time comparing each event type are as follows:
-
Diagnosis: Reported Date
-
Procedure: Start Date
-
Medication: Start Date
-
Test or Observation: Test Date
-
Gene Variant: Specimen Collection Date
-
Genomic Data
Microarray Expression
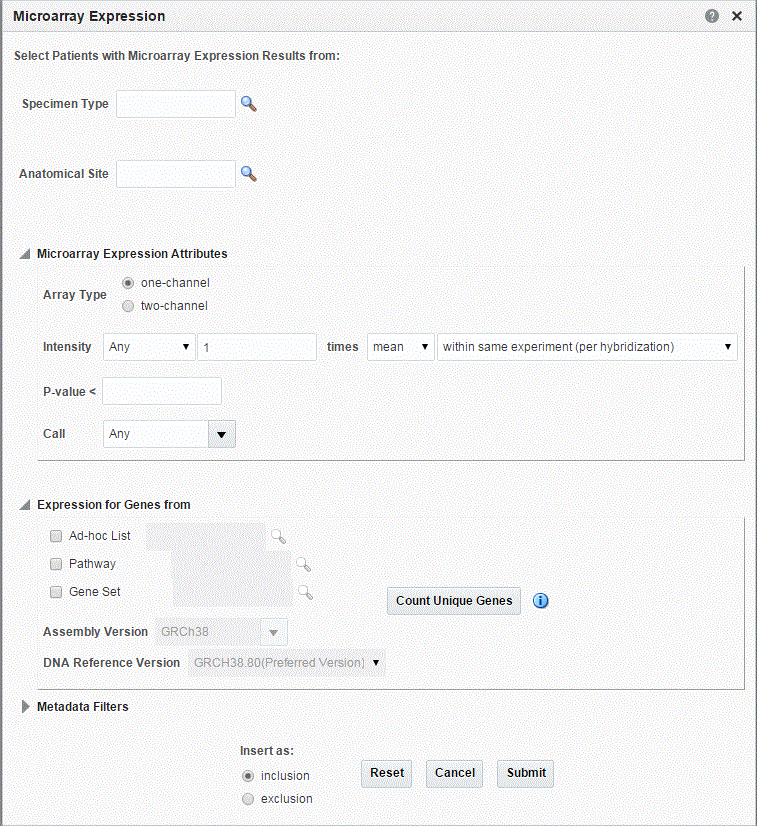
Microarray expression is one of the growing set of genomic criteria that can be used to stratify patients. The genomic data driving this filter comes from the Oracle Healthcare Omics (OHO, formerly known as ODB) model, specifically the W_EHA_RSLT_GENE_EXPR table and related tables. Gene expression data is associated with patients through the specimen used for genomic study analyses collected during study participation or other genomic testing.
The upper section of the criteria gives you the choice to specify Specimen Type and Anatomical site to further filter the results.
In the popup for Gene Expression, you are given two options (Array data types to choose from). For each option, you must specify the criteria when selecting patients based on their gene expression data.
-
One-channel – Single channel data can be filtered based on the following data fields:
-
On Intensity; as a cutoff based on aggregates or on values, and across an experiment or multiple ones.
-
P-value; as a cutoff on values.
-
Call; on any of the three call types.
-
-
Two-channel – Here data can be filtered on the following data field:
-
Log2Ratio – as a cutoff on values
-
In Expression for Genes From, select at least one unique gene from any of the three specified sources:
-
Ad-hoc list
-
Pathway
-
Gene Set
Click the magnifying glass icon for Specimen Type, to search either by Specimen Name or Specimen Code. This also applies to the other search criteria. Criteria identified with * are required.
Table 3-12 Microarray Expression Screen Fields
| Prompt Heading | Definition | Sample Value |
|---|---|---|
|
Specimen Type |
The specimen type description that identifies the specimen used for genomic tests. |
Normal sample, tumor sample. |
|
Anatomical Site |
Anatomical site name or code corresponding to the specimen collected. |
Left lung, kidney, small intestine |
|
Intensity |
This and the following two fields are specific to Single Channel data. This field is a Gene expression value range specification. Data driving this selection is in the W_EHA_RSLT_GENE_EXP table in OHO and is generally expected to be normalized now to take full advantage of this criteria selection. Additionally, the data values should all be positive. The criteria conditions allow you to narrow down patients based on up-regulated gene expression (using greater than 1.0 times mean condition either across columns (same hybridization) or rows (single result file) of the data in the particular experiment. |
Down regulated gene in hybridization example - Intensity is less than 2.0 times mean in the gene expression within a particular hybridization. |
|
P-value |
Significance value associated with the specific experiment, optional. |
P-value < 0.00001 |
|
Call |
Call made on the particular value, if present. All are taken unless specified. Optional. |
P - Present, A - Absent, M - Marginal |
|
Log2Ratio |
Specific to dual channel differential gene expression relating the difference between, for example, control sample and the tested sample intensity. Data for this selection in found in the W_EHA_RSLT_2CHANNEL_GXP table. |
Float type integer representing a log base 2integer value of a fraction. |
|
Expression for genes from* |
Selection of genes that are to be used for patient stratification based on the expression. At least one of the below criteria must be specified. |
N/A |
|
Ad-hoc List: Gene |
List of one or more genes. |
- |
|
Pathway |
Reference to a pathway stored on the reference side of the Oracle Healthcare Omics (OHO, formerly known as ODB) model. This in turn corresponds to a list of genes that are to be used to compare their Intensity values. |
- |
|
Gene Set |
User-defined collection of genes that you can reference across any UI instead of having to build ad-hoc lists of genes each time. |
MyGeneSet1, GlioblastomaSmithLabGenes |
|
Assembly Version |
Represents GRCh assembly version. Default selection is last loaded version. |
GRCh38 or GRCh37 |
|
DNA Reference Version |
Represents the Ensembl reference version for getting gene annotations. This is related to 'Assembly Version' and by default it shows the preferred DNA Reference Version which is set in OHO. |
Ensembl release 70 |
For Metadata Filter details for Microarray Expression, see Metadata Filters.
Sequence Variants
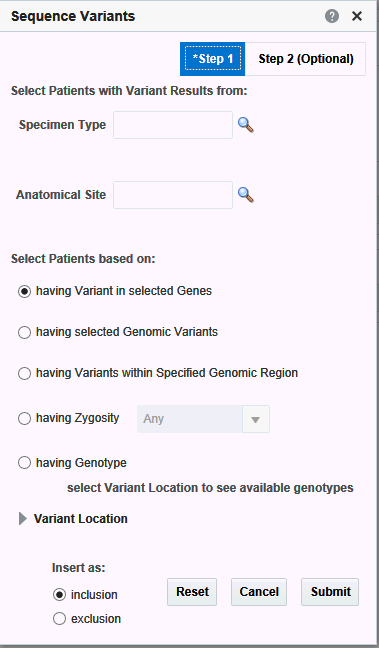
The Variants Criteria Selection interface falls under the category of Genomic criteria and enable the user to query for patients based on results present in the W_EHA_RSLT_SEQUENCING and related tables in the Oracle Healthcare Omics (OHO, formerly known as ODB) model.
In the Sequence Variant screen, you have the option to select Specimen Type and Anatomical site for associating the selected variant criteria in this screen. Currently, the following 5 main options are available for searching:
-
having Variants in selected Genes: this enables you to search variants in specific genes.
-
having selected Genomic Variants : this enables you to search for specific known variants by their Cosmic or dbSNP identifiers.
-
having Variants within specified Genomic Region: this enables you to search variants in specified genomic location like chr1:19094593-29302393 or whole of chr1.
-
having Zygosity: this enables you to search variants with specific zygosity.
-
having Genotypes: this enables you to search for specific genotypes like AT, or AA, or wildtype (same as reference), and so on.
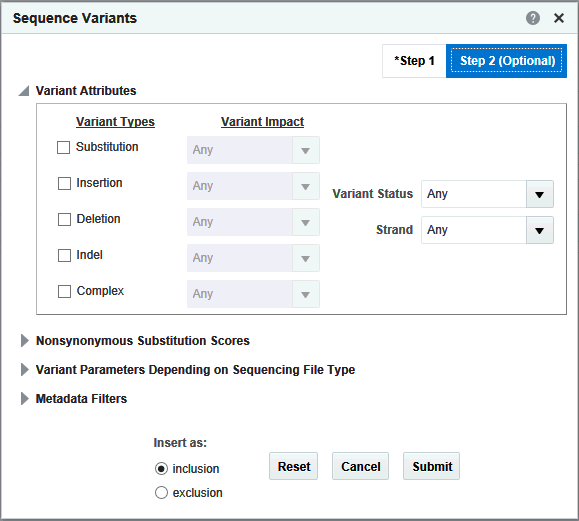
Additionally there are other parameter, attributes and metrics associated with variants that you can use for further filtering on specific variants. These options are:
-
Specifying variants by their attributes.
-
Specifying variants by their non-synonymous substitution scores
-
Specifying quality metrics filters depending on the sequencing file type like VCF, MAF and CGI masterVar.
The filtering options have been categorized into 2 steps. Step 1 as shown in Figure 3-16 has all mandatory filter options for creating a query. Step 2 shown in Figure 3-17 has the optional filters.
Table 3-13 Variants Screen Fields
| Field Name | Definition | Sample Value |
|---|---|---|
|
Specimen Type, Anatomical Site |
For more information on Microarray Expression, refer to description under Microarray Expression section. |
As in Microarray Expression section. |
|
Having Variants in selected Genes |
Variant mode selection - being able to specify variants in specified genes |
N/A |
|
Having selected Genomic Variants |
Variant mode selection - being able to specify known variants by their identifier. At least one mode of variant specification must be given. |
N/A |
|
having Variants within Specified Genomic Region |
Variant mode selection - being able to specify variants in a specific genomic location like chr1:1234324-3434333, chr7:1000, chr3 or chr2:1000+200 |
N/A |
|
Genomic Variant ID |
Specify known gene variant reference identifiers such as dbSNP or Cosmic. Allows for selecting multiple values. Assembly Version helps specify variants in a selected assembly version. Enables multiple selection, except for 'having Genotype' option where only single selection is allowed. |
rs56289060, 905944 |
|
DNA Reference Assembly Version |
Helps specify variants in a selected reference assembly version. Allows multiple selection, except for having Genotype option where only single selection is allowed. |
GRCh37 |
|
DNA Reference Version |
Represents the Ensembl reference version for getting gene annotations. This is related to 'Assembly Version' and by default displays the preferred DNA Reference Version, which is set in Oracle Healthcare Omics (OHO, formerly known as ODB). |
Ensembl release 70 |
|
At Genomic Position |
Helps specify a genomic region in which variants has to be searched. |
chr7, chr7:1000, chr3:1000-2000, chr2:1000+200 |
|
Genotype |
List available genotype values for the selected genomic position or genomic variant based on the position. Also displays wildtype base (same as reference base). User can select a combination of two genotypes to search or just one genotype and search for patients with these selected genotypes. |
N/A |
|
Additional Variant Information (Optional) are used in the context of either of the radio buttons selection above |
Additional criteria used to filter down variants based on variant type and variant impact features. |
N/A |
|
Variant Type and corresponding Variant Impact |
You can select any of the variant types supported along with additional variant metadata such as each variant type's impact on the resulting protein. Note: Not all Variant Impact annotations apply to each Variant Type. |
Variant Type: Substitution, Insertion, Deletion, Indel, Complex Variant Impact: Synonymous, Missense, Nonsense, Unknown, |
|
Variant Status |
Specifies which variant types to consider - whether the variant should be known or novel. Default considers all variants. |
Known, Novel |
|
Strand |
Gene transcription direction attribute. By default, all directions of transcription are included. |
+ means forward, - means reverse |
|
Ad-hoc List: Gene; Pathway; Gene Set |
For more information on Microarray Expression, refer to description under Microarray Expression section. |
As in Microarray Expression section. |
|
At Genomic Position |
Specify genomic location for the variants to occur in, the format should be chr#:from-to or chr# if entire chromosome to be used. |
chrX:13000-120000, chr7 |
|
Non-synonymous Substitution Scores |
Data for this section is loaded into the reference side of the OHO model from Ensembl based on either PolyPhen algorithm or SIFT algorithm. The prediction value can be specified numerically or alternatively can be specified using PolyPhen or SIFT specific annotation. Note: SIFT or PolyPhen predictions are only available for Known variants |
With PolyPhen, prediction between 0 and 1 or labeled as benign, Probably Damaging, possibly damaging and unknown With SIFT, prediction between 0 and 1 or labeled as Deleterious and tolerated |
|
Variant Parameters Depending on Sequencing File Type |
User can select to specify more detailed filtering criteria based on data coming from 3 different sequencing file formats such as VCF, MAF, CGI masterVar. As each input file formats uses different metadata to describe stored entities, depending on the sequencing input format selection, the user can elect to specify: VCF: Variant Call Format, Format.GQ range - user can specify upper or lower numeric values for this parameter MAF: Mutation Annotation Format, Score - user can specify upper or lower numeric values for this parameter Somatic Status Somatic Score Allele Read Count Reference Read Count Total Read Count RMS Base Quality RMS Mapping Quality AD/DP Ratio CGI masterVar: Complete Genomics masterVariation format. The available fields to search by are
|
See appropriate file formats documentation for appropriate value ranges (VCF 4.2 format, MAF 2.0-2.2 format, Complete Genomics masterVar format). For example, Allele Zygosity for CG masterVar includes het-alt, hom, half, het-ref options. |
For Metadata Filter details for Microarray Expression, see Metadata Filters.
At Genomic Position
You can opt to specify genomic data selection using genomic co-ordinates. You specify the chromosome region in a standard format for the Variation and CNV data. You can specify a complete chromosome or part of a chromosome as criteria. Currently, only one chromosome region at a time is implemented for search.
The following chromosome region formats are supported.
-
CHR15:10000-200000: Considers region between 10000 to 200000 in chromosome 15.
-
CHR15:1,200,000+5000 - Considers 5000 bases upstream from 1,200,000 position in chromosome 15.
-
CHR15 - Considers whole of the chromosome 15.
-
CHR15:1000 - Considers 1000th nucleotide position of chromosome 15.
Copy Number Variation
The Copy Number Variation criteria selection interface falls under the category of Genomic criteria where you can query for patients based on results present in the W_EHA_RSLT_COPY_NBR_VAR table and related tables in the Oracle Healthcare Omics (OHO, formerly known as ODB) model. Currently, this table contains data from two formats—from Complete Genomics and SEG and VCF files with CNV data. Both of these have log2 ratio stored in OHO.
For CNV, you can optionally select specimen type and anatomical site.
Next select CNV Result Type, which represents data from numeric (array based) and categorized sequencing based platform.
You can then filter results based on the list of Copy Number Variation Attributes. For example, for numeric based CNV Result Type, SNP log2 Ratio and for categorized based, gain, loss, equal to indicate Amplification, Deletion or no change in the copy number of a given gene or gene region.
Finally, you should specify the location of Copy Number Variation which is the gene or genomic position of interest.
Figure 3-18 Copy Number Variation - Numeric Based
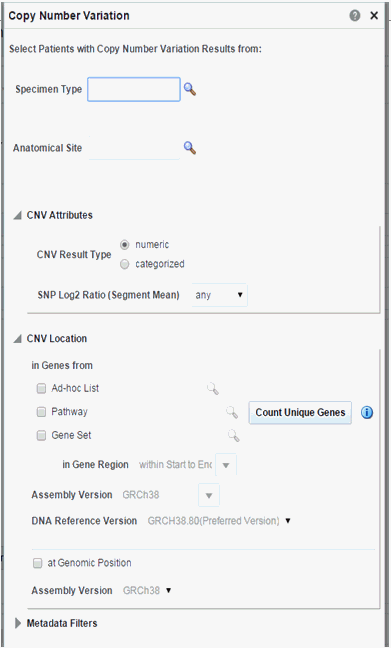
Description of ''Figure 3-18 Copy Number Variation - Numeric Based''
Figure 3-19 Copy Number Variation - Categorized Based
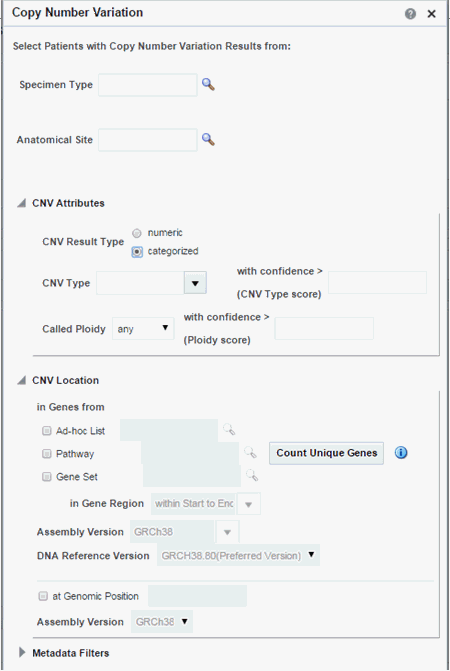
Description of ''Figure 3-19 Copy Number Variation - Categorized Based''
Table 3-14 Copy Number Variation
| Prompt Heading | Definition | Sample Value or Values |
|---|---|---|
|
Study*, Specimen Type, Anatomical Site |
For more information on Microarray Expression, refer to description under Microarray Expression section. |
As in Microarray Expression section. |
|
CNV Result Type |
Search CNV results either belonging to array based platform like Genome_Wide_SNP_6 array or sequencing based CNV data from complete Genomics. |
Array based or sequencing based |
|
SNP Log2 Ratio (Segment Mean) |
Values for segment mean in the form of a range. You can also specify a single value in Log2 Ratio and search for results with segment mean greater than the specified value. |
Numeric value. It can accept negative values. |
|
CNV Type |
Copy Number Variation attribute indicating whether it is an amplification - gain, deletion - loss, or no change - equal. |
Gain, Loss, Equal |
|
With confidence > (CNV Type score) |
Copy number variation confidence score associated with CNV Type. Score is populated from the source file, and depending on the scoring method, the range can vary. |
Numeric value, range can vary depending on source |
|
Called Ploidy |
Values for ploidy can be given more specifically as a range, either upper and/or lower bound can be specified. For example, for duplication, called ploidy can be specified as 2. |
Range of Ploidy to be selecting based on, e.g. for duplication, it can be specified as between 1.5 and 2.5 |
|
With confidence > (Ploidy score) |
Confidence score associated with Called Ploidy. Score is populated from the source file, and depending on the scoring method, the range can vary. The higher the confidence, the more confidence is that the ploidy score is correct, lower range can be specified |
Numeric value, range can vary depending on source. |
|
CNV Location: in Genes from* |
Selection of genes that are to be used for patient stratification based on Copy Number Variation. At least one of the below criteria must be specified. |
N/A |
|
Ad-hoc List: Gene; Pathway; Gene Set |
For more information on Microarray Expression, refer to description under Microarray Expression section. |
As in Microarray Expression section. |
|
At Genomic Position |
Specify genomic location for the variants to occur in: the format should be chr#:from-to or chr# if the entire chromosome is to be used. |
chrX:13000-120000, chr7 |
|
Assembly Version |
Represents GRCh version. Default selection is the last loaded reference version. |
GRCh38 |
|
DNA Reference Version |
Represents the Ensembl reference version for getting gene annotations. This is related to Assembly Version and by default displays the preferred DNA Reference Version, which is set in OHO. |
Ensembl version 70 |
For Metadata Filter details for Microarray Expression, see Metadata Filters.
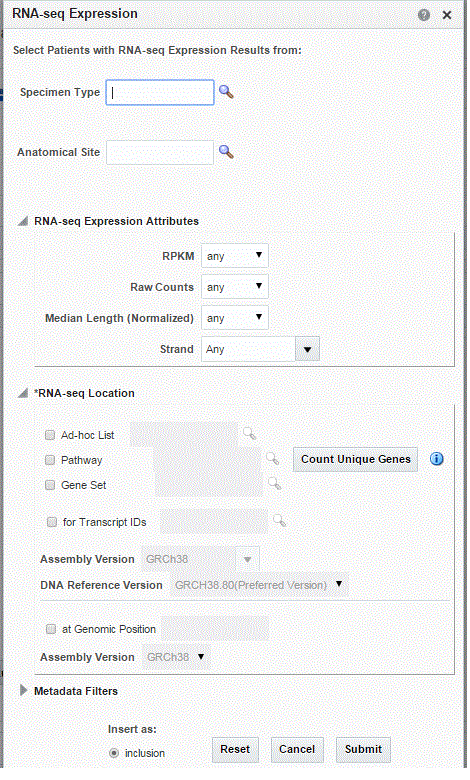
RNA-seq Expression
The RNA-seq Expression criteria selection interface falls under the category of Genomic criteria where you can query for patients based on results present in the W_EHA_RSLT_RNA_SEQ table and related tables in the OHO model.
As for Gene Expression, you can optionally select specimen type and anatomical site. Next, you can filter results based on the RPKM values, Raw Counts, Median length and strand.
Finally, you should specify the location for searching RNA-seq expression results which is the gene or genomic position of interest.
| Prompt Heading | Definition | Sample Value or Values |
|---|---|---|
|
Specimen Type, Anatomical Site |
For more information on RNA-seq Expression, refer to description under Microarray Expression section. |
As in Microarray Expression section. |
|
RPKM |
Represents 'Reads Per Kilobaseq exon Model per million mapped reads', calculated expression intensity values in positive float or zero. |
N/A |
|
Raw Counts |
Represents raw read counts in positive floating point values or a zero if unavailable. |
N/A |
|
Median Length (Normalized) |
A normalized region length calculation in positive float or zero. |
N/A |
|
Strand |
Strand of stored gene. |
N/A |
|
RNA-seq Location: in Genes from* |
Selection of genes that are to be used for patient stratification based on RNA-seq expression. At least one of the below criteria must be specified. |
N/A |
|
Ad-hoc List: Gene; Pathway; Gene Set |
For more information on RNA-seq Expression, refer to description under Gene Expression section. |
As in Microarray Expression section. |
|
For Transcript IDs |
Search for Ensembl Transcript ID |
N/A |
|
At Genomic Position |
Specify genomic location for the variants to occur in, the format should be chr#:from-to or chr# if entire chromosome is to be used. |
chrX:13000-120000, chr7 |
|
Assembly Version |
Represents GRCh version. Default selection is the last loaded reference version. |
GRCh38 |
|
DNA Reference Version |
Represents the Ensembl reference version for getting gene annotations. This is related to Assembly Version and by default displays the preferred DNA Reference Version, which is set in OHO. |
Ensembl version 70 |
Metadata Filters
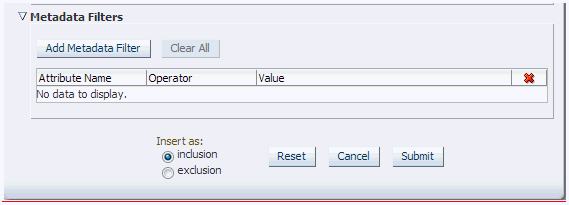
All genomic criteria screens like Sequence Variant, Copy Number Variation, Microarray Expression and RNA-seq Expression have additional filter criteria based on the metadata associated with the specimens or patients. This option is present at the bottom of each of the genomic criteria screens.
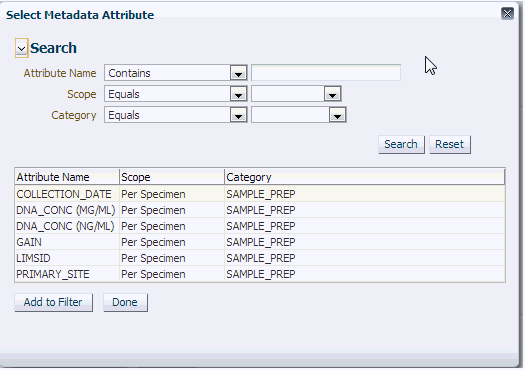
Once you expand the Metadata Filters option, click Add Metadata Attribute to open the Select Metadata Attribute dialog.
Then search based on Attribute Name, Scope or Category to get a list of attributes associated with Metadata. Select attribute to add as Metadata Filter and assign a value for the added filer.
| Prompt Heading | Definition | Sample Value or Values |
|---|---|---|
|
Attribute Name |
Represents the metadata qualifier tag from W_EHA_QUALIFIER table. |
N/A |
|
Scope |
Scope is retrieved from the table W_EHA_QLFR_TABLE. Based on the internal mapping scope is shown as 'Per Result' for value in table as 'W_EHA_RSLT_FILE_SPEC_QLFR' and 'Per Specimen' as scope value for value in table as 'W_EHA_RSLT_SPEC_QLFR'. |
N/A |
|
Category |
Represents the metadata qualifier category tag from W_EHA_QLFR_CATEGORY table. |
N/A |
|
Value |
Based on the selected metadata attribute this value datatype would change. If a numeric attribute is selected then a numeric value is given as input. Similarly, for date attribute, date would be as input and for character attribute, character would be as input. |
N/A |
Selecting Cohort Criteria
To select cohort criteria:
-
Navigate the Cohort Query tab.
-
On the left, select Patient Information, Clinical Data or Genomic Data to view the topics within each. For more information on the topics within each category, see Categories and Topics.
Note:
You can select criteria within any one or all the three categories. -
Click the topic that aligns with the data you want to select.
-
Select the required data. Required fields in a topic are identified with an asterisk. For example, you are required to indicate one or more Diagnoses for a patient along with a date, onset, or other parameters.
Click the magnifying glass icon to search for data for a given field.
-
In the Insert as group, select inclusion or exclusion to confirm whether the definition is to be included or excluded in the query.
Tip:
Prepare the query definition in a structured format (line-by-line) before creating it in OHTR. Visualizing your definition may help you recognize a simple way to organize it. -
Click Submit.
To clear all the fields, click Reset. To close the window without making any selection, click Cancel.
-
The criteria you selected appears in its query statement on the right side of the page.
You can add as many criteria as you want. The query definition expands each time you add a new statement.
Working with Inclusion and Exclusion Criteria
Once you have added several criteria statements to your query, you can:
-
expand or collapse the display for the Inclusions or Exclusions criteria
-
select the arrow to the left of the criteria statement to expand or collapse its detail
Modifying Details of an Existing Criteria Statement
You can continue to adjust the details of an existing statement using the icons on the right.
-
The pencil icon displays and edits your criteria selection.
-
The red X removes any particular statement.
-
The green + icon adds another set of criteria from the same topic. For example, clicking the plus icon from within a Demographics tab prompts you to select additional Demographics criteria.
Logic within Inclusion and Exclusion Criteria
Within an Inclusion statement, distinct criteria statements related to the same topic is considered with an OR criteria.
For example,
INCLUDE: Diagnosis = Diabetes AND (Demographics = Male OR” Demographics = Married)
Within an Exclusion statement, distinct criteria statements related to the same topic will be considered with an AND.
For example,
EXCLUDE: Diagnosis = Diabetes OR (Demographics = Male AND Demographics = Married)
This function can be used to simplify your query structure, where you can address each data topic and category one at a time rather than having the same topic listed in both the Inclusion and Exclusion sections.
Viewing Patient Count and Patient Data
Based on the Cohort Criteria, the corresponding Patient or Subject Count is displayed. Total number of patients or subjects in the database is also displayed. This count is updated or refreshed each time you log into the system and select the Query Patients tab.
To run a query and view the counts:
-
Select at least one row of criteria defined in the Inclusions or Exclusions options.
-
Click Run Query. The patient count is visible in the top right.
-
To view patient data, click the patient count.
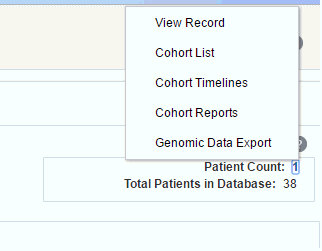
Description of the illustration ''trc125.gif''
Viewing Specimen Count
To view the specimen count:
-
Click the Options drop-down menu in the Cohort Query tab.
-
Select Show Specimen Count.
-
The specimen count is displayed. This is the count of all the specimens in the cohort that match the selected criteria.
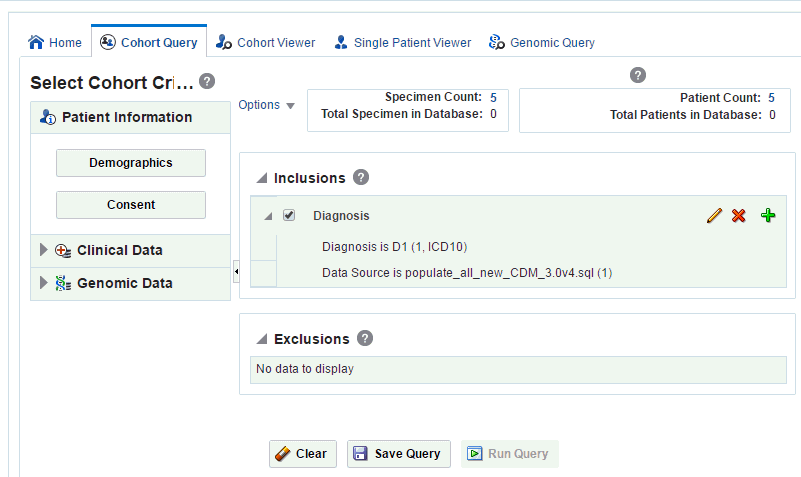
Description of the illustration ''trc117.gif''
Saving a Query
When you save a query, the only information that is preserved is the criteria definition itself. Neither the patient count nor any of the underlying patient data is saved. Each time the query is opened, it must rerun to view current patient counts. Therefore, patient counts for the same query may change over time.
Each query is saved along with the context it was generated against and hence any criteria not relevant to that context is not saved.
To save a query:
-
Click the Query Library drop-down.
-
Click Save Query.
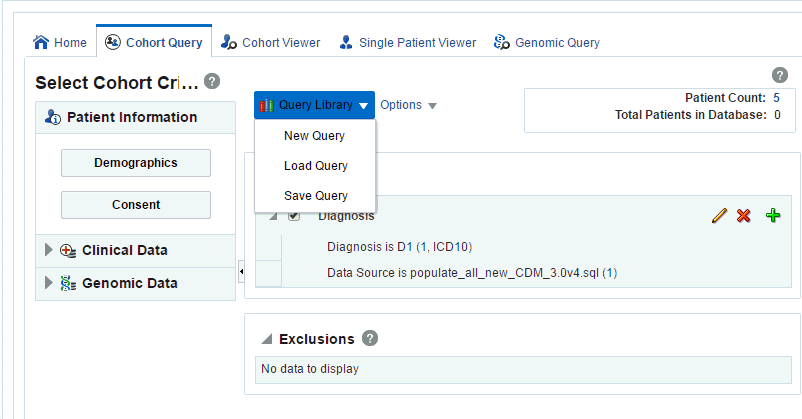
Description of the illustration ''trc118.gif''
-
You can save it as a new query (with a new name), or overwrite an existing query from the library.
If you enter a new query name and that name is already recognized in your library, the system prompts you to determine if you want to overwrite your existing query. If not, you can specify a new query name.
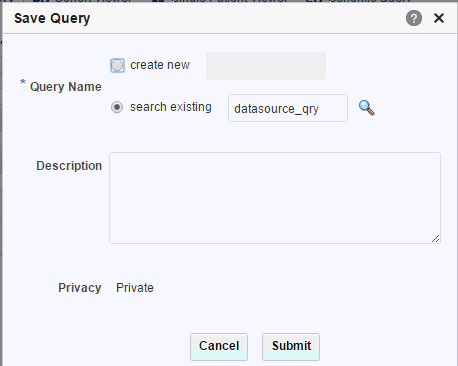
Description of the illustration ''trc26.gif''
-
Click Submit. A confirmation is displayed that the query was saved.
Loading a Saved Query
To rerun a query and edit its definition, perform the following steps:
-
Click the Query Library drop-down.

Description of the illustration ''trc118.gif''
-
Select Load Query.
-
Enter all or part of a Query Name.
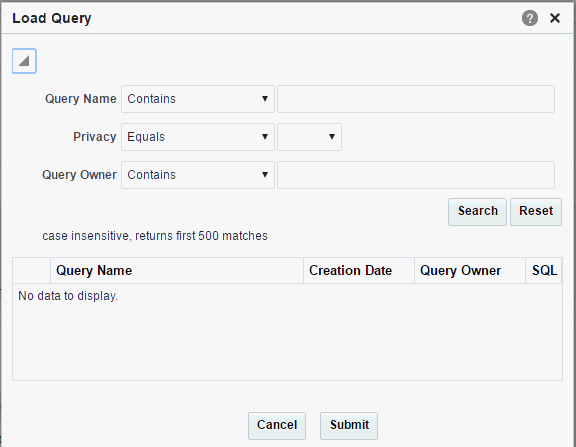
Description of the illustration ''trc119.gif''
-
Click Search.
-
Select the required query.
-
Click Submit. The query definition is displayed on the main page.
