5 Using the Oracle Dynamic Monitoring Service
This chapter provides an overview and features available in the Oracle Dynamic Monitoring Service (DMS).
5.1 About Dynamic Monitoring Service (DMS)
The Oracle Dynamic Monitoring Service (DMS) enables Oracle Fusion Middleware components to provide administration tools, such as Oracle Enterprise Manager, with data regarding the component's performance, state and on-going behavior. Fusion Middleware components push data to DMS and in turn DMS publishes that data through a range of different components. DMS measures and reports metrics, trace events and system performance and provides a context correlation service for these components.
5.1.1 Understanding Common DMS Terms and Concepts
This section defines common DMS terms and concepts related to the following:
5.1.1.1 DMS Sensors
DMS sensors measure performance data and enable DMS to define and collect a set of metrics. Certain metrics are always included with a sensor and other metrics are optionally included with a sensor.
DMS has three different kinds of sensors:
5.1.1.1.1 DMS PhaseEvent Sensors
A DMS PhaseEvent sensor measures the time spent in a specific section of code that has a beginning and an end. Use a PhaseEvent sensor to track time in a method or in a block of code.
DMS can calculate optional metrics associated with a PhaseEvent, including the average, maximum, and minimum time that is spent in the PhaseEvent sensor.
Table 5-1 lists the metrics available with PhaseEvent sensors.
Table 5-1 DMS PhaseEvent Sensor Metrics
| Metric | Description |
|---|---|
|
|
Specifies the total time spent in the phase Default metric: |
|
|
Specifies the number of times the phase Optional metric |
|
|
Specifies the minimum time spent in the phase Optional metric |
|
|
Specifies the maximum time spent in the phase Optional metric |
|
|
Specifies the average time spent in the phase Optional metric |
|
|
Specifies the number of threads in the phase Optional metric |
|
|
Specifies the maximum number of concurrent threads in the phase Optional metric |
5.1.1.1.2 DMS Event Sensors
A DMS event sensor counts system events. Use a DMS event sensor to track system events that have a short duration, or where the duration of the event is not of interest but the occurrence of the event is of interest.
Table 5-2 describes the metric that is associated with an event sensor.
Table 5-2 DMS Event Sensor Metrics
| Metric | Description |
|---|---|
|
|
Specifies the number of times the event has occurred since the process started, where Default: |
5.1.1.1.3 DMS State Sensors
A DMS state sensor tracks the value of Java primitives or the content of a Java object. Supported types include integer, double, long, and object. Use a state sensor when you want to track system status information or when you need a metric that is not associated with an event. For example, use state sensors to track queue lengths, pool sizes, buffer sizes, or host names. You assign a precomputed value to a state sensor.
Table 5-3 describes the state sensor metrics. State sensors support a default metric value, as well as optional metrics. The optional minValue and maxValue metrics only apply for state sensors if the state sensor represents a numeric Java primitive (of type integer, double, or long).
Table 5-3 DMS State Sensor Metrics
| Metric | Description |
|---|---|
|
|
Specifies the metric value for Default: |
|
|
Specifies the number of times Optional metric |
|
|
Specifies the minimum value for Optional metric |
|
|
Specifies the maximum value this Optional metric |
5.1.1.1.4 Sensor Naming Conventions
The following list describes DMS sensor naming conventions:
-
Sensor names should be descriptive, but not redundant. Sensor names should not contain any part of the noun name hierarchy, or type, as this is redundant.
-
Sensor names should avoid containing the value for the individual metrics.
-
Where multiple words are required to describe a sensor, the first word should start with a lowercase letter, and the following words should start with uppercase letters. Example:
computeSeries -
In general, avoid using a "
/" character in a sensor name. However, there are cases where it makes sense to use a name that contains "/". If a "/" is used in a noun or sensor name, then when you use the sensor in a string with DMS methods, you need to use an alternative delimiter, such as "," or "_", which does not appear anywhere in the path; this enables the "/" to be properly understood as part of the noun or sensor name rather than as a delimiter.For example, a child noun can have a name such as:
examples/jsp/num/numguess.jsp
and you can look this up using the string:
,default,WEBs,defaultWebApp,JSPs,example/jsp/num/numguess.jsp,service
where the delimiter is the "," character.
-
Event sensor and PhaseEvent sensor names should have the form verbnoun. Examples:
activateInstanceandrunMethod. When a PhaseEvent monitors a function, method, or code block, it should be named to reflect the task performed as clearly as possible. -
The name of a state sensor should be a noun, possibly preceded by an adjective, which describes the semantics of the value which is tracked with this state sensor. Examples:
lastComputed,totalMemory,port,availableThreads, activeInstances -
To avoid confusion, do not name sensors with strings such as ".time", ".value", or ".avg", which are names of sensor metrics, as shown in Table 5-1, Table 5-2, and Table 5-3.
5.1.1.2 DMS Nouns
DMS nouns organize performance data. Sensors, with their associated metrics, are organized in an hierarchy according to nouns. Nouns enable you to organize DMS metrics in a manner comparable to a directory structure in a file system. For example, nouns can represent classes, methods, objects, queues, connections, applications, databases, or other objects that you want to measure.
A noun type is the attribute that identifies the noun's type. Nouns that represent similar types of entities will typically have the same noun type and will usually record a common set of measurements for each of those entities.
5.1.1.2.1 General DMS Naming
A noun name is a simple string, not including a delimiter. For example, BasicBinomial is a noun name. A noun full name consists of the noun name with the namespace and localpart. The noun name is preceded by the full name of its parent, and a delimiter. /dmsDemo/BasicBinomial/"{http://mynamespace/}JAXWSHelloService" is a noun full name.
A sensor name is a simple string, not including the "." or the derivation. For example, computeSeries, loops, and lastComputed are sensor names.
A sensor full name consists of the sensor name, preceded by the name of its associated noun, and a delimiter. Examples: /dmsDemo/BasicBinomial/computeSeries, /dmsDemo/BasicBinomial/loops, /dmsDemo/BasicBinomial/lastComputed.
A DMS metric name consists of a sensor name plus the "." character plus the metric. For example, computeSeries.time, loops.count, and lastComputed.value are valid DMS metric names.
Note:
The suffixes.time, .count, and .value are immutable. Sensor and noun names, however, can be modified as needed.5.1.1.2.2 General DMS Naming Conventions and Character Sets
DMS names should be as compact as possible. When you define noun and sensor names, avoid special characters such as white space, slashes, periods, parenthesis, commas, and control characters.
Table 5-4 shows DMS replacement for special characters in names.
Table 5-4 Replacement for Special Characters in DMS Names
| Character | DMS Replacement Character |
|---|---|
|
Space character |
Underscore character: |
|
Period character: |
Underscore character: |
|
Control character |
Underscore character: |
|
Less than character: |
Open parenthesis: |
|
Greater than character: |
Close parenthesis: |
|
Ampersand: |
Caret: |
|
Double quote: |
Backquote: |
|
Single quote: |
Backquote: |
Note:
Oracle Fusion Middleware includes several built-in metrics. The Oracle Fusion Middleware built-in metrics do not always follow the DMS naming conventions.5.1.1.2.3 Noun and Noun Type Naming Conventions
The following conventions are used when naming noun and noun types:
-
A noun name should be unique.
-
A noun name should identify a specific entity of interest.
-
Noun types should have names that clearly reflect the set of metrics being collected. For example, Servlet is the type for a noun under which the metrics that are specific to a given servlet fall.
-
Noun type names should start with a capital letter to distinguish them from other DMS names. All nouns of a given type should contain the same set of sensors.
-
The noun naming scheme uses a '/' as the root of the hierarchy, with each noun acting as a container under the root, or under its parent noun.
5.1.1.3 DMS Tracing and Events
Conceptually DMS generates a stream of events; each event is in response to one of the event-producing actions being performed on the DMS API by the components that integrate with DMS (such as a sensor being updated). That stream of events can be completely ignored or routed (and optionally filtered) to destinations that can respond in some way to events.
Table 5-5 provides a list of DMS tracing and event terminology.
Table 5-5 DMS Tracing and Event Terminology
| DMS Term | Definition |
|---|---|
|
Condition |
A condition is the logic behind a condition filter. It determines which events may pass through a filter, based on the rules defined in the condition. Every condition filter has zero or one root condition, but conditions may include AND or OR arguments together to create compound conditions. The single root condition can describe a relatively complex rule. Two types of condition exist:
For more information on using conditions, see Section 5.7, "DMS Tracing and Events". |
|
Destination |
A destination implements a mechanism for reacting to events that are passed to it. For example, a destination could log events to a file, another could send transformed copies of event to the Java Flight Recorder, yet another might render information gleaned from incoming events as data in an MBean. |
|
Event Route |
An event route connects a filter to a destination. Event routes may be enabled or disabled. |
|
Filter |
An event tracing filter selectively passes a subset of all possible DMS runtime events. Filters can be configured with rules that determine which events are passed and which are blocked. For example it is possible to define filters to:
For more information on using filters, see Section 5.7, "DMS Tracing and Events". |
|
Listener |
A DMS listener is also known as the destination. See Section 5.7.2, "Configuring Destinations" for more information. |
5.2 Understanding DMS Availability
DMS functionality is available on all certified Java EE servers. This includes both the runtime features and supporting commands. Also, several features of DMS will operate in JSE applications and standalone C applications.
For more information on which servers are certified, see the Oracle Fusion Middleware Certification Matrix.
5.3 Understanding DMS Architecture
DMS consists of the following features:
-
DMS Metrics - The DMS metrics feature provides Java and C APIs that are used by Oracle Fusion Middleware components for instrumenting code with performance measurements and other useful state metrics.
-
Execution Context - Execution Context supports the maintenance and propagation of a specific context structure throughout the Oracle stack. By exploiting the propagated context structure Oracle FMW components can record diagnostic information (such as log records) that can be correlated between different components and products running on the same or different servers and hosts. For more information see Section 5.6, "DMS Execution Context".
-
Events and Tracing - Event Tracing enables you to configure live tracing with no restarts. DMS metrics updated during the course of using Oracle Fusion Middleware products may be traced using the DMS Event Tracing feature. The system has been designed to facilitate not only tracing, but also to support other functionality that may be driven from DMS activity.
Figure 5-1 shows the components of DMS and how they interact with other Oracle Fusion Middleware components. Arrows show the direction in which information flows from one component to the next.
Figure 5-1 DMS Interactions with Oracle Fusion Middleware Components
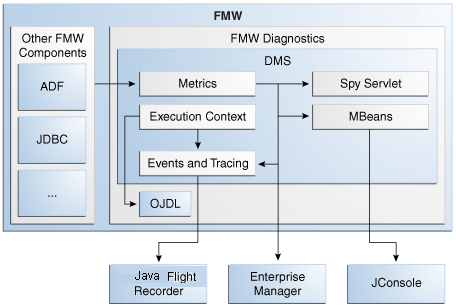
Description of "Figure 5-1 DMS Interactions with Oracle Fusion Middleware Components"
5.4 Viewing DMS Metrics
Oracle Fusion Middleware components are instrumented with DMS metrics in order to collect information that developers, system administrators, and support analysts can use to analyze system performance or monitor system status. The Fusion Middleware Control online help provides information on each of the specific metrics. See "Viewing the Performance of Oracle Fusion Middleware" in Administering Oracle Fusion Middleware for information on accessing metric information.
The Oracle Fusion Middleware metrics come from various sources and locations. They include MBean attributes and DMS metrics. They also come from non-Java EE servers, such as Oracle servers.
The following sections describe how to use various tools to view the DMS metrics:
5.4.1 Viewing Metrics Using the Spy Servlet
The Spy Servlet is part of the DMS Application that is deployed by default on JRF-extended installations. The Spy Servlet is launched from http://<host>:<port>/dms/Spy. The default port for WebLogic is 1521.
The DMS Application's web archive file is dms.war, and can be found in the same directory as dms.jar: oracle_common/modules/oracle.dms_12.1.2/dms.war.
For more information see Section 4.6, "DMS Spy Servlet".
Note:
The Spy Servlet is secured using standard Java EE declarative security in the web-application'sweb.xml file, and will only grant access to the Spy Servlet to members of the Administrator's group.5.4.2 Viewing Metrics with WLDF (WebLogic Diagnostic Framework)
You can use WebLogic Diagnostic Framework (WLDF) to harvest DMS metrics from DMS metric MBeans. You can also use WLDF to monitor changes to the attribute value of an MBean. For more information see "Configuring the Harvester for Metric Collection" in Configuring and Using the Diagnostics Framework for Oracle WebLogic Server.
5.4.3 Viewing metrics with WLST (Oracle WebLogic Server)
DMS provides three commands to view metrics in WLST:
| Use this command... | To do this... |
|---|---|
displayMetricTableNames() |
List the names of the available metric tables.
If you have a large number of DMS metric tables, consider using the NOTE: In 12c, the command syntax for For example:
|
displayMetricTables() |
Show the content of the DMS metric tables.
If you have a large number of DMS metric tables, consider using the NOTE: In 12c, the command syntax for For example:
|
dumpMetrics() |
Display metrics in the internal format. Valid formats for the dumpMetrics command include raw, xml and pdml.
If you have a large number of DMS metric tables, consider using the NOTE: In 12c, the command syntax for For example:
|
As well as displaying textual output, theses commands also return a structured object or single value that you can use in a script to process.
For more information on using these commands, see the following:
-
"Getting Started Using the Oracle WebLogic Scripting Tool (WLST)" in Administering Oracle Fusion Middleware
-
"DMS Metric Commands" in WLST Command Reference for Infrastructure Components
5.4.4 Viewing metrics with JConsole
To provide a standards-based way to access metrics, DMS exposes them through MBeans. An MBean will be created and registered for each typed noun with the runtime MBean Server. The DMS sensors contained by the noun are exposed as the attributes of the MBean. Exposing the DMS metrics as MBeans allows administrators to use tools such as JConsole (the Java monitoring and management console), and other Java Management Extension (JMX) clients, to access the DMS metrics.
MBeans also allow for integration with other Oracle diagnostics software such as WLDF (WebLogic Diagnostics Framework), which is described in Section 5.5. The noun name and noun type are exposed as the name and type properties of the metric MBean object name. The MBean domain name is "oracle.dms". The object name also reflects the DMS noun hierarchy.
Note:
You can use JConsole to view DMS generated MBeans on a Java EE server either locally or remotely. DMS generates an MBean for each Java DMS noun that has a valid noun type. It does not generate MBeans for the non-Java EE component's metrics and the DMS nouns that have no noun types. Each DMS metric contained under the noun is mapped to an attribute in the metric MBean.5.4.5 Viewing metrics with Oracle Enterprise Manager
Oracle Fusion Middleware automatically and continuously measures data regarding the component's performance, state and on-going behavior. The metrics are automatically enabled; there is no need to set options or perform any extra configuration to collect them. For more information see Section 4.2, "Oracle Enterprise Manager Fusion Middleware Control".
5.5 Accessing DMS Metrics with WLDF
The WebLogic Diagnostics Framework (WLDF) provides a diagnostic feature that allows MBean attributes to be harvested and monitored for specific conditions. This provides a proactive way of monitoring activity in your environment and creating E-mail and JMX notifications when a condition is triggered.
The following steps describe how to configure WLDF to send an E-mail notification using the WebLogic Administration Console:
-
Select an existing or create a new Diagnostics Module from the Diagnostics screen.
-
Click on the Watches and Notifications tab.
-
Click New.
-
Enter a Watch Name and click Next.
-
Enter the text as the Watch Rule and click Next.
(${ServerRuntime//[NOUNTYPE]oracle.dms:name=/starWars/alliance,type=NounType//forceBalance_value} = 'BAD') -
Select Use a manual reset alarm and click Next. The manual reset option means that once an E-mail is triggered, you must reset the watch using the WebLogic Administration Console.
-
Select the E-mail notification type and click Finish.
It is also possible to configure WLDF to collect the MBean data for offline storage and analysis. This is achieved by configuring a WLDF Diagnostic Module to collect specific MBean attributes, and can be done so using the WebLogic Administration Console.
For more information on using WLDF to harvest and monitor MBean data see Configuring and Using the Diagnostics Framework for Oracle WebLogic Server.
5.6 DMS Execution Context
The DMS execution context is the mechanism by which requests (such as or RMI requests) can be uniquely identified and thus tracked as they flow through the system. It also provides a means by which context information can be communicated between cooperating Fusion Middleware components involved in fulfilling requests.
5.6.1 DMS Execution Requests and Sub-Tasks
The DMS execution context has been developed with the understanding that a single request (or task) may form the root of a tree of sub-tasks that are coordinated to complete the request or root task. Consider the following examples of requests and their associated sub-tasks:
-
An request sent directly to Oracle WebLogic Server from a browser:
-
Root task only on Oracle WebLogic Server
-
-
An request sent through Oracle Server (acting as a reverse proxy) to Oracle WebLogic Server:
-
Root task on Oracle Server
-
Single sub-task on Oracle WebLogic Server
-
-
An request sent from Oracle Server (acting as a reverse proxy) to Oracle WebLogic Server that then requires invocation of two remote web services from Oracle WebLogic Server in order to fulfill the request:
-
Root task on Oracle Server
-
Single sub-task on Oracle WebLogic Server
-
Two sub-sub-tasks, one on each web service
-
A DMS execution context is composed of the following:
-
A unique identifier, the ECID
The Execution Context ID (ECID) is unique for each new root task and is shared across the tree of tasks associated with the root task.
-
A relationship identifier, the RID
The Relationship ID (RID) is an ordered set of numbers that describes the location of each task in the tree of tasks. The leading number is usually a zero. A leading number of 1 indicates that it has not been possible to track the location of the sub-task within the overall sub-task tree.
-
A set of name-value pairs by which globally relevant data can be shared among Oracle Fusion Middleware components.
The following three scenarios illustrate how ECID and RID are used when an request is sent from Oracle Server (acting as a reverse proxy) to an Oracle WebLogic Server and the server requires invocation of two remote web services from Oracle WebLogic Server.
-
Root task on Oracle Server:
-
New ECID = B5C094FA...BE4AE8
-
Root RID = 0
-
-
Single sub-task on Oracle WebLogic Server:
-
Same ECID = B5C094FA...BE4AE8
-
Sub-task RID = 0:1
-
-
Two Sub-tasks, one on each web service:
-
First web service invoked
Same ECID = B5C094FA...BE4AE8
Sub-task RID = 0:1:1
-
Second web service invoked
Same ECID = B5C094FA...BE4AE8
Sub-task RID = 0:1:2
-
5.6.2 DMS Execution Context Usage
The most immediate benefits of the DMS execution context are realized when attempting to correlate log messages between servers. The Oracle standard format for logging involves a field dedicated to the ECID. Once the ECID is known, when its read from an ERROR level log message for example, it is possible to locate all other log messages associated with that task by querying the log files for messages containing that ECID.
The following example shows a very specific case of using the command:
displayLogs(ecid="B5C094FA...BE4AE8");
In this example, any log files with messages that contain the ECID B5C094FA...BE4AE8 will be displayed.
5.6.3 DMS Execution Context Communication
Figure 5-2 shows the components that cooperate in order to communicate the DMS execution context between each other. Arrows pointing to a component indicate the protocols that are inspected for incoming context information. Outgoing arrows show protocols to which context information is added. It is possible for a single component to send requests to itself, passing context information in that request.
Figure 5-2 DMS Execution Context Communication Protocols
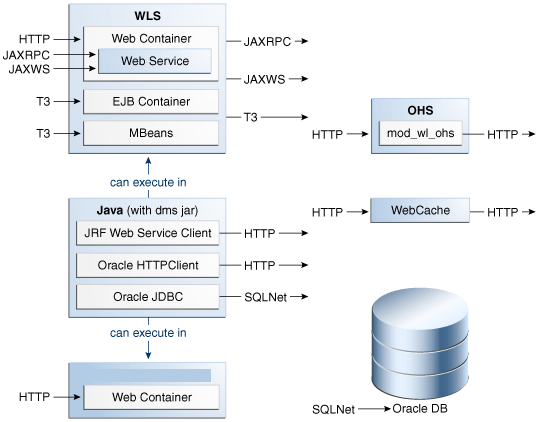
Description of "Figure 5-2 DMS Execution Context Communication Protocols"
5.7 DMS Tracing and Events
DMS can selectively trace the following:
-
DMS sensor lifecycle events (create, update, delete of state sensors, event sensors and phase sensors)
-
Context events (start, stop)
-
events (start, stop)
The configuration that controls which of these types of events are traced, and how those events are processed, is recorded in the dms_config.xml file. The DMS trace configuration is split into three parts:
-
Filter Configuration
Defines the rules that select the events that are of interest
-
Destination Configuration
Defines how the events are used
-
eventRoute Configuration
Defines which filters are wired to which destinations
A filter can be associated with one or more destinations thus granting the administrator the ability to define a filter rule once and have the resulting subset of all possible events processed on one or more different destinations.
The configuration can be modified using the DMS configuration MBean or WLST commands at runtime; this makes the DMS tracing feature invaluable for diagnosing issues within a specific time period or collecting specific data at a specific time for a specific set of criteria.
For more information, see "Configuring Selective Tracing Using WLST" in Administering Oracle Fusion Middleware.
The following types of filter rules are supported:
-
Event Type Conditions
Used to identify if an event was triggered from the START or STOP of a PHASE_SENSOR
-
Context Type Conditions
Used to identify if the event was generated from a unit of work whose context contains a value (for example, "USER")
-
Noun Type Conditions
Used to identify if the event was triggered from a sensor whose noun is of a specific type (for example, JDBC_CONNECTION
-
Logical
ANDandORcombinations of the above conditions
5.7.1 Configuring the DMS Event System
Configuration is recorded in each server's dms_config.xml file. MBean updates can be made at runtime using command line interface (CLI) commands and through the Event Configuration Mbean. Configuration updates are applied to the running system in a thread safe, but non-atomic, manner.
The object name of the DMS Event configuration MBean is: oracle.dms.event.config:name=DMSEventConfigMBean,type=JMXEventConfig
To review the current state of your system's DMS event configuration, use the following command:
listDMSEventConfiguration([server=<server>])
The resulting output will look similar to this:
Event routes:
        FILTER      :  auto662515911
        DESTINATION :  destination1
        ENABLED     :  true
        FILTER      :  filter0
        DESTINATION :  q
        ENABLED     :  true
Filters with no event route:
  Fred

Destinations with no event route:
  des4
5.7.1.1 Adding and Editing Filters
Filters define the rules that select which events are considered for tracing.
The following example shows how to add a filter that selects all events related to JDBC operations:
addDMSEventFilter(id='myJDBCFilter', props={'condition': 'NOUNTYPE sw JDBC_'})
Or:
addDMSEventFilter(id='myJDBCFilter', props={'condition': 'NOUNTYPE startsWith JDBC_'})
This filter assumes that all DMS sensor updates associated with JDBC operations are performed on nouns of types whose names begin "JDBC_".
If the rule must be modified, the filter may be updated as shown in the following example:
updateDMSEventFilter(id="myJDBCFilter", props={'condition': 'NOUNTYPE startsWith JDBC_ OR NOUNTYPE startsWith MDS_'});
As of Oracle Fusion Middleware 11.1.1.6.0, the following shortened convenience operators have been added. Operators can be specified using either the shortened or longer name.
Note that operators with an underscore have been deprecated in favor of the ODL format, which is to use mixed case. For example, not_equals becomes notEquals or ne. The old format will still work, but is discouraged.
| Noun Type Operators | |
|---|---|
| equals, eq | notEquals, ne |
| contains | in |
| startsWith, sw | |
| Context Operators | |
|---|---|
| equals, eq | notequals, ne |
| isnull | isnotnull |
| startswith, sw | contains |
| lt | gt |
Example:
addDMSEventFilter(id='mdsbruce', name='MyFilter', props={'condition':
'NOUNTYPE eq MDS_Connections AND CONTEXT user ne bruce'})

addDMSEventFilter(id='mdsbruce', name='MyFilter', props={'condition':
'NOUNTYPE equals MDS_Connections AND CONTEXT user notequals bruce'})
For more information about the syntax used to describe a filter's rule (the condition property), refer to the WebLogic Scripting Tool Command Reference or the command help.
5.7.1.2 Adding and Editing Destinations
Destinations encapsulate logic for responding to events. For example, a basic destination will log the event, a different destination may transform an event and pass it to another system for further processing.
The following example shows how to add a destination that will log events:
addDMSEventDestination(id="myLoggerDestination", class="oracle.dms.trace2.runtime.LoggerDestination", props={"loggerName":"myLogger"});
Note that merely adding the destination is not sufficient for events to be logged; to log the events, you must associate a filter with a destination using an eventRoute, and the eventRoute must be enabled (default).
The types of destination available, and their configuration options, are described in Section 5.7.2. The following example shows how to edit an existing destination:
updateDMSEventDestination(id="myLoggerDestination", props={"loggerName":"myTraceLogger"});
5.7.1.3 Adding and Editing Event Routes
The following example shows how to join the filter and destination created above:
addDMSEventRoute(filterid='myJDBCFilter', destinationid='myLoggerDestination')
Note that you can invoke addDMSEventRoute without an explicit filterId. In these scenarios, all events are passed to the destination without filtering.
To remove a filter or destination, you must first remove the event routes associated with the filter or destination (even if the event route is disabled). For example, if you wanted to remove myJDBCFilter, you would first need to remove the eventRoute created in the previous example, and then remove the filter as shown in the following example:
removeDMSEventRoute(filterid='myJDBCFilter', destinationid='myLoggerDestination')
removeDMSEventFilter(id='myJDBCFilter')
5.7.1.4 Compound Operations
It is possible to create a filter and an eventRoute based on that filter using a single command (rather than using two separate commands as shown in Section 5.7.1.3). Note, however, that the destination to be used by the event route must already be defined:
enableDMSEventTrace (destinationid='myLoggerDestination', condition='NOUNTYPE starts_with JDBC_')
In the example above, enableDMSEventTrace automatically creates a filter with the specified condition, and also creates and enables an event route using the new filter and the nominated destination. The output is shown in the following example:
Filter "auto605449842" using Destination "myLoggerDestination" added, and event-route enabled for server "AdminServer"
5.7.2 Configuring Destinations
DMS offers the following types of destinations:
5.7.2.1 LoggerDestination
| Description | The LoggerDestination writes each event to the associated logger. |
| Implementing Class | oracle.dms.trace2.runtime.LoggerDestination |
| Properties | |
loggerName |
The name of the ODL logger to which events will be written. |
Instances of logger destinations write events to the named logger at a log level of FINER.
The loggerName property specifies the name of a logger, but the logger does not necessarily have to be described in logging.xml, though it can be. If the logger name refers to a logger that is explicitly named in logging.xml, then the logger is referred to as a static logger (see Section 5.7.2.1.1). If the logger name refers to a logger that is not explicitly named in logging.xml, then the logger is referred to as a dynamic logger (see Section 5.7.2.1.2).
Use in the default configuration: the default configuration defines a logger destination, with an identification of LoggerDestination. This particular instance does not form part of any eventRoute and therefore is not active. It is provided for convenience, and uses a dynamic logger.
5.7.2.1.1 Static Loggers and Handlers
Loggers are the objects to which log records are presented. Log handlers are the objects through which log records are written to log files.
For complete control over the log file to which DMS trace data is written, define the logger named in the logger destination in logging.xml. Doing this allows you to explicitly define the name of the log file, the maximum size, format, file rotation and policies.
Oracle recommends using commands (like the example below) to update the configuration.
setLogLevel(logger="myTraceLogger", level="FINER", addLogger=1);

configureLogHandler(name="my-trace-handler", addToLogger=["myTraceLogger"], path="/tmp/myTraceLogFiles/trace", maxFileSize="10m", maxLogSize="50m", handlerType="oracle.core.ojdl.logging.ODLHandlerFactory", addHandler=1, useParentHandlers=0);

configureLogHandler(name="my-trace-handler", propertyName="useSourceClassandMethod", propertyValue="false", addProperty=1);
For more information on logging configuration, see "Managing Log Files and Diagnostic Data" in the Administering Oracle Fusion Middleware.]
The use of the optional property useSourceClassandMethod set to FALSE prevents the 'SRC_CLASS' and "SRC_METHOD' from appearing in every message and will marginally improve performance by reducing file output times.
For static loggers, consider setting the useParentHandlers parameter to FALSE, otherwise duplicate event messages will be logged to [server]-diagnostics.log, and shown in a log query.
See Section 5.7.3, "Understanding the Format of DMS Events in Log Messages" for more information about interpreting logger output.
5.7.2.1.2 Dynamic Loggers and Handlers
If the named logger has no associated handler defined in logging.xml, then the logger destination will dynamically create a handler object that will write to a file in the server's default log output directory. (Instances of logger destinations write events to the named logger at a log level of FINER.) The file name will be the logger's name followed by "-event.log". For instance, in the example in Section 5.7.2.1.1, DMS events would be written to "myTraceLogger-event.log".
5.7.2.1.3 Default Locations of the logging.xml File
The logging.xml file can typically be found in one of the following platform locations:
| Platform | Server | Location |
|---|---|---|
| Oracle WebLogic Server | AdminServer | ORACLE_HOME/WLS_Home/user_projects/domains/base_domain/config/fmwconfig/servers/AdminServer/logging.xml |
5.7.2.1.4 Using a CLI Command to Query the Trace Log File
If the logger destination's logger and handler are defined in logging.xml then you can take advantage of the displayLogs() command to conveniently access logged trace data without having to manually locate or search for it.
Examples:
-
To display all the log messages for the myTraceLogger:
displayLogs(query='MODULE equals myTraceLogger')
-
To display only the log messages for myTraceLogger which have an ECID of '0000HpmSpLWEkJQ6ub3FEH194kwB000004':
displayLogs(query='MODULE equals myTraceLogger and ECID equals 0000HpmSpLWEkJQ6ub3FEH194kwB000004')
-
To display only the log messages for myTraceLogger which have an ECID of '0000HpmSpLWEkJQ6ub3FEH194kwB000004' in the last 10 minutes:
displayLogs(query='MODULE equals myTraceLogger and ECID equals 0000HpmSpLWEkJQ6ub3FEH194kwB000004', last=10)
-
To display all the log messages from a dynamic logger the log's file name must be included:
displayLogs(disconnected=1, log=DOMAIN_ROOT+"/servers/AdminServer/logs/myTraceLogger-event.log")
5.7.2.2 MBean Creator Destination
| Description | The MBean creator destination make nouns accessible as MBeans, exposing their metrics as attributes, for access via WLDF, JConsole, etc. |
| Implementing Class | oracle.dms.jmx.MetricMBeanFactory |
Use in the default configuration: An instance of the MBean Creator destination is configured and active by default, and will create MBeans for all nouns created in the server.
By associating an instance of this destination type with a filter based on a noun-type rule, it is possible to expose (as MBeans) only those noun types that are of interest to the administrator.
Although it is possible to modify the configuration associated with an MBean creator destination at runtime, it must be understood that the reinitialization process for this type of destination may impact performance. Frequent runtime reconfiguration is therefore discouraged.
Note that WebLogic Diagnostic Framework (WLDF) can be used to harvest DMS metrics exposed by the MBean creator destination. For more information about WLDF, see Configuring and Using the Diagnostics Framework for Oracle WebLogic Server.
5.7.2.2.1 Metric MBean Object Name
The noun name and noun type are exposed as the name and type properties of the metric MBean object name. The MBean domain name is "oracle.dms". The object name also reflects the DMS noun hierarchy.
For example if the noun's full path name is:
/oracle/dfw/ofm/base_domain/AdminServer
and the noun type is DFW_Incident, the object name of the MBean representing the noun is
oracle.dms:Location=AdminServer,name=/oracle/dfw/ofm/base_domain/AdminServer,type=DFW_Incident.
5.7.2.3 Request Tracker Destination
| Description | The Request Tracker destinations maintains a list of active requests, and makes the requests accessible to other Diagnostic Framework (DFW) components. |
| Implementing Class | oracle.dms.event.RequestTrackerDestination |
| Properties | |
excludeHeaderNames |
Comma separated list of header names to exclude from tracking |
Use in the default configuration: An instance of the request tracker destination is enabled by default. In the case of a DFW incident being generated the active request list will be dumped automatically, allowing an administrator to correlate the failure with a specific request.
For each request the following information will be dumped:
-
Uniform Resource Identifier (URI)
-
Start time of the request
-
Execution Context ID (ECID)
-
Query string
-
Headers
When the request tracker is not enabled the Request Dump will output the following:
Requests are not being tracked. To enable request tracking enable the DMS oracle.dms.event.RequestTrackerDestination in dms_config.xml
5.7.2.3.1 Executing the Request Tracker Dump
The information being maintained by the request tracker can be accessed manually. In order to execute the dump that reports the request information the WLST executeDump command can be used, when connected to a server, as follows:
> executeDump(name=".requests")
Active Requests:

StartTime: 2009-12-14 02:24:41.870
ECID: 0000IMChyqEC8xT6uBf9EH1B9X9^000009,0
URI: /myApp/Welcome.jsp
QueryString:
Headers:
   Host: myHost.myDomain.com:7001
   Connection: keep-alive
   User-Agent: Mozilla/5.0 (Windows; U; Windows NT 5.1; en-US) AppleWebKit/532.5 (KHTML, like Gecko) Chrome/4.0.249.30 Safari/532.5
   Accept: application/xml,application/xhtml+xml,text/html;q=0.9,text/plain;q=0.8,image/png,*/*;q=0.5
   Accept-Encoding: gzip,deflate
   Cookie: ORA_MOS_LOCALE=en%7CGB; s_nr...
   Accept-Language: en-GB,en-US;q=0.8,en;q=0.6
   Accept-Charset: ISO-8859-1,utf-8;q=0.7,*;q=0.3
5.7.2.4 Java Flight Recorder Destination
The Java Flight Recorder (JFR) records information regarding the runtime status and behavior of the Java JVM. JFR also exposes an API through which third party events can be reported.
By themselves DMS traces and JFR traces only show part of the picture of the actions being performed in the server. DMS integration with JFR enhances the diagnostic information available to administrators and developers as follows:
-
Application level events and JVM level events can be reported as a single sequence therefore avoiding the need to combine such events from separate log files based only on timestamp (which may not tick over fast enough to accurately order events created at or around the same time).
-
Recent DMS activity can be dumped, retroactively, from the JVM at will.
-
Recent DMS and JVM events can be dumped to disk in the event of a fatal error that causes the JVM to exit gracefully.
-
The DMS ECID can be used to correlate activity relating to the same request, or unit of work, across the span of a JFR recording.
-
The DMS ECID can be used to collect diagnostic information from all systems involved with an event, or series of events, recorded by JFR.
5.7.2.4.1 Dynamically Derived JFR Event Types – Names, Values and Descriptions
A DMS noun type will be associated with a JFR InstantEvent event type:
-
The name of the JFR event type for a noun type will be the noun type's name with the suffix "state".
-
The path of the JFR event type for a noun type will be "dms/" followed by the producer-name, followed by the event type name.
-
Event sensors will not contribute any values to the noun type's JFR event type.
-
The values of the JFR event for a noun type are described in Table 5-6:
Table 5-6 Values of the JFR Event for a Noun Type
Value Name Description Relational Notes ECID
The Execution Context ID (ECID) associated with the action.
Yes
RID
The RID associated with the action.
Yes
<noun type> name
The full path of the noun.
This field will be populated with the full path of the noun. The field's name assumes that the noun_type meaningfully categorizes all objects being measured by the nouns of that type.
<state-sensor-name>
The value of the state sensor.
No
Each state sensor belonging to the noun will contribute one of these values to the instant event. There may be more that one value in each noun.
event name
The name of the event sensor that was updated, left null otherwise.
No
The event name field is required for being able to count the number of times a DMS event sensor has been updated in a recording (event sensors do not contribute values to an event type).
A DMS phase sensor will be associated with a JFR DurationEvent event type:
-
The name of the JFR event type for a phase sensor belonging to a noun of a particular noun type will be the noun type's name following by the phase sensor's name.
-
The path of the JFR event for a noun type will be "dms/" followed by the producer-name, followed by the event type name.
-
The values of the duration event will be as above (except for the sensorName value). For example the "stop" of a phase event will result in a JFR duration event being reported to JFR that contains the state information of the phase event's parent noun.
Several DMS objects allow integrators to add descriptions. Descriptions from DMS objects will be used as follows:
-
Noun type description will be used in creation of the JFR event type
-
State and event sensor descriptions will not be applied – there is nowhere to apply them.
-
Phase sensor descriptions will be applied to their JFR event type.
5.7.2.4.2 Examples of Dynamically Derived Producers and Events
Table 5-7 provides examples for the rules described in Section 5.7.2.4.1:
Table 5-7 Examples of Dynamically Derived Producers and Events
| DMS | Java Flight Recorder (JFR) |
|---|---|
|
Noun type:
Noun path:
Sensors:
Where: P: Phase Sensor S: State Sensor E: Event Sensor |
Producer Name: JDBC The Producer Name is based on the leading component of the noun path. Event Type 1 Event Type Name: <noun type> State Event Type Path: dms/<leading component of noun path>/<noun type>/_State Fields:
|
|
Producer Name: JDBC Event Type 2 Event Type Name: Event Type Path:
Fields:
|
|
|
Producer Name: JDBC Event Type 3 Event Type Name: Event Type Path:
Fields:
|
|
|
Producer Name: JDBC Event Type 4 Event Type Name: Event Type Path:
Fields:
|
5.7.3 Understanding the Format of DMS Events in Log Messages
Table 5-8 describes the fields that make up a DMS event. Field elements are separated by ":" (with a few exceptions). Sample events are provided to illustrate the position of the field within an actual event string.
Table 5-8 Event Formatting Descriptions
| Applicable Events | Field Number | Name | Description |
|---|---|---|---|
|
All |
1 |
Version number |
The version number of the event format For example: v1:1280737384058:_REQUEST:STOP:/MyWebApp/emp |
|
All |
2 |
Event time |
The time at which the event occurred For example: v1:1280737384058:_REQUEST:STOP:/MyWebApp/emp |
|
All |
3 |
Source object type |
The type of object on which an action was performed to produce the event including:
For example: v1:1280737384058:_REQUEST:STOP:/MyWebApp/emp |
|
All |
4 |
Action type |
The type of action that resulted in the generation of this event. A given source object type may not necessarily produce events for every action type:
For example: v1:1280737384058:_REQUEST:STOP:/MyWebApp/emp |
|
Nouns |
5 |
Noun type |
The name of the noun type For example: v1:1281344803506:NOUN:CREATE:JDBC_Connection:/JDBC/JDBC Data Source-0/CONNECTION_1 |
|
6 |
Noun path |
The full path identifying the noun to which the sensor belongs For example: v1:1281344803506:NOUN:CREATE:JDBC_Connection:/JDBC/JDBC Data Source-0/CONNECTION_1 |
|
|
All Sensor Types |
5 |
Noun type |
The name of the noun type to which this sensor belongs For example: v1:1280503318973:STATE_SENSOR:UPDATE:JDBC_Connection:LogicalConnection:/JDBC/JDBC Data Source-0/CONNECTION_1:State.ANY:LogicalConnection@13bed086 |
|
6 |
Sensor name |
The name of the sensor For example: v1:1280737383069:PHASE_SENSOR:STOP:JDBC_Connection:DBWaitTime:/JDBC/JDBC Data Source-0/CONNECTION_1:1280737382950:1280737383069 |
|
|
7 |
Noun path |
The full path identifying the noun to which the sensor belongs For example: v1:1280737383069:PHASE_SENSOR:STOP:JDBC_Connection:DBWaitTime:/JDBC/JDBC Data Source-0/CONNECTION_1:1280737382950:1280737383069 |
|
|
Phase Sensor Types |
8 |
Start token |
The start token of the phase. For example: v1:1280737383069:PHASE_SENSOR:STOP:JDBC_Connection:DBWaitTime:/JDBC/JDBC Data Source-0/CONNECTION_1:1280737382950:1280737383069 |
|
9 |
Stop token |
The end token of the phase. For example: v1:1280737383069:PHASE_SENSOR:STOP:JDBC_Connection:DBWaitTime:/JDBC/JDBC Data Source-0/CONNECTION_1:1280737382950:1280737383069 |
|
|
State Sensor Types |
8 |
State value type |
The type of value held by the state sensor including:
For example: v1:1280503318973:STATE_SENSOR:UPDATE:JDBC_Connection:LogicalConnection:/JDBC/JDBC Data Source-0/CONNECTION_1:State.ANY:LogicalConnection@13bed086 |
|
9 |
State value |
The value of the state represented in string form. For example: v1:1280503318973:STATE_SENSOR:UPDATE:JDBC_Connection:LogicalConnection:/JDBC/JDBC Data Source-0/CONNECTION_1:State.ANY:LogicalConnection@13bed086 |
|
|
Requests |
5 |
URI |
Uniform Resource Identifier (URI) identifies the resource upon which to apply the request. For example: v1:1280737382889:_REQUEST:START:/myWebApp/showEmployees v1:1280737384058:_REQUEST:STOP:/myWebApp/showEmployees |
|
Execution Context |
5 |
ECID,RID |
The context identifier (composed of ECID and RID separated by a comma). For execution context events the complete substring starting at the first character after the fourth event field separator (":") records the ECID,RID identifiers - the context identifiers may contain ":" but these should not be interpreted as event field separators. For example: v1:1280737384058:EXECUTION_CONTEXT:STOP:bc4fd0668f79d507:367c127f:12a23f2013c:-8000-0000000000000f73,0 |
5.7.4 Understanding DMS Event Actions
Table 5-9 shows the action types that can be performed on source object types.
5.8 DMS Best Practices
The use of DMS metrics can have an impact on application performance. When adding metrics, consider the following:
-
Use a High Resolution Clock to increase DMS Precision
By default DMS uses the system clock for measuring time intervals during a
PhaseEvent. The default clock reports microsecond precision in C processes such as Apache and reports millisecond precision in Java processes. Optionally, DMS supports a high resolution clock to increase the precision of performance measurements and lets you select the values for reporting time intervals. You can use a high resolution clock when you need to time phase events more accurately than is possible using the default clock or when the system's default clock does not provide the resolution needed for your requirements.System clocks are not necessarily as accurate as their precision implies. For example, a system clock that reports time in milliseconds may not tick (change) once per millisecond. Instead, it may take up to 15ms to tick as shown in the following example:
Table 5-10 Default System Clock Time versus Actual Time (in milliseconds)
Actual Time System Time 12:00:00.000
12:00:00.000
12:00:00.001
12:00:00.000
12:00:00.002
12:00:00.000
[...]
12:00:00.014
12:00:00.000
12:00:00.015
12:00:00.015
12:00:00.016
12:00:00.015
Table 5-10 shows a phase with a 12ms duration that runs from actual time 12:00:00.002 to 12:00:00.014 would be calculated in system time as having a duration of zero. Similarly, a phase with a 2ms duration running from 12:00:00.014 to 12:00:00.016 would be reported in system time as having a duration of 15ms.
Note:
These behaviors are more evident on some operating systems than others. Use caution when analyzing individual periods of time that are shorter than the tick period of the system clock. Configuring DMS to use a higher resolution clock will cause DMS to record phase sensor activations with higher resolution, but the accuracy will still be limited by the underlying system. -
Configure DMS Clocks for Reporting Time for Java
Selecting the high resolution clock changes clocks for all applications running on the server where the clock is changed. You set the DMS clock and the reporting values globally using the
oracle.dms.clockandoracle.dms.clock.unitsproperties, which control process startup options.For example, to use the high resolution clock with the default values, set the following property on the Java command line:
-Doracle.dms.clock=highres
Caution:
If you use the high resolution clock, the default values are different from the value that Fusion Middleware Control expects (msecs). If you need the Fusion Middleware Control displays to be correct when using the high resolution clock, then you need to set the units property as follows:-Doracle.dms.clock.units=msecs
Table 5-11 shows supported values for the
oracle.dms.clockproperty.Table 5-12 shows supported values for the
oracle.dms.clock.unitsproperty.Table 5-11 oracle.dms.clock Property Values
Value Description DEFAULT
Specifies that DMS use the default clock. With the default clock, DMS uses the Java call
java.lang.System.currentTimeMillisto obtain times for PhaseEvents.The default value for the units for the default clock is MSECS.
HIGHRES
The Java Highres clock uses
System.nanoTime()(no JNI required).Table 5-12 oracle.dms.clock.units Property Values
Value Description MSECS
Specifies that the time be converted to milliseconds and reported as "msecs". A millisecond is 10-3 seconds.
Note: This is the default value for the default clock.
USECS
Specifies that the time be converted to microseconds and reported as "usecs". A microsecond is 10-6 seconds.
NSECS
Specifies that the time be converted to nanoseconds and reported as "nsecs". A nanosecond is 10-9 seconds.
Note: This is the default value for the high resolution clock.
Note the following when using the high resolution DMS clock:
-
When you set the
oracle.dms.clockand theoracle.dms.clock.unitsproperties, any combination of upper and lower case characters is valid for the value that you select (case is not significant). For example, any of the following values are valid to select the high resolution clock: highres, HIGHRES, HighRes. -
DMS checks the property values at startup. When the clock property is set with a value not listed in Table 5-11, DMS uses the default clock. If the
oracle.dms.clockproperty is not set, DMS uses the default clock. -
When the clock units property is set to a value not listed in Table 5-12, DMS uses the default units for the specified clock.
-