4 Event Processing Network
This chapter describes how you can use Oracle Stream Analytics Visualizer to manage the event processing networks (EPNs) of a deployed Oracle Stream Analytics application. It explains how to view the EPN graphically, view and edit the configuration of a EPN stage, record and play back the event flow for debugging, tracing and injecting events. It also explains how to monitor channels and the throughput and latency of a stage or path in the EPN.
Note:
When one application (application-1) advertises a channel that a second application (application-2) subscribes to and uses as a foreign stage, you cannot view the details of the advertised channel from application-2. To view the details of this channel, you must do so from application-1.
This chapter includes the following sections:
For more information, see EPN Management.
4.1 View the EPN of an Application
Using the Oracle Stream Analytics Visualizer, you can view the EPN of a deployed application.
View the EPN of an Application
-
In the left pane, navigate to and expand the Applications node of the Oracle Stream Analytics server instance to which the application is deployed.
-
Select appname, where appname is the name of the application whose EPN you want to view.
-
In the right pane, click the Event Processing Network tab.
The Event Processor Network panel is displayed as Figure 4-1 shows.
Figure 4-1 Event Processing Network Panel
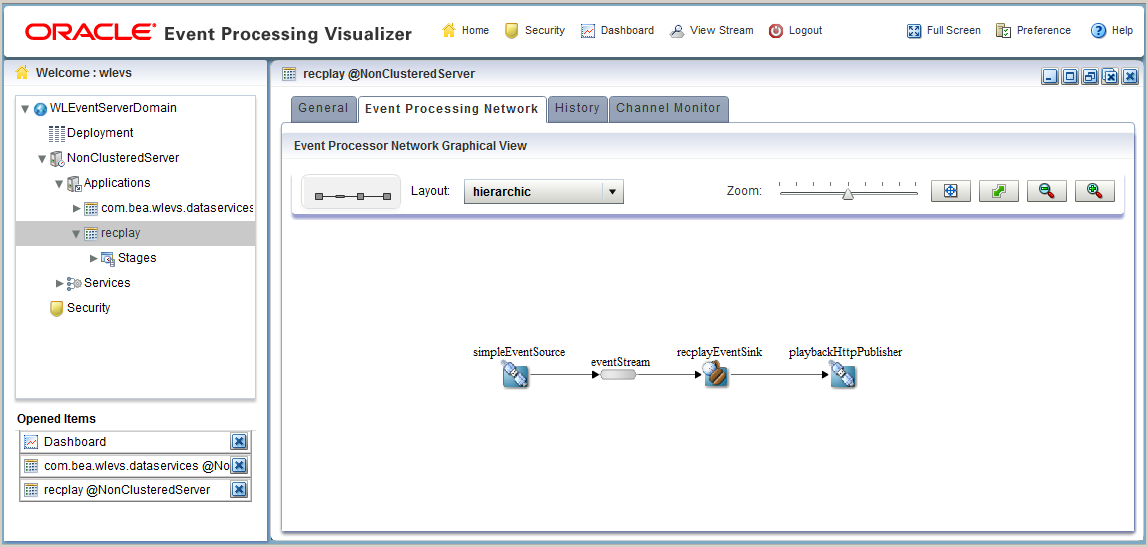
Description of "Figure 4-1 Event Processing Network Panel"The name of a stage appears above the stage in black text. For example, there is an Oracle CQL processor called
FindCrossRatesand the name of its inbound channel isFxQuoteStream.The name of the event type transmitted on a given channel is shown below the connecting line in blue text. For example, the event type transmitted on the
FxQuoteStreamisCrossRateEvent. -
To navigate to areas of the EPN that are off the screen, click in the miniature EPN view, and drag.
-
To change the layout of the EPN, select a layout option from the Layout menu:
-
organic -
tree -
hierarchic(default) -
balloon -
orthogonal
-
-
To change the way the EPN fits in the browser window:
-
Click on the Zoom slider and drag to the right to increase the zoom level; drag left to decrease the zoom level.
-
Click the Fit Content button to automatically adjust the zoom level to make all of the EPN visible in the browser window; click the Actual Size button to reset the zoom level to zero.
-
Click the Zoom Out (+) button or Zoom In (-) button.
-
4.2 View and Edit the Configuration of a Stage
Using Oracle Stream Analytics Visualizer, you can view the configuration of any stage and change the configuration for some stages.
Note:
Any changes to rules and Oracle high availability adapters are propagated to the other servers in the same group. That is, all rule and Oracle high availability adapter configurations is automatically synchronized. Other configuration changes are not synchronized. For example, if you change record/playback or JMS adapter configuration on one server in a multiserver domain, then these changes are not synchronized with the other servers in the same group. For more information, see Multiserver Domains.
4.2.1 How to View and Edit the Configuration of a Stage
You can view and change the configuration of a stage using the Oracle Stream Analytics Visualizer.
To view and edit the configuration of a stage:
-
In the left pane, navigate to and expand the Applications node of the Oracle Stream Analytics server instance to which the application is deployed.
-
Select appname, where appname is the name of the application you want.
-
Select the stage you wish to view and configure:
-
To use the EPN diagram:
-
Click the Event Processing Network tab.
-
Double-click the stage you wish to view or Right-click the stage and select Open Panel.
-
-
To use the domain tree:
-
Expand the appname > Stages node, where appname is the name of the application you want to view.
-
Click the stage you wish to view.
-
In the right pane, click the General tab
-
The stage's configuration appears.
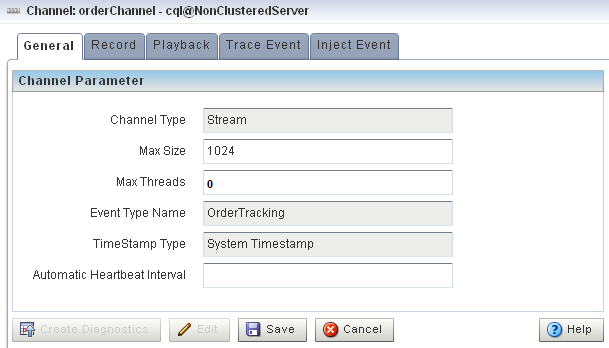
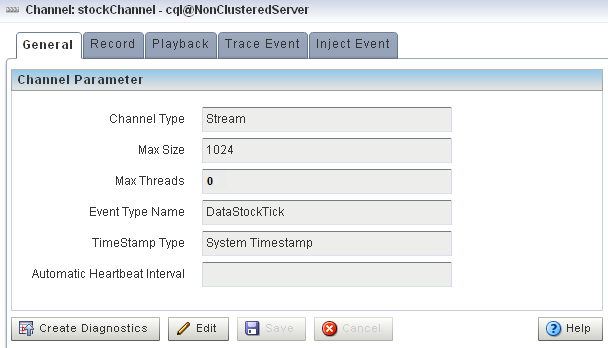
For example, Figure 4-2 shows the General tab for a channel.
Figure 4-2 General Tab for Channel Stage: Before Clicking Edit
Description of "Figure 4-2 General Tab for Channel Stage: Before Clicking Edit"Note:
Not all stage's configuration can be updated by Oracle Stream Analytics Visualizer. An Edit button will appear if the configuration can be updated.
For a description of the configuration properties for each possible stage, see:
-
-
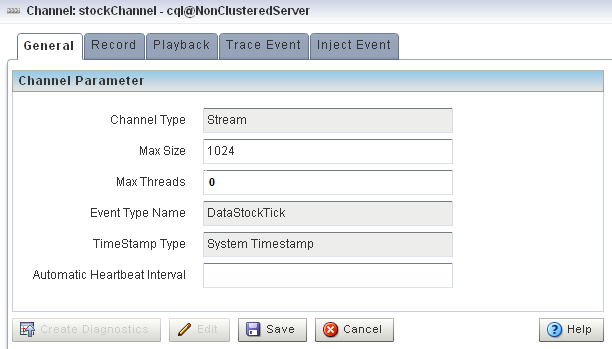
Click the Edit button, if present.
Modifiable attributes become editable as Figure 4-3 shows.
Figure 4-3 General Tab for Channel Stage: After Clicking Edit
Description of "Figure 4-3 General Tab for Channel Stage: After Clicking Edit" -
Enter new values for editable fields.
For example, for the Max Size and Max Threads fields in Figure 4-3.
-
To commit your changes, click Save.
-
To leave the configuration unchanged, click Cancel.
4.2.1.1 Channel Properties
Figure 4-4 shows the General tab for a channel stage.
After you click Edit, you can modify the attributes that are not shaded grey. Table 4-1 describes all the attributes on the General tab for this stage.
Table 4-1 General Tab Properties: Channel
| Attribute | Description |
|---|---|
|
|
Stream or Relation. |
|
|
Specifies the maximum size of the channel. Zero-size channels synchronously pass-through events. Non-zero size channels process events asynchronously, buffering events by the requested size. The default value is 0. |
|
|
Specifies the maximum number of threads that will be used to process events for this channel. You can change If the The default value for this attribute is 0. |
|
|
The name of the event type that this channel carries. |
|
|
Use this element to specify whether or not the channel is application timestamped, that is, if the application is responsible for assigning a timestamp to each event, using any time domain. Valid values are:
|
|
|
Use this element to specify an expression to be used as an application timestamp for event processing. Valid values are any Oracle CQL arithmetic expression |
|
|
For system timestamped relations or streams, time is dependent upon the arrival of data on the relation or stream data source. Oracle Stream Analytics generates a heartbeat on a system timestamped relation or stream if there is no activity (no data arriving on the stream or relation's source) for more than this number of nanoseconds. Either the relation or stream is populated by its specified source or Oracle Stream Analytics generates a heartbeat every Note: This attribute is only applicable when a non-streaming source is connected to the channel. |
|
|
Indicates if application time published is always strictly greater than the last value used. Valid values are |
For more information, see:
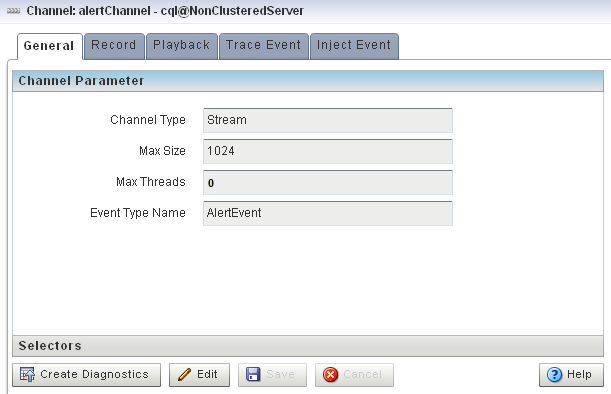
4.2.1.2 Channel Properties: Outbound Channel
Figure 4-5 shows the General tab for an outbound channel stage with an upstream Oracle CQL processor. The Channel Parameter accordion tab is selected.
Figure 4-5 General Tab Outbound Channel Parameters
Description of "Figure 4-5 General Tab Outbound Channel Parameters "
After you click Edit, you can modify the attributes that are not shaded grey. Table 4-2 describes all the attributes on the General tab for this stage.
|
Table 4-2 General Tab Properties: Outbound Channel
|
For more information, see:
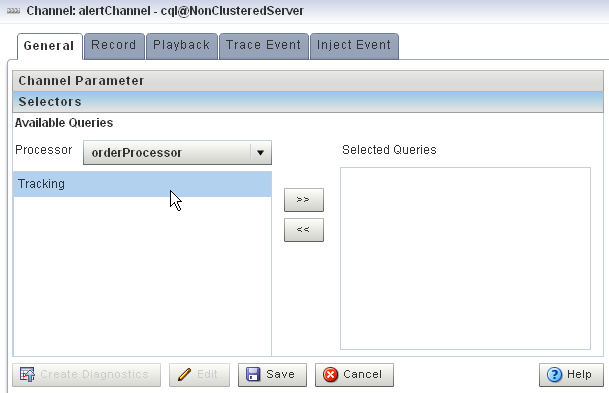
4.2.1.3 Channel Properties: Outbound Channel With Query Selector
Figure 4-6 shows the General tab for a channel stage with an upstream Oracle CQL processor. The Selectors accordion tab is selected.
Figure 4-6 General Tab Selectors for Outbound Channel Stage
Description of "Figure 4-6 General Tab Selectors for Outbound Channel Stage "
The Selector tab is only applicable if the up-stream node is an Oracle CQL processor.
After you click Edit, use the Selector tab, you can specify which up-stream Oracle CQL processor queries are permitted to output their results to the channel:
-
Select an up-stream Oracle CQL processor from the Processor pull-down menu.
The available Oracle CQL rules associated with the selected processor are listed below the pull-down menu.
-
Use the left and right-pointing arrow buttons to move one or more rules to the Selected Queries list.
Only rules in the Selected Queries list will output events to the channel.
Note:
You must add a query to the upstream Oracle CQL processor before you can add the query name to the channel selector. For more information, see Create a Rule with the Query Wizard.
For more information, see Channel Properties: Outbound Channel.
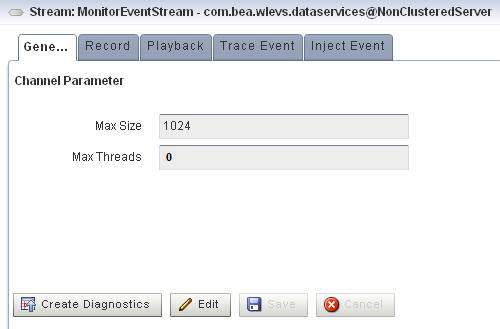
4.2.1.4 Stream Properties
Figure 4-7 shows the General tab for a stream stage.
After you click Edit, you can modify the attributes that are not shaded grey. Table 4-3 describes all the attributes on the General tab for this stage.
|
Table 4-3 General Tab Properties: Stream
|
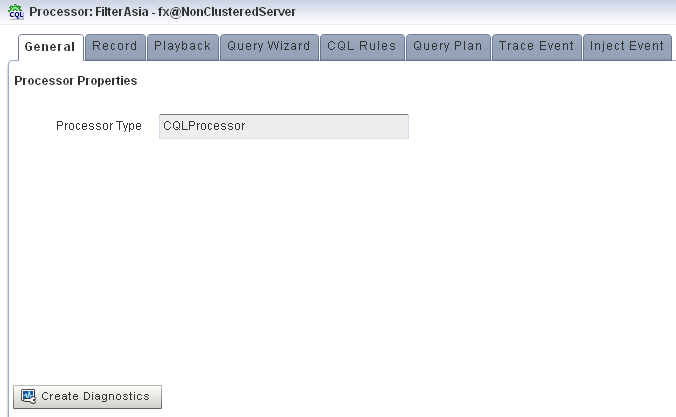
4.2.1.5 Oracle CQL Processor Properties
Figure 4-8 shows the General tab for an Oracle CQL processor stage.
Figure 4-8 General Tab for Oracle CQL Processor Stage
Description of "Figure 4-8 General Tab for Oracle CQL Processor Stage"
There are no editable properties for this type of stage.
4.2.1.6 Adapter Properties
Figure 4-9 shows the General tab for an adapter stage.
Figure 4-9 General Tab for an Adapter Stage
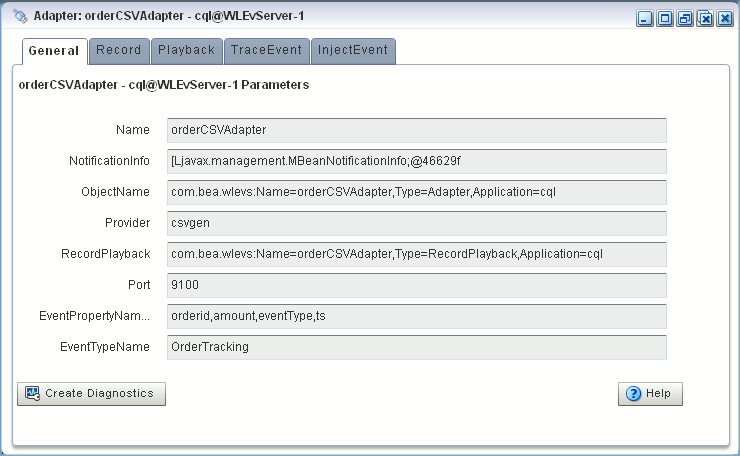
Description of "Figure 4-9 General Tab for an Adapter Stage"
There are no editable properties for this type of stage.
4.2.1.7 JMS Adapter Properties
Figure 4-10 shows the General tab for a JMS adapter.
Figure 4-10 General Tab for a JMS Adapter Stage
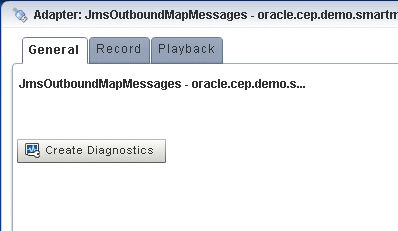
Description of "Figure 4-10 General Tab for a JMS Adapter Stage"
There are no editable properties for this type of stage.
4.2.1.8 High Availability Input Adapter Properties
Figure 4-11 shows the General tab for an Oracle Stream Analytics high availability input adapter.
Figure 4-11 General Tab for an Oracle Stream Analytics High Availability Input Adapter Stage
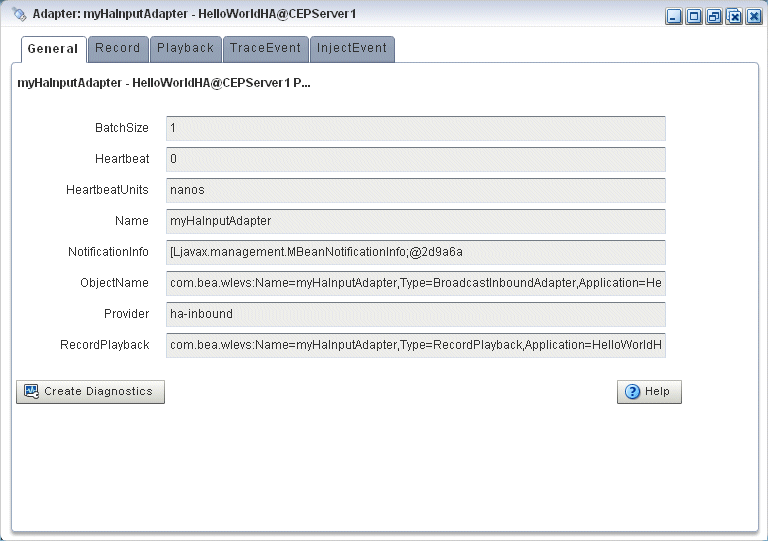
Description of "Figure 4-11 General Tab for an Oracle Stream Analytics High Availability Input Adapter Stage"
There are no editable properties for this type of stage.
4.2.1.9 High Availability Buffering Output Adapter Properties
Figure 4-12 shows the General tab for an Oracle Stream Analytics high availability buffering output adapter.
Figure 4-12 General Tab for an Oracle Stream Analytics High Availability Buffering Output Adapter Stage
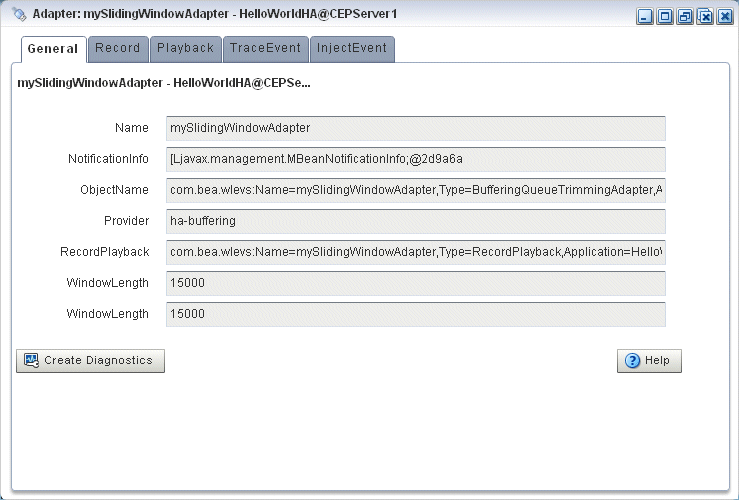
Description of "Figure 4-12 General Tab for an Oracle Stream Analytics High Availability Buffering Output Adapter Stage"
There are no editable properties for this type of stage.
4.2.1.10 High Availability Broadcast Output Adapter Properties
Figure 4-13 shows the General tab for an Oracle Stream Analytics high availability broadcast output adapter.
Figure 4-13 General Tab for a High Availability Broadcast Output Adapter Stage
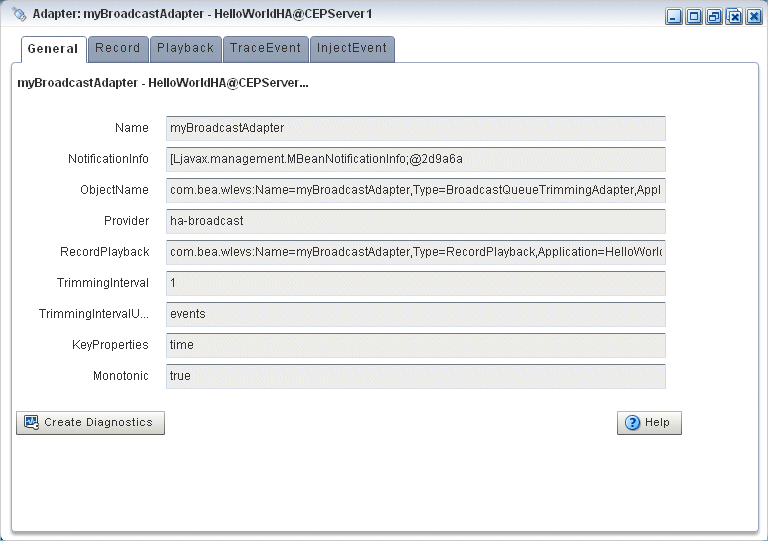
Description of "Figure 4-13 General Tab for a High Availability Broadcast Output Adapter Stage"
There are no editable properties for this type of stage.
4.2.1.11 High Availability Correlating Output Adapter Properties
Figure 4-14 shows the General tab for an Oracle Stream Analytics high availability correlating output adapter.
Figure 4-14 General Tab for an Oracle Stream Analytics High Availability Correlating Output Adapter Stage
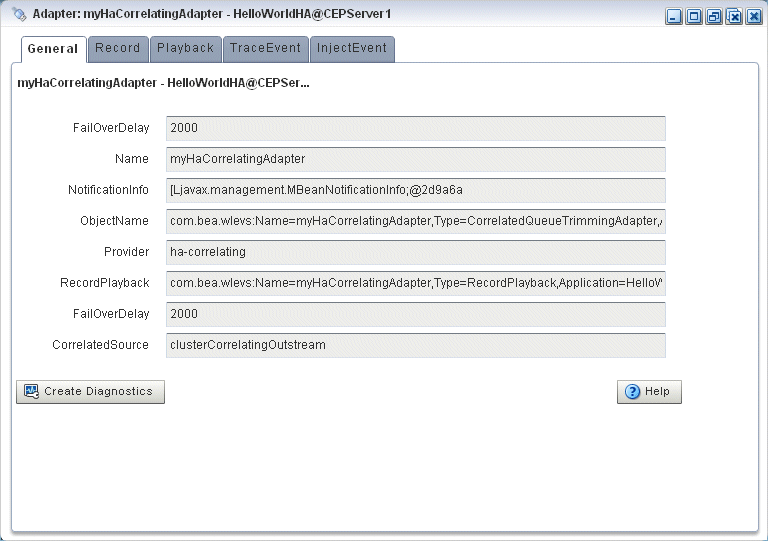
Description of "Figure 4-14 General Tab for an Oracle Stream Analytics High Availability Correlating Output Adapter Stage"
There are no editable properties for this type of stage.
4.2.1.12 Event Bean Properties
Figure 4-15 shows the General tab for an event bean stage.
Figure 4-15 General Tab for Event Bean Stage
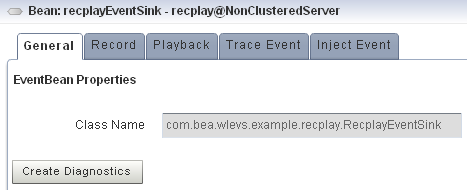
Description of "Figure 4-15 General Tab for Event Bean Stage"
There are no editable properties for this type of stage.
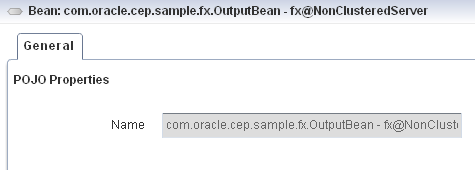
4.2.1.13 POJO Properties
Figure 4-16 shows the General tab for a Plain Old Java Object (POJO) stage.
There are no editable properties for this type of stage.
4.2.1.14 Cache Properties: Oracle Coherence Cache
Figure 4-17 shows the properties for an Oracle Coherence Cache stage.
Figure 4-17 Oracle Coherence Cache Stage Properties
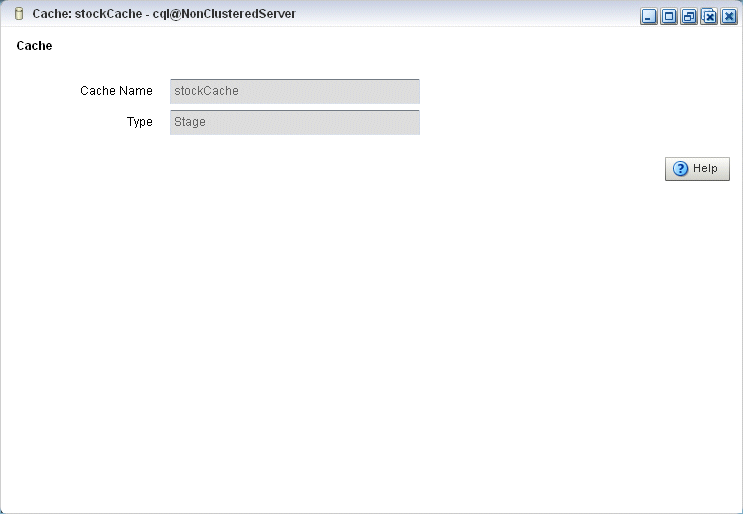
Description of "Figure 4-17 Oracle Coherence Cache Stage Properties"
There are no editable properties for this type of stage.
For more information, see Multiserver Domains.
4.2.1.15 Cache Properties: Oracle Stream Analytics Local Cache
Figure 4-18 shows the properties for an Oracle Stream Analytics Local Cache stage.
Figure 4-18 Oracle Stream Analytics Local Cache Stage Properties
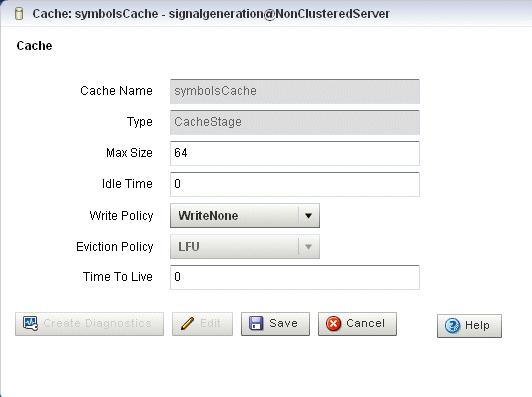
Description of "Figure 4-18 Oracle Stream Analytics Local Cache Stage Properties"
After you click Edit, you can modify the attributes that are not shaded grey. Table 4-4 describes all the attributes on the General tab for this stage.
|
Table 4-4 Properties: Oracle Stream Analytics Local Cache
|
4.3 Record and Play Back Events in the EPN
The event repository feature of Oracle Stream Analytics allows you to record events flowing through an event processing network (EPN) and store them so you can later play back the events. You configure the recording and playing back of events per stage, such as a processor or stream. Additionally, only events coming out of an event source can be recorded, and playback is possible only on event sinks (events are played back to the inbound side of the event sink stage.)
The only configuration options of record and playback that you can control using Oracle Stream Analytics Visualizer are event type, time, and speed.
Alternatively, you can trace and inject events as Trace and Inject Events in the EPN describes.
This section describes:
4.3.1 How to Record Events
Using Oracle Stream Analytics Visualizer you can record events for a selected stage. Later, you can playback these events (see Play Back Events).
To record events:
-
In the left pane, navigate to and expand the Applications node of the Oracle Stream Analytics server instance to which the application is deployed.
-
Select appname, where appname is the name of the application you want to record and playback events with.
-
In the right pane, click the Event Processing Network tab.
The Event Processor Network panel is displayed as Figure 4-19 shows.
Figure 4-19 Event Processing Network Panel

Description of "Figure 4-19 Event Processing Network Panel" -
Select the stage for which you wish to record an event:
-
To use the EPN diagram:
-
Right-click the stage for which you wish to record an event and select Record Event.
-
-
To use the domain tree:
-
Expand the appname > Stages node, where appname is the name of the application you want to record and playback events with.
-
Click the stage for which you wish to record an event.
-
In the right pane, click the Record tab
-
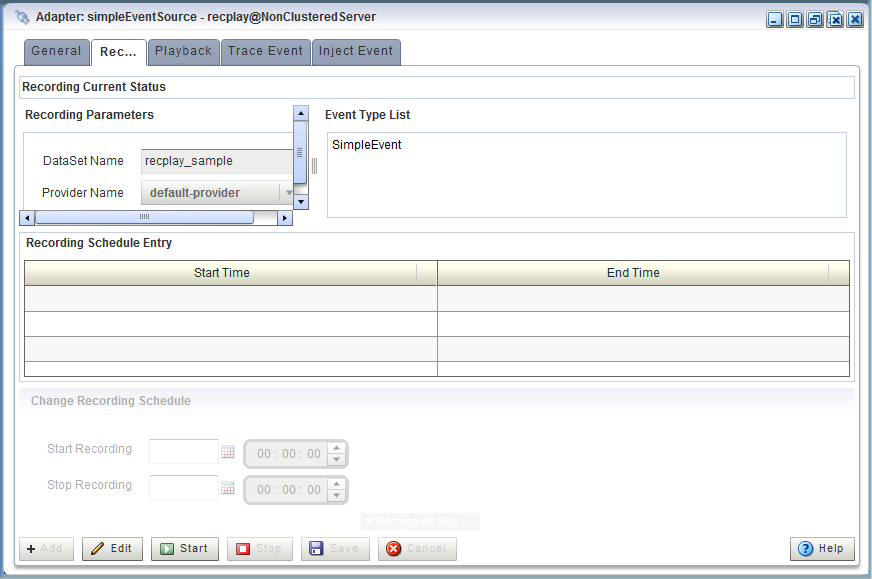
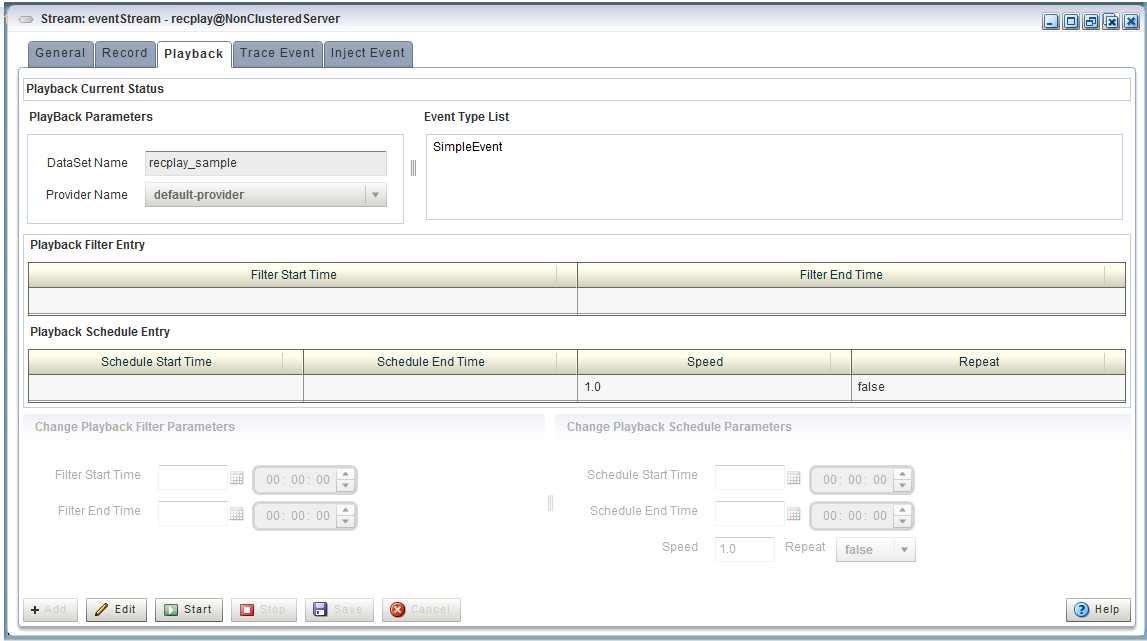
The Record panel appears as shown in Figure 4-20.
The Record tab in Oracle Stream Analytics Visualizer for a particular stage is divided into the following sections:
-
Recording Current Status: displays the current status of a recording. When the system has begun a recording session, then this field displays a blinking Recording message and it changes back to blank when the recording sessions ends. This section is read-only.
-
Recording Parameters: specifies the name of the database schema (Dataset name) and the provider information. You must pre-configure the provider for the event repository.
For more information, see:
-
Event Type List: contains the Event Type List pane that displays the list of event types that are associated with a selected stage of the Oracle Stream Analytics application. Choose one or more event types to record.
-
Record Schedule Entry: entries in this table display the recording start time and end time. The start and end time entries are optional fields. To start recording immediately, click the Start button at the bottom of the panel.
-
Change Recording Schedule: allows you to specify and change the start time and end time of the recording using the calendar and clock controls.
-
-
Decide what you want to do:
-
To add a new record entry, click Add.
-
To modify an existing record, click Edit.
-
To delete an existing record schedule entry:
In the Recording Schedule Entry table, select the entry and click Edit.
Under Change Recording Schedule, click Clear Schedule button.
Click Save.
-
-
Configure the Recording Parameters:
-
DataSet Name: the value of therecord-parameterschild elementdataset-nameelement from thesimpleEventSourceadapter application configuration file/Oracle/Middleware/my_oep/oep/examples/ domains/recplay_domain/defaultserver/applications/ recplay/config.xml.<adapter> <name>simpleEventSource</name> <record-parameters> <dataset-name>recplay_sample</dataset-name> <event-type-list> <event-type>SimpleEvent</event-type> </event-type-list> <provider-name>test-rdbms-provider</provider-name> <batch-size>1</batch-size> <batch-time-out>10</batch-time-out> </record-parameters> </adapter> -
Provider Name: the value of therdbms-event-store-providerchild elementnamewhich corresponds to thedata-sourcechild element.When using the default Berkeley database provider, select
default provider.<data-source> <name>derby1</name> <connection-pool-params> <initial-capacity>15</initial-capacity> <max-capacity>50</max-capacity> </connection-pool-params> <driver-params> <url>jdbc:derby:dbtest1;create=true</url> <driver-name>org.apache.derby.jdbc.EmbeddedDriver</driver-name> </driver-params> </data-source> <rdbms-event-store-provider> <name>test-rdbms-provider</name> <data-source-name>derby1</data-source-name> </rdbms-event-store-provider>For more information, see Data Source Configuration.
-
-
Configure the Event type list:
Use the left and right-pointing arrow buttons to move the events you want recorded from the Available event list to the Recorded event list.
For more information, see Event Type Repository.
-
Decide when you want recording to start and end:
-
If you want to schedule a record start and end time:
-
Click the calendar and clock controls to add a start time and end time.
-
Click Save.
An alert dialog appears as Figure 4-21 shows.
Figure 4-21 Record Schedule Confirmation Dialog

Description of "Figure 4-21 Record Schedule Confirmation Dialog" -
Click OK.
-
-
If you want to record events immediately:
-
Click Save.
An alert dialog appears as Figure 4-22 shows.
Figure 4-22 Record Schedule Confirmation Dialog

Description of "Figure 4-22 Record Schedule Confirmation Dialog" -
Click OK.
-
Click Start.
-
Oracle Stream Analytics Visualizer keeps track of whether a particular stage is currently recording or playing back events; based on this information, the Start and End buttons may be enabled or disabled as appropriate.
When you start recording using Oracle Stream Analytics Visualizer, Oracle Stream Analytics uses the event type information from your record entry and begins recording immediately; the pre-scheduled time, if any, remains unchanged. Use the End button to stop recording of your session immediately.
-
-
Decide when you want to stop recording:
-
If you scheduled a stop time, event recording will stop at that time.
-
If you want to stop event recording immediately, click Stop.
-
4.3.2 Play Back Events
Using Oracle Stream Analytics Visualizer you can playback previously recorded events for a selected stage.
Play Back Events
-
In the left pane, navigate to and expand the Applications node of the Oracle Stream Analytics server instance to which the application is deployed.
-
Select appname, where appname is the name of the application you want to record and playback events with.
-
In the right pane, click the Event Processing Network tab.
The Event Processor Network panel is displayed as Figure 4-23 shows.
Figure 4-23 Event Processing Network Panel

Description of "Figure 4-23 Event Processing Network Panel" -
Select the stage for which you wish to playback an event:
-
To use the EPN diagram:
-
Right-click the stage for which you wish to playback an event and select Playback Event.
-
-
To use the domain tree:
-
Expand the appname > Stages node, where appname is the name of the application you want to record and playback events with.
-
Click the stage for which you wish to playback an event.
-
In the right pane, click the Playback tab
-
The Record panel appears as shown in Figure 4-24.
The Playback tab in Oracle Stream Analytics Visualizer for a particular stage is divided into the following sections:
-
Playback Current Status: displays the current status of playback. When the system has begun playing back a session, then this field displays a blinking Playback message and it changes back to blank when the playback session ends. This section is read-only.
-
Playback Parameters: specifies the name of the database schema (Dataset name) and the provider information. You must pre-configure the provider for the event repository.
For more information, see Persistent Event Store.
-
Event Type List: contains the Event Type List pane that displays the list of event types that are associated with a selected stage of the Oracle Stream Analytics application. Choose one or more event types to playback.
-
Playback Filter Entry: specify a set of filters using the clock and time controls, to run a playback for an event type in event type repository. Only events that were recorded during the start and end times you specify here will be played back.
-
Playback Schedule Entry: entries in this table display the playback start time and end time. The start and end time entries are optional fields. To start a playback immediately, click the Start button at the bottom of the panel.
-
Change Playback Filter Parameters: allows you to change some of the properties of the selected playback filter entry.
-
Change Playback Schedule Parameters: allows you to change some of the properties of the selected playback schedule entry. Use the calendar and clock controls to specify or change an existing start and end time for playing back events.
-
-
Configure the Playback Parameters:
-
DataSet Name: the value of therecord-parameterschild elementdataset-nameelement from theSimpleEventSourceadapter application configuration file/Oracle/Middleware/my_oep/oep/examples/ domains/recplay_domain/defaultserver/applications/ recplay/config.xml.<stream> <name>eventStream</name> <playback-parameters> <dataset-name>recplay_sample</dataset-name> <event-type-list> <event-type>SimpleEvent</event-type> </event-type-list> <provider-name>test-rdbms-provider</provider-name> </playback-parameters> <max-size>10000</max-size> <max-threads>2</max-threads> </stream> -
Provider Name: the value of therdbms-event-store-providerchild elementnamewhich corresponds to thedata-sourcechild elementname.When using the default Berkeley database provider, select
default provider.<data-source> <name>derby1</name> <connection-pool-params> <initial-capacity>15</initial-capacity> <max-capacity>50</max-capacity> </connection-pool-params> <driver-params> <url>jdbc:derby:dbtest1;create=true</url> <driver-name>org.apache.derby.jdbc.EmbeddedDriver</driver-name> </driver-params> </data-source> <rdbms-event-store-provider> <name>test-rdbms-provider</name> <data-source-name>derby1</data-source-name> </rdbms-event-store-provider>For more information, see Data Source Configuration.
-
-
Configure the Event type list:
Use the left and right-pointing arrow buttons to move the events you want played back from the Available event list to the Playback event list.
For more information, see Event Type Repository.
-
Decide what you want to do:
-
To add a new playback entry, click Add.
-
To modify an existing playback, click Edit.
-
To delete an existing playback filter, click Edit, then click Clear Filter under Change Playback Filter Parameters, and click Save.
-
To delete an existing playback schedule, click Edit, click Clear Schedule under Change Playback Schedule Parameters, and click Save.
-
To modify an existing playback filter, click Edit, change the Filter Start Time and End Time using the calender and clock under Change Playback Filter Parameters section, and click Save.
-
To modify an existing playback schedule, click Edit, change the Schedule Start Time and End Time using the calender and clock under Change Playback Schedule Parameters section, and click Save.
-
-
Decide what and when you want playback to be:
-
If you want to create a new playback filter entry:
-
Click the calendar and clock controls in the Change Playback Filter Parameters area to add a start time and end time.
-
Click Save.
An alert dialog appears as Figure 4-25 shows.
Figure 4-25 Playback Schedule Confirmation Dialog

Description of "Figure 4-25 Playback Schedule Confirmation Dialog" -
Click OK.
-
-
If you want to create a new playback schedule entry:
-
Click the calendar and clock controls in the Change Playback Schedule Parameters area to add a start time and end time and to specify a speed and repeat mode.
Speed: the default speed value is 1, which corresponds to normal speed. A value of 2 means that events will be played back 2 times faster than the original record speed. Similarly, a value of 0.5 means that events will be played back at half the speed.
Repeat: set this to
trueto repeat playback until the scheduled end time or until you stop playback manually; set this tofalseto playback only once. -
Click Save.
An alert dialog appears as Figure 4-26 shows.
Figure 4-26 Playback Schedule Confirmation Dialog

Description of "Figure 4-26 Playback Schedule Confirmation Dialog" -
Click OK.
-
-
If you want to playback events immediately:
-
Click Save.
An alert dialog appears as Figure 4-27 shows.
Figure 4-27 Playback Schedule Confirmation Dialog

Description of "Figure 4-27 Playback Schedule Confirmation Dialog" -
Click OK.
-
Click Start.
-
Oracle Stream Analytics Visualizer keeps track of whether a particular stage is currently recording or playing back events; based on this information, the Start and End buttons may be enabled or disabled as appropriate.
When you start playback using Oracle Stream Analytics Visualizer, Oracle Stream Analytics uses the event type information from your playback entry and begins playback immediately; the pre-scheduled time, if any, remains unchanged. Use the End button to stop playback session immediately.
-
-
Decide when you want to stop playback:
-
If you scheduled a stop time, event playback will stop at that time.
-
If you want to stop event playback immediately, click Stop.
-
4.4 Trace and Inject Events in the EPN
Using the Event Inspector service and the stream visualizer, you can:
-
Trace events on any HTTP pub-sub server channel.
-
Trace events on any stage in the EPN on the Event Inspector service dynamic HTTP pub-sub server channel.
-
Inject events to any HTTP pub-sub server channel
-
Inject events into any stage in the EPN using the Event Inspector service dynamic HTTP pub-sub server channel.
Note:
The Event Inspector service is not for use on a production Oracle Stream Analytics server. It is for use only during development.
This section describes:
-
Inject a Simple Event on an Event Inspector Service Dynamic Channel
-
Inject a JSON String Event on an Event Inspector Service Dynamic Channel.
For more information, see:
Alternatively, you can record and playback events as Record and Play Back Events in the EPN describes.
4.4.1 Trace Events on a Dynamic Channel
You can use Oracle Stream Analytics Visualizer to view the messages that are currently being published to a static channel.
For more information, see HTTP Publish-Subscribe Server Management.
Trace Events on a Dynamic Channel
-
Optionally, configure the HTTP pub-sub server to use to trace events.
-
In the left pane, navigate to and expand the Applications node of the Oracle Stream Analytics server instance to which the application is deployed.
-
Select appname, where appname is the name of the application in which you want to trace and inject events.
-
In the right pane, click the Event Processing Network tab.
The Event Processor Network panel is displayed as Figure 4-28 shows.
Figure 4-28 Event Processing Network Panel
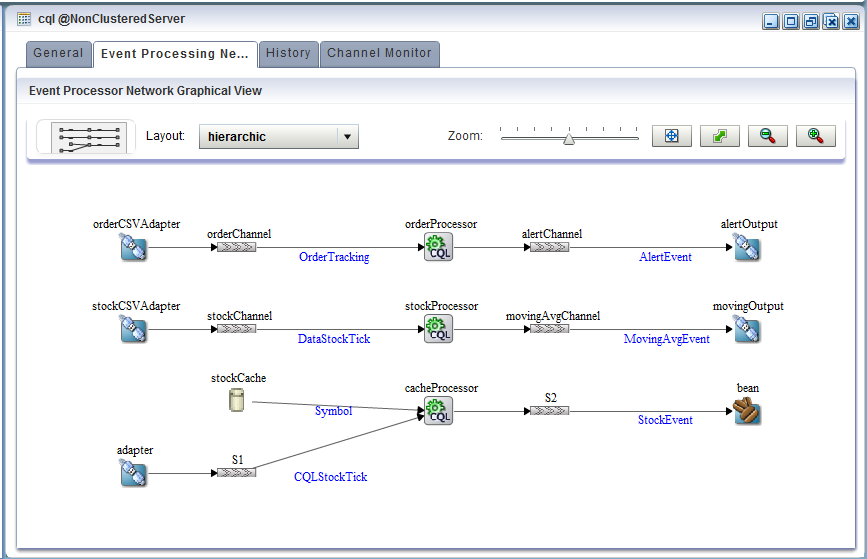
Description of "Figure 4-28 Event Processing Network Panel" -
Select the stage for which you wish to trace events:
-
To use the EPN diagram:
-
Right-click the stage for which you wish to trace events and select Trace Event.
-
-
To use the domain tree:
-
Expand the appname > Stages node, where appname is the name of the application in which you want to trace events.
-
Click the stage for which you wish to trace an event.
-
In the right pane, click the Trace Event tab
-
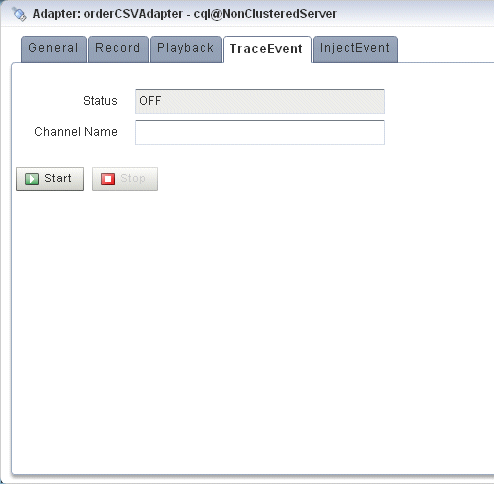
The Trace Event panel appears as shown in Figure 4-29.
-
-
Click Start.
An alert dialog appears as Figure 4-30 shows.
Figure 4-30 Trace Event Confirmation Dialog

Description of "Figure 4-30 Trace Event Confirmation Dialog" -
Click OK.
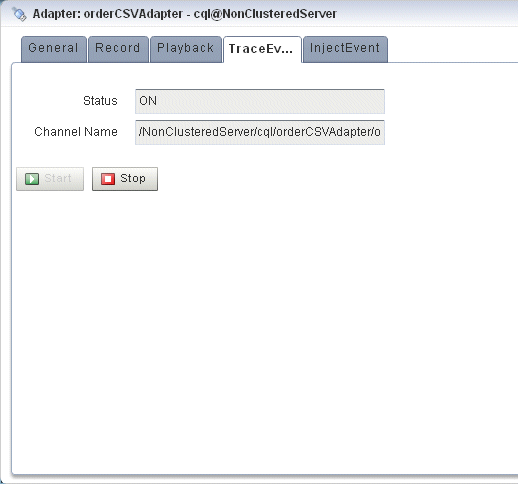
The Status field reads
ON.The Channel Name field shows the dynamic channel on which events passing through this stage are written. The Event Inspector service HTTP pub-sub channel is named:
/SERVERNAME/APPLICATIONNAME/STAGENAME/output
Where:
-
SERVERNAME: the name of the Oracle Stream Analytics server on which the application and stage you want to trace are executing. -
APPLICATIONNAME: the name of the Oracle Stream Analytics application that owns the stage you want to trace. -
STAGENAME: the name of the Oracle Stream Analytics application stage you want to trace.
For example:
/NonClusteredServer/cql/orderCSVAdapter/output. -
-
In the top pane, click ViewStream.
The Stream Visualizer panel appears as Figure 4-31 shows.
Figure 4-31 Stream Visualizer (ViewStream): Subscribe
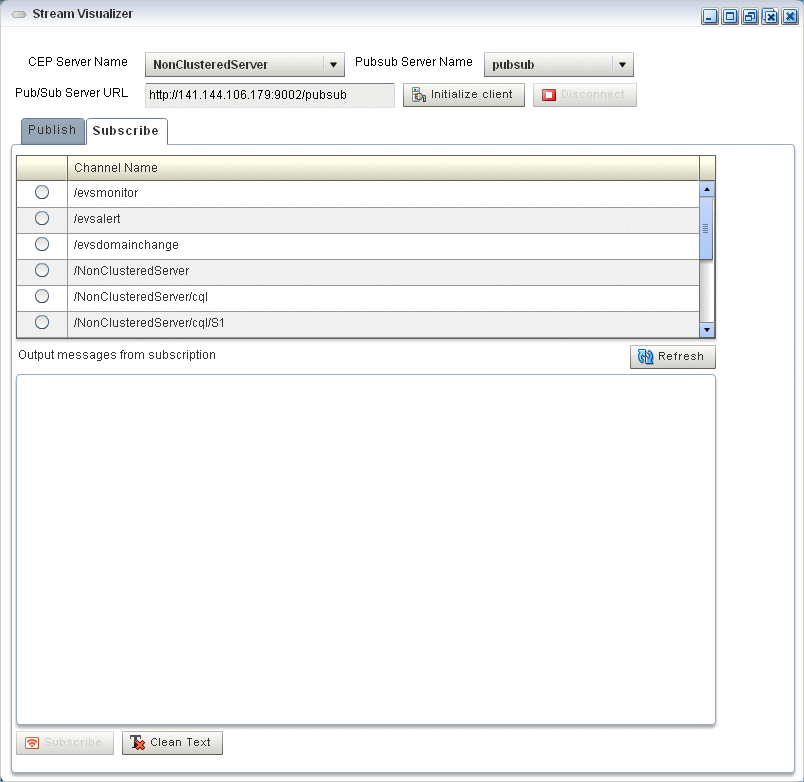
Description of "Figure 4-31 Stream Visualizer (ViewStream): Subscribe" -
In the PubSub Server Name pull down menu, select the name of the HTTP pub-sub server to use to trace events.
-
Click Initialize Client.
-
Select the Subscribe tab.
-
Click Refresh.
The Subscribe tab is refreshed to show the dynamic channel for your stage.
-
Click the radio button next to the name of the channel to which the Oracle Stream Analytics server is publishing messages.
For example:
/NonClusteredServer/cql/orderCSVAdapter/output. -
Click Subscribe.
The Output messages received from subscription text box displays events being published to the channel.
Note:
If the Oracle Stream Analytics Visualizer fails to subscribe to the channel and displays an error in the Debug Messages area such as:
14:25:54 GMT-0400: httpFaultHandler(): [RPC Fault faultString="Error #2096" faultCode="InvokeFailed" faultDetail="null"]
Then, confirm the following:
-
Have you met the Oracle Stream Analytics Visualizer Adobe Flash and browser prerequisites? See Prerequisites.
-
-
To clear the Output messages received from subscription text, click Clear Text.
-
To unsubscribe from the channel, click Unsubscribe.
-
To stop event trace, select the stage you configured to trace events:
-
To use the EPN diagram:
-
Right-click the stage for which you wish to trace an event and select Trace Event.
-
-
To use the domain tree:
-
Expand the appname > Stages node, where appname is the name of the application in which you want to trace and inject events.
-
Click the stage for which you wish to trace an event.
-
In the right pane, click the Trace Event tab
-
The Trace Event panel appears as shown in Figure 4-32.
-
-
Click Stop.
An alert dialog appears as Figure 4-33 shows.
Figure 4-33 Trace Event Stop Confirmation Dialog

Description of "Figure 4-33 Trace Event Stop Confirmation Dialog" -
Click OK.
The Status field reads
OFF.The Channel Name field is blank.
4.4.2 Inject a Simple Event on an Event Inspector Service Dynamic Channel
You can inject a single, simple event by type into any stage in the EPN using the Event Inspector service dynamic channel.
The Oracle Stream Analytics Visualizer only supports simple event types whose properties are all simple Java types without nested Java objects. Event properties must be restricted to the following types:
-
primitive Java types
-
Java array or collection with simple Java type values
-
Date -
BigDecimal -
BigInteger
Alternatively, you can inject an event with more complex properties by specifying the event as a JSON message. For more information, see Inject a JSON String Event on an Event Inspector Service Dynamic Channel.
Note:
The Event Inspector service is not for use on a production Oracle Stream Analytics server. It is for use only during development.
Inject a Simple Event on an Event Inspector Service Dynamic Channel
-
Optionally, configure the HTTP pub-sub server to use to trace events.
-
In the left pane, navigate to and expand the Applications node of the Oracle Stream Analytics server instance to which the application is deployed.
-
Select appname, where appname is the name of the application in which you want to trace and inject events.
-
In the right pane, click the Event Processing Network tab.
The Event Processor Network panel is displayed as Figure 4-34 shows.
Figure 4-34 Event Processing Network Panel

Description of "Figure 4-34 Event Processing Network Panel" -
Select the stage for which you wish to inject events:
-
To use the EPN diagram:
-
Right-click the stage for which you wish to inject an event and select Inject Event.
-
-
To use the domain tree:
-
Expand the appname > Stages node, where appname is the name of the application in which you want to trace and inject events.
-
Click the stage for which you wish to inject an event.
Make sure you select a stage that is an event sink.
-
In the right pane, click the Inject Event tab
-
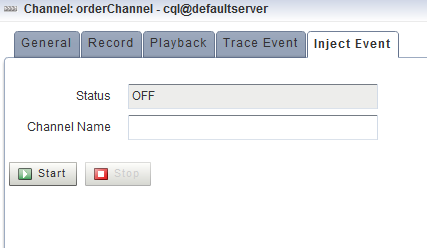
The Inject Event panel appears as shown in Figure 4-35.
-
-
Click Start.
An alert dialog appears as Figure 4-36 shows.
Figure 4-36 Inject Event Start Confirmation Dialog

Description of "Figure 4-36 Inject Event Start Confirmation Dialog" -
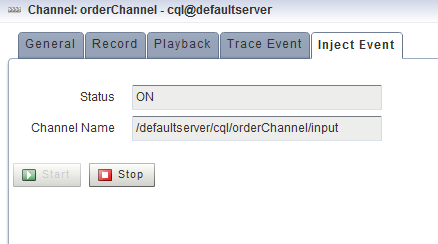
Click OK.
The Status field reads
ON.The Channel Name field shows the dynamic channel on which events passing through this stage are injected. The Event Inspector service HTTP pub-sub channel is named:
/SERVERNAME/APPLICATIONNAME/STAGENAME/input
Where:
-
SERVERNAME: the name of the Oracle Stream Analytics server on which the application and stage you want to trace are executing. -
APPLICATIONNAME: the name of the Oracle Stream Analytics application that owns the stage you want to trace. -
STAGENAME: the name of the Oracle Stream Analytics application stage you want to trace.
For example:
/defaultserver/cql/orderChannel/input. -
-
In the top pane, click ViewStream.
The Stream Visualizer panel appears as Figure 4-37 shows.
Figure 4-37 Stream Visualizer (ViewStream): Publishing Simple Events
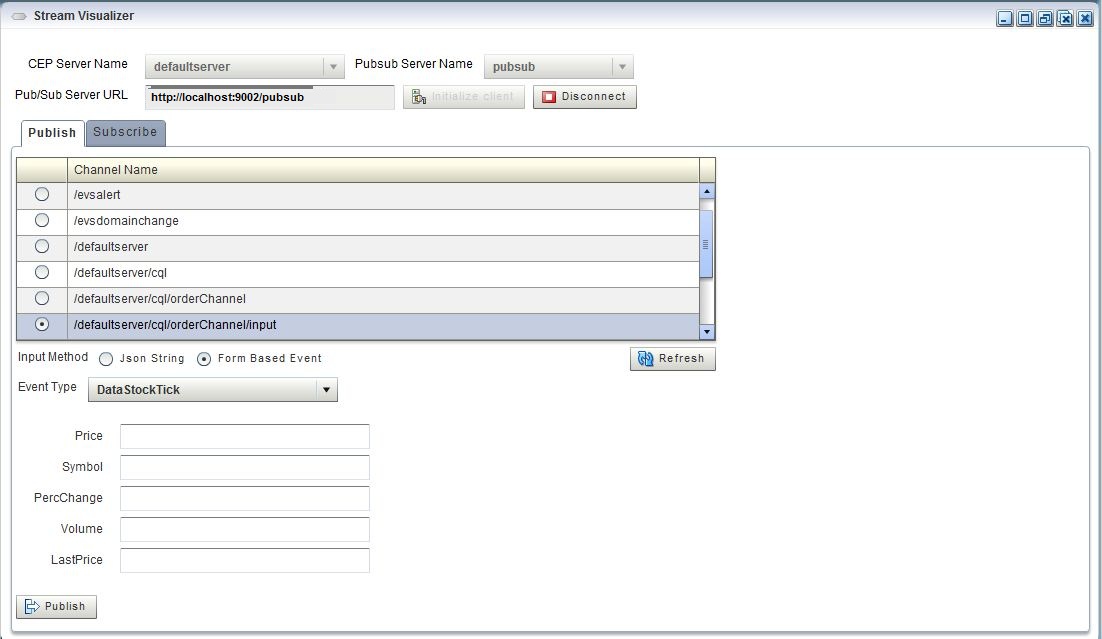
Description of "Figure 4-37 Stream Visualizer (ViewStream): Publishing Simple Events" -
In the PubSub Server Name pull down menu, select the name of the HTTP pub-sub server to use to trace events.
-
Click Initialize Client.
-
Select the Publish tab.
-
Click Refresh.
The Publish tab is refreshed to show the dynamic channel for your stage.
-
Click the radio button next to the name of the channel to which the Oracle Stream Analytics server will inject messages.
For example:
/NonClusteredServer/cql/orderCSVAdapter/output. -
From the Input Method radio button group, select Form Based Event.
-
From the Event Type pull down menu, select an event type.
The View Stream panel updates to list the attributes of the event type you select.
For example, Figure 4-37 shows the attributes for the
DataStockTickevent, which include:-
Price -
Symbol -
PercChange -
Volume -
LastPrice
Note:
The View Stream Event Type pull down menu lists all the events defined in the event type repository that meet the restrictions that Inject a Simple Event on an Event Inspector Service Dynamic Channel describes. To inject a more complex events, see Inject a JSON String Event on an Event Inspector Service Dynamic Channel.
-
-
Configure the attributes for the event type you selected.
Hover your mouse over an attribute field to display a tool tip that indicates the data type for the attribute.
-
Click Publish.
Oracle Stream Analytics Visualizer publishes the event on the Event Inspector service dynamic channel and it is received and processed by the stage that the channel identifies.
-
To stop event injection, select the stage you configured for event injection:
-
To use the EPN diagram:
-
Right-click the stage for which you wish to inject an event and select Inject Event.
-
-
To use the domain tree:
-
Expand the appname > Stages node, where appname is the name of the application in which you want to trace and inject events.
-
Click the stage for which you wish to inject an event.
Make sure you select a stage that is an event sink.
-
In the right pane, click the Inject Event tab
-
The Inject Event panel appears as shown in Figure 4-38.
-
-
Click Stop.
An alert dialog appears as Figure 4-39 shows.
Figure 4-39 Inject Event Stop Confirmation Dialog

Description of "Figure 4-39 Inject Event Stop Confirmation Dialog" -
Click OK.
The Status field reads
OFF.The Channel Name field is blank.
4.4.3 Inject a JSON String Event on an Event Inspector Service Dynamic Channel
You can inject a single event directly to the HTTP pub-sub channel as a JSON-formatted character string. You can use any event property that JSON can represent.
Alternatively, you can inject a simple, pre-existing event. For more information, see Inject a Simple Event on an Event Inspector Service Dynamic Channel.
Note:
The Event Inspector service is not for use on a production Oracle Stream Analytics server. It is for use only during development.
Inject an Event as a JSON String on an Event Inspector Service Dynamic Channel
-
Optionally, configure the HTTP pub-sub server to use to trace events.
-
In the left pane, navigate to and expand the Applications node of the Oracle Stream Analytics server instance to which the application is deployed.
-
Select appname, where appname is the name of the application in which you want to trace and inject events.
-
In the right pane, click the Event Processing Network tab.
The Event Processor Network panel is displayed as Figure 4-40 shows.
Figure 4-40 Event Processing Network Panel

Description of "Figure 4-40 Event Processing Network Panel" -
Select the stage for which you wish to inject events:
-
To use the EPN diagram:
-
Right-click the stage for which you wish to inject an event and select Inject Event.
-
-
To use the domain tree:
-
Expand the appname > Stages node, where appname is the name of the application in which you want to trace and inject events.
-
Click the stage for which you wish to inject an event.
-
In the right pane, click the Inject Event tab
-
The Inject Event panel appears as shown in Figure 4-41.
-
-
Click Start.
An alert dialog appears as Figure 4-42 shows.
Figure 4-42 Inject Event Start Confirmation Dialog

Description of "Figure 4-42 Inject Event Start Confirmation Dialog" -
Click OK.
The Status field reads
ON.The Channel Name field shows the dynamic channel on which events passing through this stage are injected. The Event Inspector service HTTP pub-sub channel is named:
/SERVERNAME/APPLICATIONNAME/STAGENAME/input
Where:
-
SERVERNAME: the name of the Oracle Stream Analytics server on which the application and stage you want to trace are executing. -
APPLICATIONNAME: the name of the Oracle Stream Analytics application that owns the stage you want to trace. -
STAGENAME: the name of the Oracle Stream Analytics application stage you want to trace.
For example:
/NonClusteredServer/cql/orderCSVAdapter/input. -
-
In the top pane, click ViewStream.
The Stream Visualizer panel appears as Figure 4-43 shows.
Figure 4-43 Stream Visualizer (ViewStream): Publishing JSON Events
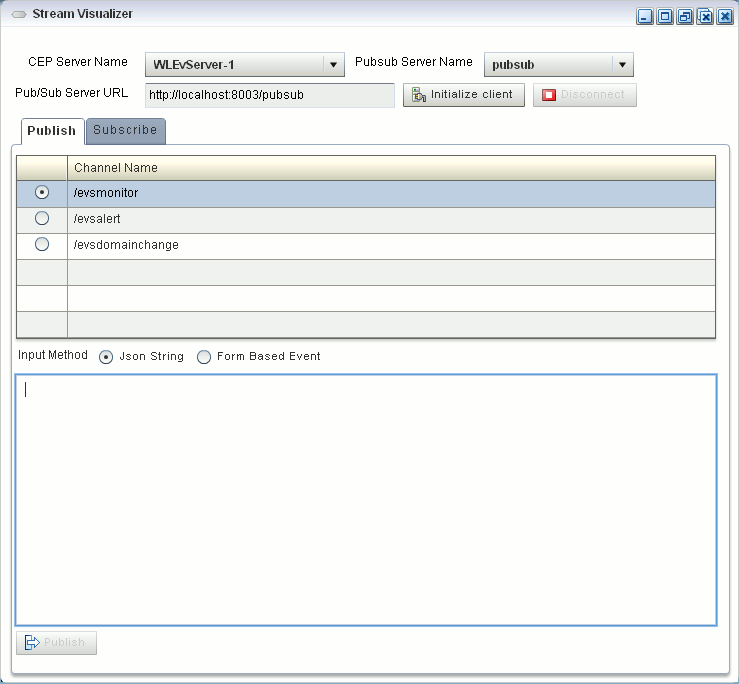
Description of "Figure 4-43 Stream Visualizer (ViewStream): Publishing JSON Events" -
In the PubSub Server Name pull down menu, select the name of the HTTP pub-sub server to use to trace events.
-
Click Initialize Client.
-
Select the Publish tab.
-
Click Refresh.
The Publish tab is refreshed to show the dynamic channel for your stage.
-
Click the radio button next to the name of the channel to which the Oracle Stream Analytics server will inject messages.
For example:
/NonClusteredServer/cql/orderCSVAdapter/output. -
From the Input Method radio button group, select Json String.
-
Enter a JSON-formatted string in the text field.
{ "event-type": "myEventType", "operation": "insert", "binding": "outbound", "value":{ "firstname": "Jane", "lastname": "Doe", "phone": { "code": 12345, "number": "office" }, } } -
Click Publish.
Oracle Stream Analytics Visualizer publishes the event on the Event Inspector service dynamic channel and it is received and processed by the stage that the channel identifies.
-
To stop event injection, select the stage you configured for event injection:
-
To use the EPN diagram:
-
Right-click the stage for which you wish to inject an event and select Inject Event.
-
-
To use the domain tree:
-
Expand the appname > Stages node, where appname is the name of the application in which you want to trace and inject events.
-
Click the stage for which you wish to inject an event.
-
In the right pane, click the Inject Event tab
-
The Inject Event panel appears as shown in Figure 4-44.
-
-
Click Stop.
An alert dialog appears as Figure 4-45 shows.
Figure 4-45 Inject Event Stop Confirmation Dialog

Description of "Figure 4-45 Inject Event Stop Confirmation Dialog" -
Click OK.
The Status field reads
OFF.The Channel Name field is blank.
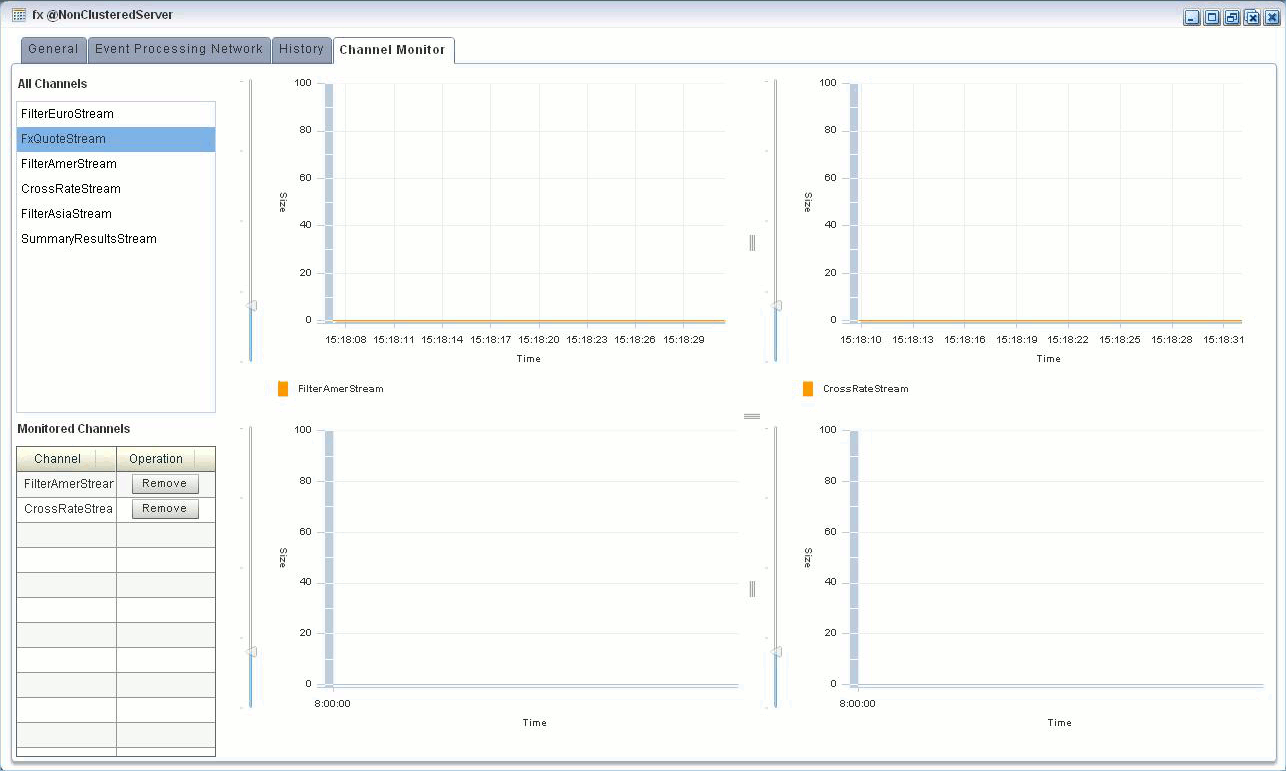
4.5 Monitor a Channel Stage in the EPN
You can use Oracle Stream Analytics Visualizer to monitor any channel stage (stream) of the event processing network (EPN) of an application.
Oracle Stream Analytics defines the size metric so that you can monitor the number of events in the channel queue.
Monitor a Channel in the EPN
4.6 Monitor the Throughput and Latency of an EPN Stage or Path
You can use Oracle Stream Analytics Visualizer to monitor the entry and exit points of a stage, or a specified path, of the event processing network (EPN) of an application. Oracle Stream Analytics defines the following metrics that you can monitor for each stage or path:
-
Throughput: The number of events processed by the stage. -
Average Latency: The average amount of time it takes an event to pass through a specified path of the EPN. -
Maximum Latency: The maximum amount of time it takes an event to pass through a specified path of the EPN. -
Average Latency Threshold: Calculates the average latency values greater than the specified threshold value for specified start and end points.
To Monitor the Throughput and Latency of an EPN Stage or Path
-
In the left pane, navigate to and expand the Applications node of the Oracle Stream Analytics server instance to which the application is deployed.
-
Select appname, where appname is the name of the application for which you want to monitor throughput and latency.
-
Select the stage you wish to view and configure:
-
To use the EPN diagram:
-
Click the Event Processing Network tab.
-
Double-click the stage you wish to monitor or the first stage in the path that you want to monitor.
-
-
To use the domain tree:
-
Expand the appname > Stages node, where appname is the name of the application you want to monitor.
-
Click the stage you wish to monitor or the first stage in the path that you want to monitor.
-
In the right pane, click the General tab
-
The stage's General tab appears. For example, Figure 4-47 shows the General tab for a channel.
Figure 4-47 General Tab for Channel Stage

Description of "Figure 4-47 General Tab for Channel Stage" -
-
Click the Create Diagnostics button.
A New Latency Profile accordion menu appears as shown in Figure 4-48. It contains the following tabs:
-
Profile Information
-
Latency
-
Throughput
-
-
Click the Profile Information tab in the accordion menu as shown in Figure 4-48 and enter the information that Table 4-5 lists.
Figure 4-48 New Latency Profile Screen - Profile Information Tab
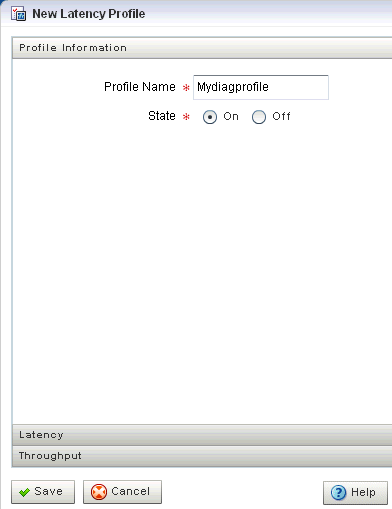
Description of "Figure 4-48 New Latency Profile Screen - Profile Information Tab"Table 4-5 Profile Information Attributes
Attribute Description Profile NameThe name of the diagnostic profile that you want to create.
StateSelect On if you want to enable the profile for immediate use.
Select Off if you do not want to enable the profile for immediate use.
-
Click the Latency tab in the accordion menu as shown in Figure 4-49 and enter the information that Table 4-6 lists.
Figure 4-49 New Latency Profile Screen - Latency Tab
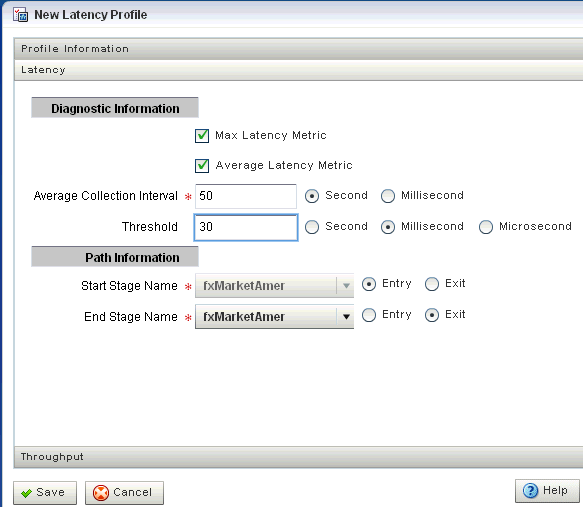
Description of "Figure 4-49 New Latency Profile Screen - Latency Tab"Table 4-6 Latency Attributes
Attribute Description Max Latency MetricSpecifies that you want to monitor the maximum amount of time it takes for events to flow through a stage or a subset of the event processing network (path).
Average Latency MetricSpecifies that you want to monitor the average amount of time it takes for events to flow through a stage or a subset of the event processing network (path)
Average Collection IntervalSpecifies the time interval for which you want to gather diagnostic data. In other words, the sliding window across which the Average Latency Metric is computed.
ThresholdSpecify a value if you are interested in only receiving latency metrics that exceed a certain value. For example, if you would like to know when the latency exceeds 250 ms, specify a
Thresholdvalue of 250 ms.This value is enabled only if you specify Average Latency Metric.
Start Stage NameSpecifies the name that you have provided for the start stage.
If you want to monitor just the current stage, rather than a path in the EPN, then set the Start Stage Name and End Stage Name to the name of the current stage.
Select Entry for the Start Stage Name option and Exit for the End Stage Name.
End Stage NameSpecifies the name that you have provided for the end stage.
If you want to monitor a path in the EPN, Oracle Stream Analytics Visualizer assumes that the current stage is the start of the path, and thus automatically selects it for the Start Stage Name field.
Specify whether the start of the path should be the Entry or Exit of the current stage. Then, select the End Stage Name, or the end of the path you want to monitor, and specify whether the end of the path should be the Entry or Exit of the stage
-
Click the Throughput tab in the accordion menu as shown in Figure 4-50 and enter the information that Table 4-7 lists.
Figure 4-50 New Latency Profile Screen - Throughput Tab
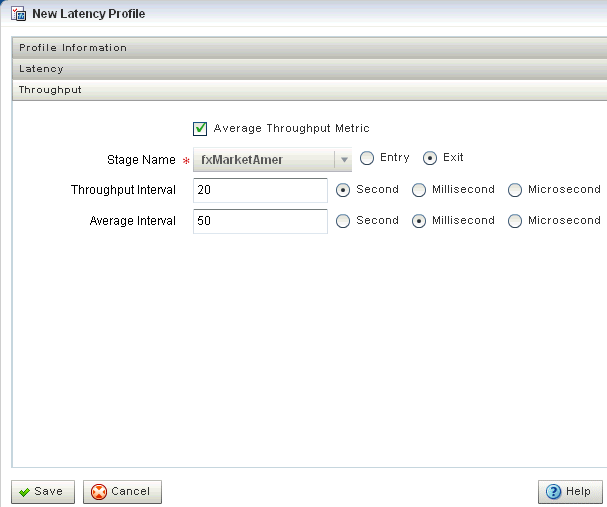
Description of "Figure 4-50 New Latency Profile Screen - Throughput Tab"Table 4-7 Throughput Attributes
Attribute Description Average Throughput MetricSpecifies that you want to monitor the average throughput of events flowing through the stage.
Stage NameSpecify whether you want to monitor the throughput at the entry or exit of the stage
Throughput IntervalSpecifies the period of time for which the throughput is calculated.
For example, if you specify a
Throughput Intervalof 1 second, the number of events passing through the stage in 1 second will be calculated. This will be averaged over theAverage Intervalyou specify.Specify the time unit as Second, Millisecond, or Microsecond.
Average IntervalSpecifies the interval for gathering the average throughput.
For example, if you specify a
Throughput Intervalof 1 second, the number of events passing through the stage in 1 second will be calculated. This will be averaged over theAverage Intervalyou specify.Specify the time unit as Second, Millisecond, or Microsecond.
-
Click Save.
A pop-up confirmation dialog appears in the lower-right corner of the panel.
The saved diagnostic profile appears in the left domain tree, under the stage from which you created it, as shown in Figure 4-51.
Figure 4-51 Left Domain Tree - Mydiagprofile
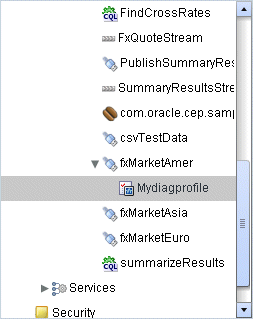
Description of "Figure 4-51 Left Domain Tree - Mydiagprofile"Note:
You can now restart a server or undeploy an application without losing the diagnostic profile you created.
-
Click OK.
-
Add the diagnostic profile to the Oracle Stream Analytics Visualizer Dashboard:
-
Select the diagnostic profile in the left domain tree and click the Add to Dashboard button.
-
Click the Dashboard link at the top of Oracle Stream Analytics Visualizer and drag and drop the diagnostic profile you created from the domain tree in the left pane to the table at the bottom of the right pane.
-
-
Click the Dashboard link at the top of Oracle Stream Analytics Visualizer.
The Dashboard screen is displayed with the Management Events and Performance Monitoring panes as Figure 4-52 shows.
-
Click the name of the diagnostic profile in the table.
The latency and throughput information is displayed in the graphs in the middle of the dashboard as Figure 4-52 shows.
Figure 4-52 Oracle Stream Analytics Visualizer Dashboard With Diagnostic Profiles
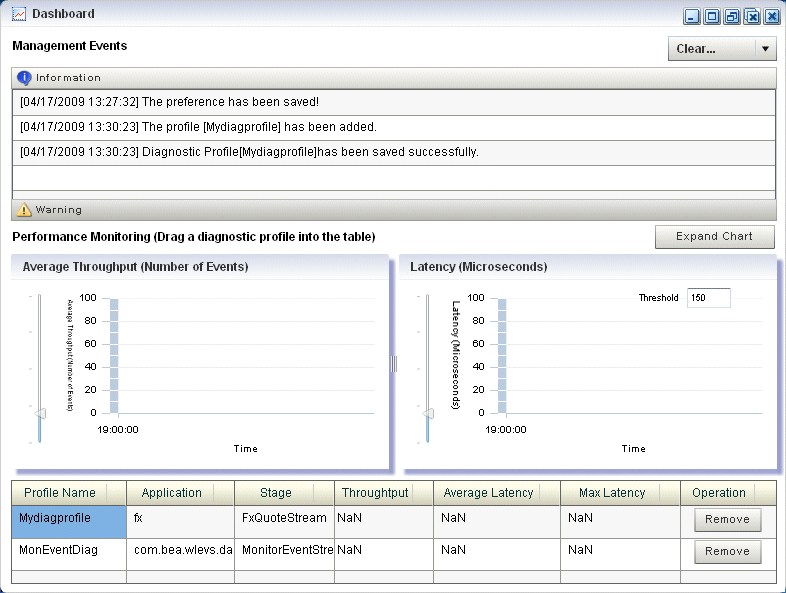
Description of "Figure 4-52 Oracle Stream Analytics Visualizer Dashboard With Diagnostic Profiles" -
To expand the performance monitoring graphs to fill the screen, click Expand Chart.
-
To restore the performance monitoring graphs to their original size, click Restore Chart.
The Management Events section at the top of the Dashboard displays alerts about the incoming monitoring events.
