14 Diagnosing Problems with SOA Composite Applications

This chapter describes how to diagnose Oracle SOA Suite problems early and take the proper corrective actions with the assistance of the WebLogic Diagnostic Framework (WLDF) for monitoring diagnostic scenarios using watches and notifications and the Oracle Fusion Middleware Diagnostic Framework for gathering SOA-specific diagnostic scenarios into data dumps that are formatted for viewing and analyzing.

This chapter includes the following sections:

For information about troubleshooting, see Troubleshooting Oracle SOA Suite and Oracle BPM Suite.

Note:

The information in this chapter applies only to Oracle databases. Your experience may differ if using a non-Oracle database.

14.1 Introduction to the Diagnostic Frameworks

When you monitor and diagnose problems in Oracle SOA Suite, you face the following challenges:

  • Capturing diagnostic data at the moment of occurrence (also known as just-in-time diagnostics), especially for intermittent issues such as obtaining multiple thread dumps when the system hangs or obtaining heap dumps before a system runs out of memory.

  • Obtaining advanced information such as data shape (counts by state and growth patterns for the SOA schema and MDS schema).

  • Communicating back and forth with Oracle Support Services to provide basic information such as versions, logs, configuration files, patches applied, and so on.

  • Detecting problems and taking corrective actions early before they escalate.

To address these challenges, Oracle SOA Suite is integrated with the following diagnostic frameworks that assist you in identifying problems early and taking the proper corrective actions:

  • WLDF: For monitoring diagnostic scenarios using watches and notifications.

  • Diagnostic Framework: For collecting SOA-specific diagnostic information that is formatted for viewing and analysis. These data dumps can be uploaded as part of a Service Request (SR).

14.1.1 Introduction to WLDF

WLDF is a monitoring and diagnostics framework included with Oracle WebLogic Server that defines and implements a set of services that run within server processes and participate in the standard server life cycle.

Using WLDF, you can capture diagnostic data from Oracle SOA Suite. You configure WLDF watches and notifications from Oracle WebLogic Server Administration Console to monitor runtime logs and metrics. This data enables you to isolate and diagnose faults when they occur.

For more information about WLDF, see Configuring and Using the Diagnostics Framework for Oracle WebLogic Server.

14.1.1.1 Introduction to Watches and Notifications

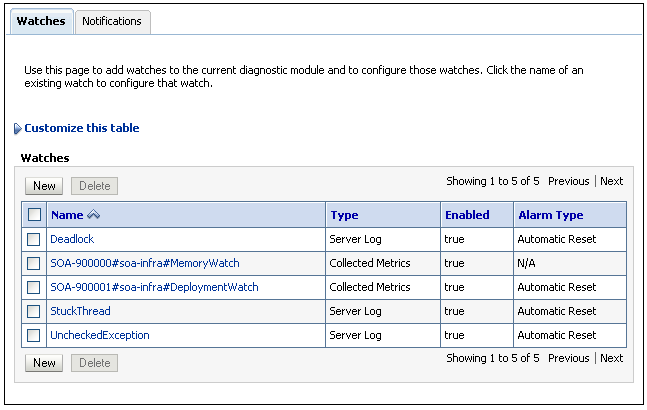
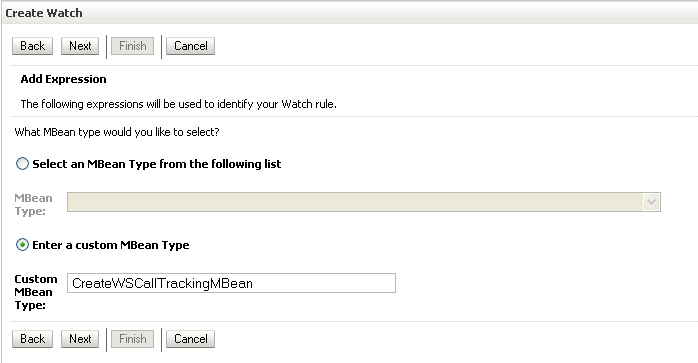
Watches monitor server and application states and send notifications based on criteria that you set. Watches and notifications are configured as part of a diagnostic module targeted to one or more server instances in a domain. When you create a watch, you build rule expressions for monitoring using the attributes of Oracle SOA Suite and Oracle WebLogic Server MBeans in Oracle WebLogic Server Administration Console.

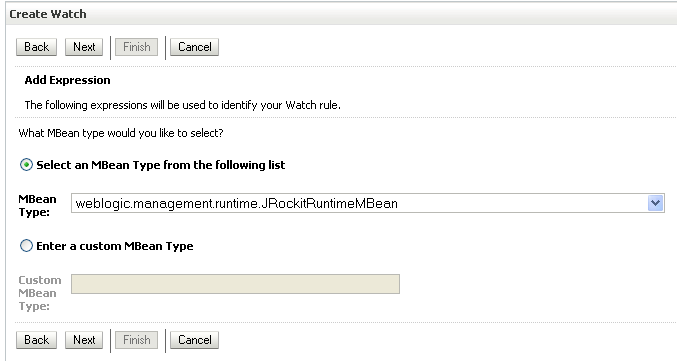
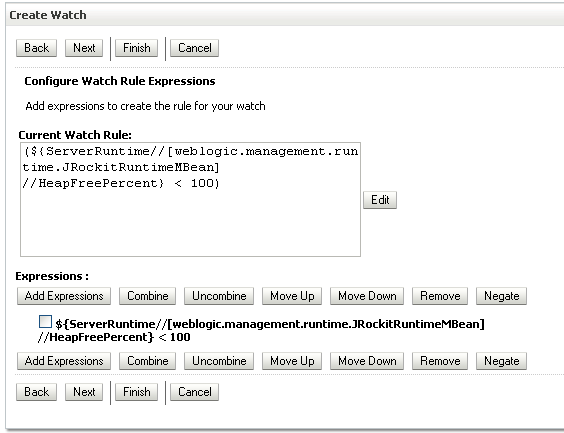
For example, assume you want to be notified when the percentage of free heap memory falls below 25%. You create a watch that uses the Oracle WebLogic Server MBean weblogic.management.runtime.JRockitRuntimeMBean and its attribute HeapFreePercent. You then define logic indicating that when HeapFreePercent is less than 100%, you want to receive a notification. You can also use the MBean JVMRuntimeMBean when running with a non-JRockit virtual machine (VM).

For information about creating watches and notifications in Oracle WebLogic Server Administration Console, see Creating Watches and Notifications and Section "Configuring the Diagnostic Framework" of Administering Oracle Fusion Middleware.

14.1.1.2 Introduction to Diagnostic Scenarios and MBeans

The watch rule expressions that you create use the attributes of Oracle SOA Suite and Oracle WebLogic Server MBeans to collect data and perform monitoring. You diagnose scenarios with available MBeans to provide statistics about that scenario or to log messages. Managed beans (MBeans) are Java objects that represent JMX manageable resources in a distributed environment. The attributes of the following MBeans are available for defining in watches to monitor scenarios:

  • Oracle WebLogic Server MBeans

  • Diagnostic Oracle SOA Suite MBeans

  • Dynamic Monitoring Service (DMS) metrics exposed as MBeans

Oracle SOA Suite provides several diagnostic scenarios that you can monitor with watches and notifications. Table 14-1 provides details about the supported diagnostic scenarios and the MBeans to use for monitoring.

Table 14-1 Supported Diagnostic Scenarios and MBeans

Scenario Description Diagnostic Data Source

Memory issues (startup, deployment, and runtime)

Monitor the free heap available. If the free heap percentage is below a threshold, a notification is triggered to generate a thread stack dump and heap dump.

Oracle WebLogic Server MBean

Deployment hanging

Monitor the elapsed time of a deployment. If it exceeds a threshold, a notification is triggered.

Oracle SOA Suite deployment MBean

Data source issues

Monitor the suspension and connection pool/transaction timeouts

JDBC MBeans

Server overload

Monitor the server's self-health.

Oracle WebLogic Server MBean

Stuck threads

Monitor stuck threads. If any are found, a notification is triggered.

A stuck thread watch/Diagnostic Framework notification is automatically included. Diagnostic Framework incident packages can be created with a tool such as the ADR Command Interpreter (ADRCI). Incidents are created automatically.

Table 14-2 lists some of the available MBeans and DMS Metrics to select when creating watches for monitoring diagnostic data.

Table 14-2 MBeans and DMS Metrics

Diagnostic Data Source (MBean) and Usage Description Oracle WebLogic Server MBean SOA MBean or DMS Metric

weblogic.management.runtime.JVMRuntimeMBean/ weblogic.management.runtime.JRockitRuntimeMBean

For memory statistics

Yes

- -

oracle.fabric.management.wldf.mbean.DeploymentWatchMXBeanImpl

For deployment elapsed time

- -

SOA MBean

weblogic.management.runtime.ServerRuntimeMBean

For health state information

Yes

- -

weblogic.management.runtime.JDBCDataSourceRuntimeMBean

weblogic.management.runtime.JTARuntimeMBean

For JDBC data sources and for accessing transaction runtime characteristics

Yes

- -

For more information about Oracle WebLogic Server MBeans, see MBean Reference for Oracle WebLogic Server.

14.1.2 Introduction to the Diagnostic Framework

The Diagnostic Framework is an Oracle Fusion Middleware feature that aids in detecting, diagnosing, and resolving problems. The problems that are targeted are critical errors such as those caused by code bugs, metadata corruption, customer data corruption, deadlocked threads, and inconsistent state. The Diagnostic Framework detects critical failures and captures dumps of relevant diagnostics information (logs, metrics, server images, and so on). WLDF watches and notifications trigger events for which the Diagnostic Framework listens and generates appropriate data dumps. The dumps are formatted into incident packages for viewing and analysis.

The problems captured as incidents include critical errors such as those described in Table 14-1. Each incident package is identified by a unique ID. When a critical error occurs, it is assigned this unique ID known as an incident number. Diagnostic data for the error (such as log files) is immediately captured and tagged with this number.

The data is then stored in the Automatic Diagnostic Repository (ADR). ADR is a file-system repository for cataloging occurrences of failures and storage of associated diagnostic data. The data is retrieved by incident package number, formatted, viewed with Oracle tools such as ADRCI, and analyzed.

ADRCI enables you to view the names of the dump files. This viewing enables you to investigate problems, and package and upload first-failure diagnostic data to Oracle Support Services.

You can also use the Diagnostic Framework WLST commands to perform the following tasks:

  • Query problems

  • View incident dump files

  • Create manual incidents

  • Manually execute dumps

The Diagnostic Framework is supported on all JRF-supported platforms.

The Diagnostic Framework includes a selection of diagnostic dumps for both Oracle WebLogic Server and Oracle SOA Suite. For information about these dumps, see Section "Investigating, Reporting, and Solving a Problem" of Administering Oracle Fusion Middleware.

In addition to these dumps, several Oracle SOA Suite dumps are also supported. For information about Oracle SOA Suite dumps, see Executing Oracle SOA Suite Diagnostic Dumps.

For more information about solving problems, incidents, and WLDF and Diagnostic Framework integration, see Chapter "Diagnosing Problems" of Administering Oracle Fusion Middleware.

For more information about ADR, see Viewing Incident Packages with ADR Tools.

14.1.2.1 Controlling the Number of Incident Packages

If you have a recurring problem in Oracle SOA Suite, this can cause the creation of multiple incident packages. To prevent the server from being overloaded when many failures are occurring, the Diagnostic Framework automatically flood controls some incidents. To avoid this problem, you can configure the Diagnostic Framework to limit the number of incident packages generated. For more information, see Section "Configuring the Diagnostic Framework" of Administering Oracle Fusion Middleware.

14.1.3 Predefined Incident Processing Rules

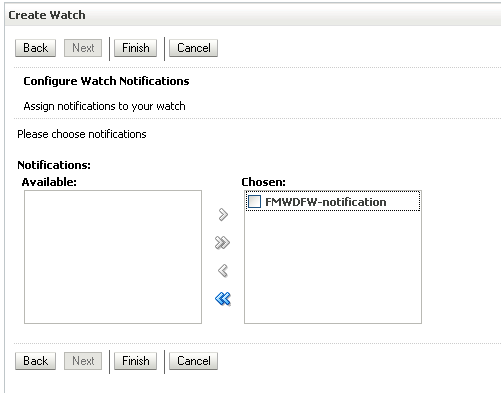
When you create a watch in the Oracle WebLogic Server Administration Console, you also define a notification. A notification named FMWDFW notification is automatically available for selection. While you can create your own notifications, Oracle recommends that you select FMWDFW notification because it creates the Oracle SOA Suite dumps described in Executing Oracle SOA Suite Diagnostic Dumps.

When an error is detected, the FMWDFW notification handler creates an incident and the Diagnostic Framework takes over incident processing semantics. These semantics are controlled by incident processing rules. The incident processing rules are defined in an XML file and loaded and registered with the Diagnostic Framework during SOA Infrastructure startup.

If you encounter scenarios different from those listed in Table 14-1, you must work with Oracle Support Services to obtain a copy of the customized incident processing rules file. You can place the customized rules file (for example, named custom-rules.xml) in either of the following locations.

  • Server level configuration: FMW_HOME/user_projects/domains/domain_name/config/fmwconfig/servers/server_name/dfw

  • Domain level configuration: FMW_HOME/user_projects/domains/domain_name/config/fmwconfig/dfw

The Diagnostic Framework automatically loads the file on server start up. All dumps are registered as system scoped unless an application name is prefixed to the file name:

  • myrules.xml: System scoped. This means the rules file applies to all SOA composite applications in the SOA Infrastructure.

  • application_name#name.xml: Application scoped. Everything before the # is treated as the application name. For a rules file to be associated with an application, that application must have its own deployment in the Oracle WebLogic Server config.xml file. A SOA composite application does not have its own entry as an Oracle WebLogic Server deployment. Therefore, it cannot have a Diagnostic Framework rules file associated with it. For example, myrules.xml is scoped to Oracle WebLogic Server and can only generate root level diagnostic dumps. soa-infra#rules.xml is SOA scoped and can generate SOA diagnostic dumps. Both could generate incidents coming from a SOA composite application error.

In addition, you can dynamically load the rules file into the SOA Infrastructure without restarting the server. A dynamic reload is important because a server restart can disturb the accuracy of the diagnostic data collected.

To dynamically reload the file without restarting the server, enter the following WLST command:

wls:/soainfra/serverConfig> reloadCustomRules(name='rule_file')

The following example shows a sample custom rules file. When an ERROR level message is detected in the *-diagnostic.log from the oracle.soa.bpel.engine.ws module, the soa.composite.trail diagnostic dump is executed. A restart of the system to load the rules actually disturbs the accuracy of diagnostic data collected.

<?xml version="1.0" encoding="UTF-8"?> 
<diagnosticRules xmlns="http://www.oracle.com/DFW/DiagnosticsFrameworkRules/"
 xmlns:xs="http://www.w3.org/2001/XMLSchema-instance"> 
<logDetectionConditions> 
<condition module="oracle.soa.bpel.engine.ws"/> 
</logDetectionConditions> 

<defaultActions> 
<dumpAction name="soa.composite.trail"> 
<argument name="ecid" value="ECID" valueType="Fact" mandatory="true"/> 
</dumpAction> 
</defaultActions> 

</diagnosticRules>

14.2 Executing Oracle SOA Suite Diagnostic Dumps

In addition to the diagnostic dumps available with Oracle WebLogic Server, Oracle SOA Suite supports the creation of the diagnostic dumps shown in Table 14-3.

Table 14-3 Oracle SOA Suite Diagnostic Dumps

Dump Description

soa.env

Runtime environment dumps.

soa.config

Runtime platform configuration dumps.

soa.db

Database dumps.

soa.composite

Deployed composite metadata dumps.

soa.composite.trail

Instance audit trail dumps.

soa.edn

Event dumps.

soa.wsdl

Deployed composite WSDL/schema cache dumps.

bpel.dispatcher

Static dumps (system, invoke, engine, and audit thread counts) and runtime scheduled and working message count dumps.

bpel.apt

Average instance processing time dumps.

bpel.apd

Average instance processing delay dumps (for asynchronous processes).

bpel.sps

Synchronous business processes dump statistics such as minimum, maximum, and average processing time (in milliseconds) and count of instances processed.

bpel.aps

Asynchronous BPEL process dump statistics such as minimum, maximum, and average processing time (in milliseconds) and count of instances processed.

bpel.rs

Request level dump statistics such as minimum, maximum, and average processing time (in milliseconds) and count of requests processed as the request flows though various layers of the BPEL process service engine.

mediator.resequencer

Resequencer group processing delay dumps.

soa.adapter.ra

Adapter connection factory configurations. Use to identify if the same Java Naming and Directory Interface (JNDI) is being used by multiple composites.

soa.adapter.connpool

JCA adapter connection pool statistics and connection pool leaks. The current open connection statistics are displayed, enabling tuning of the connection pool.

soa.adapter.stats

Adapter DMS statistics such as message size and fault count.

The Diagnostic Framework outputs and records the diagnostic dumps. You can list details about all the diagnostic dumps with the WLST listDumps and describeDump commands.

Note:

You must start WLST from MW_HOME/oracle_common/common/bin. Otherwise, the ODF functions are missing.

./wlst.sh

14.2.1 To List the Dumps:

  1. Connect to the managed server on which the SOA Infrastructure is installed.

    wls:/offline>connect('user_name','password','t3://myhost.us.example.com:8001')
    
    Connecting to t3://myhost.us.example.com:8001 with userid user_name ...
    Successfully connected to managed Server "soa_server1" that belongs to domain
    "soainfra".
    
  2. List the Diagnostic Framework dumps.

    wls:/soainfra/serverConfig> listDumps()
    odl.activeLogConfig
    jvm.classhistogram
    dms.ecidctx
    jvm.flightRecording
    wls.image
    odl.logs
    dms.metrics
    odl.quicktrace
    http.requests
    jvm.threads
    
    Use the command describeDump(name=<dumpName>) for help on a specific dump.
    
  3. List the Oracle SOA Suite dumps.

    wls:/soainfra/serverConfig> listDumps(appName='soa-infra')
    
    adf.ADFConfigDiagnosticDump
    adf.ADFConfigPropertiesDump
    bpel.apd
    bpel.apt
    bpel.dispatcher
    mediator.resequencer
    soa.adapter.connpool
    soa.adapter.ra
    soa.adapter.stats
    soa.composite
    soa.composite.trail
    soa.config
    soa.db
    soa.edn
    soa.env
    soa.wsdl
    webservices.servlet
    
    Use the command describeDump(name=<dumpName>) for help on a specific dump.
    

    The Oracle SOA Suite dumps are described in subsequent sections of this chapter.

    For more information about Diagnostic Framework dumps, see Chapter "Managing Log Files and Diagnostic Data" of Administering Oracle Fusion Middleware.

14.2.2 Runtime Environment Diagnostic Dumps (soa.env)

Table 14-4 provides details about runtime environment diagnostic dumps.

Table 14-4 Runtime Environment Diagnostic Dumps

Dump Name Dump Parameters/Dump Mode Information Captured

soa.env

  • Dump parameters:

    None

  • Dump Mode:

    ASYNC_SYNC

  • SOA runtime version, label (can be obtained from the Discovery MBean), and topology (information about the cluster of which the runtime version is a member).

  • Topology: Cluster and Oracle Coherence information such as cluster name, member name, whether the cluster is the leader, local members, machine ID, rack ID, and so on.

    The leader is generally the oldest node in the cluster. This may change over time as members leave and join the cluster. This senior member is responsible for maintaining cluster membership and making other decisions for the cluster. It also acts as the final arbiter in various protocols, such as the panic protocol.

  • Patch inventory

  • Oracle Coherence messaging mode: Either unicast or multicast.

14.2.2.1 WLST Command Dump Description and Execution

  1. Enter the following WLST command line syntax to display a dump description and the available parameters and execute a dump of soa.env.
    wls:/soainfra/serverConfig> describeDump(name='soa.env', appName='soa-infra')
    
    wls:/soainfra/serverConfig> executeDump(name='soa.env', appName='soa-infra')

14.2.3 Runtime Platform Configuration Diagnostic Dumps (soa.config)

Table 14-5 provides details about runtime platform configuration diagnostic dumps.

Table 14-5 Runtime Platform Configuration Diagnostic Dumps

Dump Name Dump Parameters/Dump Mode Information Captured

soa.config

  • Dump parameters:

    zip: (Optional) Supports the following values:

    - true: (Default value) Zips the output file and artifacts into one ZIP file.

    - false: Writes the dump text file and artifacts to the dump path location without compressing them into one ZIP file.

    output: (Optional) Specifies the alternate directory location to which to write dump files. If not specified, the diagnostic dump uses the Diagnostic Framework dump path.

  • Dump Mode:

    ASYNC_SYNC

deployed-composites.xml - A catalog of deployed composites, including their revisions.

Service engine configurations: The following configurations are persisted in MDS (soa/configuration/default/*.xml):

  • adapter-config.xml

  • b2b-config.xml

  • bpel-config.xml

  • bpmn-config.xml

  • businessrules-config.xml

  • cep-config.xml

  • edn-config.xml

  • mediator-config.xml

  • soa-infra-config.xml

  • workflow-config.xml

  • workflow-identity-config.xml

  • workflow-notification-config.xml

14.2.3.1 WLST Command Dump Description and Execution

  1. Enter the following WLST command line syntax to display a dump description and the available parameters and execute a dump of soa.config:
    wls:/soainfra/serverConfig> describeDump(name='soa.config',
    appName='soa-infra')
    
    wls:/soainfra/serverConfig> executeDump(name='soa.config', appName='soa-infra')
    

    The executeDump command dumps deployed-composites.xml from the MDS repository and service engine configurations for all installed service engines into a single, compressed ZIP file (for example, named soa_config364634563344231671.zip).

  2. Enter the following WLST command line syntax to execute a dump of soa.config with the zip parameter set to false. This setting writes the dump text file and artifacts to the dump path location without compressing them into one ZIP file.
    wls:/soainfra/serverConfig> executeDump(name='soa.config', appName='soa-infra',
    args={'zip':'false'})
    
  3. Examine the contents under the default dump path:
    [jdoe@myhost /tmp]$ ls -alR oracle-dfw-7178460573556479044.tmp
    oracle-dfw-7178460573556479044.tmp:
    total 52
    drwxr-----   3 jdoe dba   4096 Oct 24 15:43 .
    drwxrwxrwt 104 root root 36864 Oct 24 15:37 ..
    drwxr-----   4 jdoe dba   4096 Oct 24 15:43 soa_config199325881615155981.d
    -rw-r-----   1 jdoe dba    561 Oct 24 15:43 soa_config199325881615155981.txt
    
    oracle-dfw-7178460573556479044.tmp/soa_config199325881615155981.d:
    total 16
    drwxr----- 4 jdoe dba 4096 Oct 24 15:43 .
    drwxr----- 3 jdoe dba 4096 Oct 24 15:43 ..
    drwxr----- 2 jdoe dba 4096 Oct 24 15:43 deployed-composites
    drwxr----- 2 jdoe dba 4096 Oct 24 15:43 se-configurations
    
    oracle-dfw-7178460573556479044.tmp/soa_
    config199325881615155981.d/deployed-composites:
    total 12
    drwxr----- 2 jdoe dba 4096 Oct 24 15:43 .
    drwxr----- 4 jdoe dba 4096 Oct 24 15:43 ..
    -rw-r----- 1 jdoe dba 1437 Oct 24 15:43 deployed-composites.xml
    
    oracle-dfw-7178460573556479044.tmp/soa_
    config199325881615155981.d/se-configurations:
    total 56
    drwxr----- 2 jdoe dba 4096 Oct 24 15:43 .
    drwxr----- 4 jdoe dba 4096 Oct 24 15:43 ..
    -rw-r----- 1 jdoe dba  267 Oct 24 15:43 adapter-config.xml
    -rw-r----- 1 jdoe dba  425 Oct 24 15:43 b2b-config.xml
    -rw-r----- 1 jdoe dba 2040 Oct 24 15:43 bpel-config.xml
    -rw-r----- 1 jdoe dba 1525 Oct 24 15:43 bpmn-config.xml
    -rw-r----- 1 jdoe dba  895 Oct 24 15:43 businessrules-config.xml
    -rw-r----- 1 jdoe dba  119 Oct 24 15:43 cep-config.xml
    -rw-r----- 1 jdoe dba  215 Oct 24 15:43 edn-config.xml
    -rw-r----- 1 jdoe dba  836 Oct 24 15:43 mediator-config.xml
    -rw-r----- 1 jdoe dba 1148 Oct 24 15:43 soa-infra-config.xml
    -rw-r----- 1 jdoe dba 2693 Oct 24 15:43 workflow-config.xml
    -rw-r----- 1 jdoe dba 2146 Oct 24 15:43 workflow-identity-config.xml
    -rw-r----- 1 jdoe dba  605 Oct 24 15:43 workflow-notification
    
  4. Enter the following WLST command line syntax to execute a dump of soa.config that compresses all dump into a ZIP file in the specified output directory.
    wls:/soainfra/serverConfig> executeDump(name='soa.config', appName='soa-infra'
    ,args={'output':'/home/myhome/CFG_DUMP_DIR_APP_ZIP'})

14.2.4 Database Diagnostic Dumps (soa.db)

Table 14-6 provides details about database diagnostic dumps. The types of database information captured includes data shape information such as counts by state and growth patterns for Oracle SOA Suite schemas and the MDS schema.

Table 14-6 Database Diagnostic Dumps

Dump Name Dump Parameters/Dump Mode Information Captured

soa.db

  • Dump parameters:

    None

  • Dump Mode:

    ASYNC_SYNC

BPEL database table growth data using JDBC-based access to execute the query and dump the result:

SELECT dt.table_name table_name,ds.bytes/1024/1024
segment_size_mb, ds.extents extents_used, dt.num_rows
total_rows, to_char(dt.last_analyzed,'YYYY-MM-DD
HH24:MI:SS') last_analyzed_date FROM dba_segments ds,
dba_tables dt WHERE dt.owner = ds.owner and dt.owner =
'schema_user_name' and dt.tablespace_name = 
ds.tablespace_name and dt.table_name = ds.SEGMENT_NAME 
and ds.segment_type = 'TABLE' and dt.table_name in 
('CUBE_INSTANCE', 'MEDIATOR_CASE_INSTANCE','COMPOSITE_
INSTANCE', 'AUDIT_TRAIL', 'WORK_ITEM', 'DLV_MESSAGE',
'XML_DOCUMENT','DOCUMENT_CI_REF')

14.2.4.1 WLST Command Dump Description and Execution

  1. Enter the following WLST command line syntax to display a dump description and the available parameters and execute a dump of soa.db:
    wls:/soainfra/serverConfig> describeDump(name='soa.db', appName='soa-infra')
    
    wls:/soainfra/serverConfig> executeDump(name='soa.db', appName='soa-infra')
    

    This dump shows the query string and records from the result set.

14.2.5 Deployed Composite Metadata Diagnostic Dumps (soa.composite)

Table 14-7 provides details about deployed composite metadata diagnostic dumps. The types of information captured includes the current composite processed when an incident occurs, MDS artifact references (for example, namespace exports), and abnormal transactions.

Table 14-7 Deployed Composite Metadata Diagnostic Dumps

Dump Name Dump Parameters/Dump Mode Information Captured

soa.composite

  • Dump parameters:

    flowid (Optional): When present, locates the flowtrace.xml file that includes the flow ID. It can be obtained from a dump context if not specified as a dump parameter. The following rules apply for actual parameter evaluation:

    1) If the flow ID is available (as a dump parameter or obtained from a dump context), it retrieves the flow instance and gets the flow trace. It uses the ECID associated with the flow instance to retrieve the remaining dump artifacts.

    2) If the flow ID is unavailable, but the ECID is (as a dump parameter or obtained from a dump context), it is used to look up the flow instance and retrieve the flow trace. It uses the ECID to retrieve other dump artifacts.

    3) If both the flow ID and ECID are available, and the ECID is not equal to the flow's ECID, the ECID is ignored and a warning is displayed. Rule 1 is followed.

    4) If both the flow ID and ECID are not available, an exception error is displayed.

    ecid: (Optional) Matches SOA composite applications associated with the execution context ID (ECID). When ecid is specified, compositeName, partition, and revision are not used. When ecid is not specified, but other parameters are present, those parameters are used to match the composites. When no parameters are specified, an attempt is made to obtain the ECID from the dump context.

    compositeName: (Optional) Composite name that includes MDS recorded artifacts to dump. If a value is not specified (null or blank), compositeName assumes a wild card (*). You can also enter a wild card (*) to match any composite name.

    partition: (Optional) Partition name in which the composite is deployed. If not specified, the partition of the default composite specified in the deployed-composites.xml file is assumed (for example, default, partition_01, and my_partition). A wild card (*) to match any partition is supported.

    revision: (Optional) Composite revision (for example, 1.0) that includes MDS recorded artifacts to dump. If not specified, the default composite revision as specified in deployed-composites.xml is assumed. A wild card (*) to match any revision is supported.

    zip: (Optional) Whether to compress the dump output into a ZIP file. The following values are supported:

    - true: (Default value) Compresses dump files into one ZIP file.

    - false: Writes the dump to a text file and artifacts to the dump path location without compressing them into one ZIP file.

    - output: (Optional) Alternate directory location to which to write dump files. If not specified, the diagnostic dump uses the Diagnostic Framework dump path.

  • Dump Mode:

    ASYNC_SYNC

Per composite metadata from MDS:

  • All the MDS recorded artifacts for the specified composites.

  • The text dump file contains logging information about which composite's MDS artifacts are dumped and to where.

  • All dump files compressed into one ZIP file.

  • User-specified output file location for WLST use.

  • One or more generated scratch_entries.txt files. The scratch_entries.txt file is a per composite file containing a directory listing of the scratch area for that deployed composite. A scratch area for a deployed composite is for holding those artifacts generated when the composite is deployed (for example, the JAXB code generated).

    The location of the scratch area is indicated by the composite-revision element in deployed-composites/deployed-composites.xml.

  • The soa.composite dump calls the soa.adapter.ra dump when the composite has a JCA binding in it. It dumps the connection factory properties under the soa_adapter_ra/ adapter-cf-config-properties.txt file.

14.2.5.1 WLST Command Dump Description and Execution

  1. Enter the following WLST command line syntax to display a dump description and the available parameters and execute a dump of soa.composite:
    wls:/soainfra/serverConfig> describeDump(name='soa.composite'
    , appName='soa-infra')
    
    wls:/soainfra/serverConfig> executeDump(name='soa.composite',
    appName='soa-infra',args={'compositeName':'WSInMedPubBpelSubFileOut',
    'revision':'1.0','partition':'default','output':'/home/myhome/COMPOSITE_DUMP_
    MDS_ZIP'})
    

    A dump output file is created at the specified dump location of /home/myhome/COMPOSITE_DUMP_MDS_ZIP.

    The Location field shows the dump results compressed at the specified location. In the navigator on the left are the MDS artifacts of the ZIP file (for example, the .edl file, .bpel file, and so on). The .txt file at the bottom is the main dump file in the ZIP file.

  2. Enter the following WLST command line syntax to execute a dump of soa.composite that includes all SOA composite applications, revisions, and partitions.
    wls:/soainfra/serverConfig> executeDump(name='soa.composite',
    appName='soa-infra',args={'compositeName':'*',
    'revision':'*','partition':'*','output':'/home/myhome//COMPOSITE_DUMP_
    DIR_ALLCOMP_ALL_REV_ALL_PART'})
    

    The Location field shows the dump result compressed at the specified location.

    All SOA composite applications from all partitions with all revisions are dumped.

14.2.6 Instance Audit Trail Diagnostic Dumps (soa.composite.trail)

Table 14-8 provides details about instance audit trail diagnostic dumps. The type of information captured includes the business flow instance audit trail, individual service component audit trails, faults, and sensors information associated with the message flow identified by the ECID.

Table 14-8 Instance Audit Trail Diagnostic Dumps

Dump Name Dump Parameters/Dump Mode Information Captured

soa.composite.trail

  • Dump parameters:

    flowid (Optional): When present, locates the flowtrace.xml file that includes the flow ID. It can be obtained from a dump context if not specified as a dump parameter. The following rules apply for actual parameter evaluation:

    1) If the flow ID is available (as a dump parameter or obtained from a dump context), it retrieves the flow instance and gets the flow trace. It uses the ECID associated with the flow instance to retrieve the remaining dump artifacts.

    2) If the flow ID is not available, but the ECID is (as a dump parameter or obtained from a dump context), it is used to look up the flow instance and retrieve the flow trace. It uses the ECID to retrieve other dump artifacts.

    3) If both the flow ID and ECID are available, and the ECID is not equal to the flow's ECID, the ECID is ignored and a warning is displayed. Rule 1 is followed.

    4) If both the flow ID and ECID are not available, an exception error is displayed.

    ecid (Optional): The execution content ID for tracking message flow across multiple business flow instances.

  • zip (Optional): The following values are supported:

    - true: (Default value) Compresses dump files into one ZIP file.

    - false: Writes the dump to a text file and artifacts to the dump path location without compressing them into one ZIP file.

  • Dump Mode:

    ASYNC_SYNC

  • The top level audit trail associated with the flow ID or ECID and the audit trails at the business flow instances level. All are written in a file per business flow instance. The main dump file logs entries for each of the individual dump artifacts (for example, for a business flow instance associated with the ECID). The entries are written in the main dump file recording the name, type, created date, location of the dump artifact, and so on (for example, the path to the file where the audit trail raw XML is located).

    This dump is for the execution of message routing triggered by an inbound message.

  • Business flow instances information.

  • Information for each business flow instance.

  • Faults related to the ECID are dumped into a dedicated faults file.

  • Sensor instances information for each business flow instance.

14.2.6.1 WLST Command Dump Description and Execution

  1. Enter the following WLST command line syntax to display a dump description and the available parameters and execute a dump of soa.composite.trail:
    wls:/soainfra/serverConfig> describeDump(name='soa.composite.trail'
    , appName='soa-infra')
    
    wls:/soainfra/serverConfig> executeDump(name='soa.composite.trail',
    appName='soa-infra', args={'flowid':'3','output':'/scratch/myhome/staging_
    area/SOA_TRAIL_12C_DUMP_ZIP/'})
    

    For information about obtaining the ECID, see Monitoring the Flow Trace of a Business Flow Instance.

14.2.7 Event Diagnostic Dumps (soa.edn)

Table 14-9 provides details about event diagnostic dumps. The types of information captured include EDN business event bus status information and EDN database log records.

Table 14-9 Event Diagnostic Dumps

Dump Name Dump Parameters/Dump Mode Information Captured

soa.edn

  • Dump parameters:

    ecid: Dumps the publisher and subscriber information associated with the ECID.

    flowid: Dumps the publisher and subscriber information associated with the flow ID.

  • Dump Mode:

    ASYNC_SYNC

  • Global EDN configuration information such as retry interval, maximum retries, EDN work manager class, EDN work manager JNDI name, default JMS configuration, user-defined event type-to-JMS configuration mappings, current durable flag, current JMS type, current default event priority, EDN bus class, EDN bus status, and others.

  • All publishers information such as composite information, component information, and publisher event information (destination, persistence flag, time to live, priority, and JCA reference information).

  • All subscribers information such as composite information, component information, and subscriber event information (subscriber name, durable flag, event target information, per subscriber poller thread number, event filter, run as role, JCA service information, and others).

All information is written to the dump text file.

14.2.7.1 WLST Command Dump Description and Execution

  1. Enter the following WLST command line syntax to display a dump description and the available parameters and execute a dump of soa.edn.
    wls:/soainfra/serverConfig> describeDump(name='soa.edn', appName='soa-infra')
    
    wls:/soainfra/serverConfig> executeDump(name='soa.edn', appName='soa-infra')
    
  2. Enter the following WLST command with the flowid parameter set. This parameter captures the publisher and subscriber information associated with the flow:
    wls:/soainfra/serverConfig>
    executeDump(name='soa.edn',appName='soa-infra',args={'flowid':'10002'})
    
  3. Enter the following WLST command without the flowid and ecid parameters. Not specifying these parameters lists the publisher and subscriber deployed.
    wls:/soainfra/serverConfig> executeDump(name='soa.edn',appName='soa-infra')

Note:

  • You must have the administrator privilege to enable/disable the edn-db-log.

  • Always disable the edn-db-log after a debugging session to disable logging. This prevents excessive database growth in the EDN database log table. If the edn-db-log remains enabled, then debugging messages related to events that are published/enqueued into the database and subscribed to/dequeued from the database continue to be persisted into certain EDN database log tables. This causes the table to grow indefinitely.

14.2.8 Deployed Composite WSDL/Schema Cache Diagnostic Dumps (soa.wsdl)

Table 14-10 provides details about service definition information cached for composites that match the specified parameters: composite name, partition, and revision.

Table 14-10 Deployed Composite WSDL/Schema Cache Diagnostic Dumps

Dump Name Dump Parameters/Dump Mode Information Captured

soa.wsdl

  • Dump parameters:

    flowid (Optional): When present, locates the flowtrace.xml file that includes the flow ID. It can be obtained from a dump context if not specified as a dump parameter. The following rules apply for actual parameter evaluation:

    1) If the flow ID is available (as a dump parameter or obtained from a dump context), it retrieves the flow instance and gets the flow trace. It uses the ECID associated with the flow instance to retrieve the remaining dump artifacts.

    2) If the flow ID is not available, but the ECID is (as a dump parameter or obtained from a dump context), it is used to look up the flow instance and retrieve the flow trace. It uses the ECID to retrieve other dump artifacts.

    3) If both the flow ID and ECID are available, and the ECID is not equal to the flow's ECID, the ECID is ignored and a warning is displayed. Rule 1 is followed.

    4) If both the flow ID and ECID are not available, an exception error is displayed.

    ecid: (Optional) ECID for tracking message flow across multiple business flow instances. When present, this parameter locates any associated composites. Other composite matching parameters are ignored. The ECID is obtained from the dump context, if not specified as a dump parameter.

    compositeName: (Optional) Composite name that includes key service definition information (WSDLs) to dump, including WSDLs and XSDs referenced. If a value is not specified (null or blank), compositeName assumes a wild card (*). A wild card (*) to match any composite is supported.

    partition: (Optional) Partition name in which the composite is deployed. If not specified, the default composite's partition specified in the deployed-composites.xml file is assumed. A wild card (*) to match any partition is supported.

    revision: (Optional) Composite revision (for example, 1.0) that includes the service definition information (from WSDLs) to dump. If not specified, the revision of the default composite as specified in the deployed-composites.xml file is assumed. A wild card (*) to match any revision is supported.

  • Dump Mode:

    ASYNC_SYNC

  • Composite distinguished name (DN). For example: compositeDN:partition_1/WSInMedPubBpelSubFileOut!1.0*soa_8a169ab1-395a-4b87-9986-9fa2742a8bd3.

  • Is it the default in the series.

  • Composite name.

  • Composite state (on or off).

  • Composite mode (active or retired).

  • The qualified name and the target namespace for all service definitions (including those from shared WSDLs): javax.wsdl.Definition objects:

    - Service name: QName javax.wsdl.Definition.getQName()

    - Target namespace: javax.wsdl.Definition.getTargetNamespace()

  • SchemaManager state variables:

    - SchemaManager.isPostDeploy()

    - SchemaManager.isShared()

    - SchemaManager.schemaAddedSinceLast Build()

  • XML schema definitions referenced by service definitions:

    - The message type QName

    - The message type SchemaTargetNamespace

    - The message type TargetNS

14.2.8.1 WLST Command Dump Description and Execution

  1. Enter the following WLST command line syntax to display a dump description and the available parameters and execute a dump of soa.wsdl:
    wls:/soainfra/serverConfig> describeDump(name='soa.wsdl', appName='soa-infra')
    
    wls:/soainfra/serverConfig> executeDump(name='soa.wsdl', appName='soa-infra'
    ,arg=('compositeName':'WSInMedPubBpelSubFileOut',
    'revision':'1.0','partition':'partition_1'})

14.2.9 Dispatcher Static Configuration Diagnostic Dumps (bpel.dispatcher)

Table 14-11 provides details about dispatcher static configuration diagnostic dumps.

Table 14-11 Dispatcher Static Configuration Diagnostic Dumps

Dump Name Dump Parameters/Dump Mode Information Captured

bpel.dispatcher

  • Dump parameters:

    format: (Optional) Specify a value of xml to display dump diagnostics output in XML format.

  • Dump Mode:

    ASYNC_SYNC

    It is safe to mark this SOA diagnostic dump as ASYNC_SYNC if the dump can be executed as follows: (1) In the thread context of an incident (synchronous) and (2) Not in the context of the incident, but still produces diagnostic information.

Static pool configurations (dispatcher configurations)

  • Audit, invoke, and nonblocking invoke thread counts

  • Engine and system threads

Runtime message queue sizes:

  • Total scheduled (messages in the queue awaiting processing) message counts

  • Total working (messages currently being processed) message counts

Runtime message queue breakdown sizes (total processed and erred messages, and average message pending and execution time):

  • Audit queue

  • Engine queue

  • Invoke queue

  • Nonblocking invoke queue

  • System queue

14.2.9.1 WLST Command Dump Description and Execution

In addition to the WLST command described in this section, you can also obtain dispatcher static configuration diagnostic information through the System MBean Browser. This option enables you to obtain more specific details about invoke queue, delivery queue, and instance queue scheduled and working messages. For more information, see Obtaining Dispatcher Static Configuration Diagnostic Dumps with the System MBean Browser.

  1. Enter the following WLST command line syntax to display a dump description and execute a dump of bpel.dispatcher:
    wls:/soainfra/serverConfig> describeDump(name='bpel.dispatcher', appName='soa-infra')
    
    wls:/soainfra/serverConfig> executeDump(name='bpel.dispatcher', appName='soa-infra')
    
  2. Enter the following WLST command line syntax to execute a dump of bpel.dispatcher in XML format:
    executeDump(name='bpel.dispatcher', appName='soa-infra', args={'format':'xml'})

14.2.9.2 Obtaining Dispatcher Static Configuration Diagnostic Dumps with the System MBean Browser

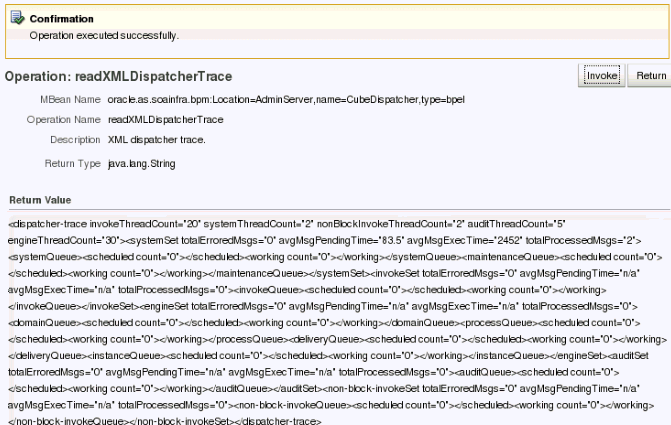
You can also display dispatcher static configuration diagnostic dumps in the System MBean Browser by invoking the readXMLDispatcherTrace property. This option enables you to obtain more specific details about invoke queue, delivery queue, and instance queue messages currently being processed or scheduled to be processed than you receive with the WLST executeDump command described in WLST Command Dump Description and Execution.

  1. In the navigation tree, expand the SOA folder.
  2. Right-click soa-infra, and select Administration > System MBean Browser.
  3. Select Application Defined MBeans > oracle.as.soainfra.bpm > Server: server_name > bpel > CubeDispatcher.
  4. Click readXMLDispatcherTrace.
  5. Click Invoke.

14.2.10 Average Instance Processing Time Diagnostic Dumps (bpel.apt)

Table 14-12 provides details about average instance processing time diagnostic dumps. This information is obtained from the creation and last modified timestamp for the instance persisted in the BPEL process service engine.

Table 14-12 Average Instance Processing Time Diagnostic Dumps

Dump Name Dump Parameters/Dump Mode Information Captured

bpel.apt

  • Dump parameters:

    format: (Optional) Specify a value of xml to display dump diagnostics output in XML format.

  • Dump Mode:

    ASYNC_SYNC

    It is safe to mark this diagnostic dump as ASYNC_SYNC if the dump can be executed as follows: (1) In the thread context of an incident (synchronous) and (2) Not in the context of the incident, but still produces diagnostic information.

The average time that instances for various processes take during execution. This information is obtained from the persistence store and includes the time taken by any partners invoked by the process. The average time is in seconds.

14.2.10.1 WLST Command Dump Description and Execution

  1. Enter the following WLST command line syntax to display a dump description and execute a dump of bpel.apt:
    wls:/soainfra/serverConfig> describeDump(name='bpel.apt', appName='soa-infra')
    
  2. Enter the following WLST command line syntax to execute a dump of bpel.apt in XML format:
    executeDump(name='bpel.apt', appName='soa-infra', args={'format':'xml'})

14.2.11 Average Instance Processing Delay Diagnostic Dumps (bpel.apd)

Table 14-13 provides details about average instance processing delay diagnostic dumps for asynchronous processes. This dump provides the average time taken by the BPEL process service engine to retrieve the persisted message from the database and start processing that message. The statistics are generated from the database and not from in-memory.

Table 14-13 Average Instance Processing Delay Diagnostic Dumps

Dump Name Dump Parameters/Dump Mode Information Captured

bpel.apd

  • Dump parameters:

    format: (Optional) Specify a value of xml to display dump diagnostics output in XML format.

  • Dump Mode:

    ASYNC_SYNC

    It is safe to mark this SOA diagnostic dump as ASYNC_SYNC if the dump can be executed as follows: (1) In the thread context of an incident (synchronous) and (2) Not in the context of the incident, but still produces diagnostic information.

Average invoke processing delay between the receipt of the incoming message that triggers the process instance and the time at which the BPEL service engine actually started processing the message.

Note: The dump described in Average Instance Processing Time Diagnostic Dumps (bpel.apt) provides the total execution time for a process instance, which is a function of the time for processing of activities, and also includes the time that the partner takes (if it involves calling one or more). However, because the incoming message is first stored in the database for asynchronous communications before being processed, more specific details are sometimes required to diagnose system bottlenecks. Therefore, details about the delay in the BPEL process service engine selecting the message from the database is also provided with the bpel.apd dump.

This dump information is generated from the database and not from in-memory. For further details and better analysis about delays at various layers of the BPEL process service engine, see Viewing Low Level Request Breakdown Table Details.

14.2.11.1 WLST Command Dump Description and Execution

Note:

  • Because this dump is executed against the database, the query may run slow if you have very large records.

  • There are no filters for limiting the data to query.

  • The dump runs queries provided as database views external to the normal BPEL process service engine persistence schema. You can tune the view directly and receive better results.

  1. Enter the following WLST command line syntax to display a dump description and execute a dump of bpel.apd:
    wls:/soainfra/serverConfig> describeDump(name='bpel.apd', appName='soa-infra')
    
  2. Enter the following WLST command line syntax to execute a dump of bpel.apd in XML format:
    wls:/soainfra/serverConfig> executeDump(name='bpel.apd', appName='soa-infra', args={'format':'xml'})

14.2.12 Synchronous Process Statistics Diagnostic Dumps (bpel.sps)

Table 14-14 provides details about synchronous process statistics diagnostic dumps. This dump provides the minimum, maximum, and average processing time (in milliseconds) and the count of instances processed. You must configure the StatsLastN System MBean Browser property described in Viewing Low Level Request Breakdown Table Details. to obtain this diagnostic dump. However, if the optional dump parameters duration and buffer are specified and StatsLastN is not configured, this dump command provides statistics for throughput (transactions per second) information.

Table 14-14 Synchronous Process Statistics Diagnostic Dumps

Dump Name Dump Parameters/Dump Mode Information Captured

bpel.sps

  • Dump parameters:

    buffer: (Optional) Specify a value for the buffer range (100-100000).

    duration: (Optional) Specify a value for the time duration (1 - 10000).

    format: (Optional) Specify a value of xml to display dump diagnostics output in XML format.

  • Dump Mode:

    ASYNC_SYNC

The minimum, maximum, and average processing time (in milliseconds) and the count of instances processed for synchronous processes.

14.2.12.1 WLST Command Dump Description and Execution

  1. Enter the following WLST command line syntax to display a dump description and execute a dump of bpel.sps:
    wls:/soainfra/serverConfig> describeDump(name='bpel.sps', appName='soa-infra')
    
  2. Enter the following WLST command line syntax to execute a dump of bpel.sps with StatsLastN configured.
    wls:/soainfra/serverConfig> executeDump(name='bpel.sps',
    appName='soa-infra')
    
  3. Enter the following WLST command line syntax to execute a dump of bpel.sps in XML format with StatsLastN configured.
    wls:/soainfra/serverConfig> executeDump(name='bpel.sps', appName='soa-infra',
    args={'format':'xml'})
    
  4. Enter the following WLST command line syntax to execute a dump of bpel.sps with throughput values for the duration and buffer parameters.
    wls:/soainfra/serverConfig> executeDump(name='bpel.sps', appName='soa-infra',
    args={'duration':'10', 'buffer':'1000'})
    
  5. Enter the following WLST command line syntax to execute a dump of bpel.sps in XML format with throughput values for the duration and buffer parameters and StatsLastN not configured.
    wls:/soainfra/serverConfig> executeDump(name='bpel.sps', appName='soa-infra',
    args={'format':'xml', 'duration':'10', 'buffer':'1000'})

14.2.13 Asynchronous Process Statistics Diagnostic Dumps (bpel.aps)

Table 14-15 provides details about asynchronous process statistics diagnostic dumps. This dump provides process level (asynchronous BPEL processes only) statistics such as minimum, maximum, and average processing time (in milliseconds) and count of instances processed. You must configure the StatsLastN System MBean Browser property described in Viewing Low Level Request Breakdown Table Details. to obtain this output. However, if the optional parameters duration and buffer are specified and StatsLastN is not configured, this dump command provides statistics for throughput (transactions per second) information.

Table 14-15 Asynchronous Process Statistics Diagnostic Dumps

Dump Name Dump Parameters/Dump Mode Information Captured

bpel.aps

  • Dump parameters:

    buffer: (Optional) Specify a value for the buffer range (100-100000).

    duration: (Optional) Specify a value for the time duration (1 - 10000).

    format: (Optional) Specify a value of xml to display dump diagnostics output in XML format.

  • Dump Mode:

    ASYNC_SYNC

The minimum, maximum, and average processing time (in milliseconds) and count of instances processed for asynchronous processes.

14.2.13.1 WLST Command Dump Description and Execution

  1. Enter the following WLST command line syntax to display a dump description and execute a dump of bpel.aps:
    wls:/soainfra/serverConfig> describeDump(name='bpel.aps', appName='soa-infra')
    
  2. Enter the following WLST command line syntax to execute a dump of bpel.aps with StatsLastN configured.
    wls:/soainfra/serverConfig> executeDump(name='bpel.aps',
    appName='soa-infra')
    
  3. Enter the following WLST command line syntax to execute a dump of bpel.aps in XML format with StatsLastN configured:
    executeDump(name='bpel.aps', appName='soa-infra', args={'format':'xml'})
    
  4. Enter the following WLST command line syntax to execute a dump of bpel.aps with throughput values for the duration and buffer parameters.
    wls:/soainfra/serverConfig> executeDump(name='bpel.aps', appName='soa-infra',
    args={'duration':'60', 'buffer':'1000'})
    
  5. Enter the following WLST command line syntax to execute a dump of bpel.aps with throughput values for the duration and buffer parameters in XML format and StatsLastN not configured.
    wls:/soainfra/serverConfig> executeDump(name='bpel.aps', appName='soa-infra',
    args={'format':'xml', 'duration':'60', 'buffer':'1000'})

14.2.14 Request Statistics Diagnostic Dumps (bpel.rs)

Table 14-16 provides details about request diagnostic dumps. This dump provides the minimum, maximum, and average processing time (in milliseconds) and count of requests processed as the request flows though various layers of the BPEL process service engine. You must configure the StatsLastN System MBean Browser property described in Viewing Low Level Request Breakdown Table Details. to obtain this diagnostic dump. However, if the optional dump parameters duration and buffer are specified and StatsLastN is not configured, this dump command provides statistics for throughput (transactions per second) information.

Table 14-16 Request Statistics Diagnostic Dumps

Dump Name Dump Parameters/Dump Mode Information Captured

bpel.rs

  • Dump parameters:

    buffer: (Optional) Specify a value for the buffer range (100 - 100000).

    duration: (Optional) Specify a value for the time duration (1 - 10000).

    format: (Optional) Specify a value of xml to display dump diagnostics output in XML format.

  • Dump Mode:

    ASYNC_SYNC

The minimum, maximum, and average processing time (in milliseconds) and count of requests processed as the request flows though various layers of the BPEL process service engine.

14.2.14.1 WLST Command Dump Description and Execution

  1. Enter the following WLST command line syntax to display a dump description and execute a dump of bpel.rs:
    wls:/soainfra/serverConfig> describeDump(name='bpel.rs', appName='soa-infra')
    
  2. Enter the following WLST command line syntax to execute a dump of bpel.rs with StatsLastN configured.
    wls:/soainfra/serverConfig> executeDump(name='bpel.rs', appName='soa-infra')
    

    or

    wls:/soainfra/serverConfig> executeDump(name='bpel.rs', appName='soa-infra',
    args={'format':'xml'})
    
  3. Enter the following WLST command line syntax to execute a dump of bpel.rs with throughput values for the duration and buffer parameters and StatsLastN not configured.
    wls:/soainfra/serverConfig> executeDump(name='bpel.rs', appName='soa-infra',
    args={'duration':'10', 'buffer':'1000'})
    

    or

    wls:/soainfra/serverConfig> executeDump(name='bpel.rs', appName='soa-infra',
    args={'format':'xml','duration':'10', 'buffer':'1000'})

14.2.15 Resequencer Group Processing Delay Diagnostic Dumps (mediator.resequencer)

Table 14-17 provides details about resequencer group processing delay diagnostic dumps.

Table 14-17 Resequencer Group Processing Delay Diagnostic Dumps

Dump Name Dump Parameters/Dump Mode Information Captured

mediator. resequencer

  • Dump parameter:

    resequencerMaxUnprocessTime: (Required) Specify the number of minutes a resequencer group should be inactive before being included in the diagnostic dump.

  • Dump Mode:

    ASYNC_SYNC

Group information:

  • Component DN (name)

  • Operation

  • Group ID

  • Group status

  • Component status

  • Last received time

  • Container ID

  • Pending message count

  • Last refresh time

Container information:

  • Container ID

  • Resequencer type

14.2.15.1 WLST Command Dump Description and Execution

  1. Enter the following WLST command line syntax to display a dump description of mediator.resequencer:
    wls:/soainfra/serverConfig> describeDump(name='mediator.resequencer',
    appName='soa-infra')
    

    The following information appears:

    Name: mediator.resequencer
    Description: diagnostic information about the groups, which have not been
    processed beyond user specified maximum unprocess time
    Run Mode: asynchronous
    Mandatory Arguments:
    Name                         Type     Description
    resequencerMaxUnprocessTime INTEGER  maximum duration for which the group has
                                         not been processed, duration should be
                                         specified in minutes
    Optional Arguments:
    
  2. Enter the following WLST command line syntax to execute a dump of mediator.resequencer:
    wls:/soainfra/serverConfig> executeDump(name='mediator.resequencer',
    appName='soa-infra', args={'resequencerMaxUnprocessTime':'minutes'}
    

    For minutes, substitute the number of minutes a resequencer group can be pending before it appears in the dump. Information similar to the following appears:

    Database Timestamp in UTC :2012-03-29 06:29:31.0
    Max unprocess time condition:1
    Mediator Resquencer pending group data
    COMPONENT_DN,OPERATION,GROUP_ID,STATUS,COMPONENT_STATUS,LAST_RECEIVED_TIME,
     CONTAINER_ID, PENDING MESSAGE COUNT
    default/Standard!2.0/Mediator1,execute,1001,0,0,2012-03-29
     06:24:22.509394,EC09D271796511E18F5CBD26553417B4,1
    ------------------------------------------------------------------------------
    Containerid Data 
    containerId,renewalTime
    EC09D271796511E18F5CBD26553417B4,java.util.GregorianCalendar[time=1333002526625
    ,areFieldsSet=true,areAllFieldsSet=true,lenient=true,zone=sun.util.calendar.Zon
    eInfo[id="GMT-07:00",offset=-25200000,dstSavings=0,useDaylight=false,transition
    s=0,lastRule=null],firstDayOfWeek=1,minimalDaysInFirstWeek=1,ERA=1,YEAR=2012,MO
    NTH=2,WEEK_OF_YEAR=13,WEEK_OF_MONTH=5,DAY_OF_MONTH=28,DAY_OF_YEAR=88,DAY_OF_
    WEEK=4,DAY_OF_WEEK_IN_MONTH=4,AM_PM=1,HOUR=11,HOUR_OF_
    DAY=23,MINUTE=28,SECOND=46,MILLISECOND=625,ZONE_OFFSET=-25200000,DST_OFFSET=0]

14.2.16 Adapter Diagnostic Dumps (soa.adapter.ra)

Table 14-18 provides details about connection factory configuration dumps.

Table 14-18 Adapter Diagnostic Dumps

Dump Name Dump Parameters/Dump Mode Information Captured

soa.adapter.ra­

  • Dump parameters:

    flowid (Optional): When present, locates the flowtrace.xml file that includes the flow ID. It can be obtained from a dump context if not specified as a dump parameter. The following rules apply for actual parameter evaluation:

    1) If the flow ID is available (as a dump parameter or obtained from a dump context), it retrieves the flow instance and gets the flow trace. It uses the ECID associated with the flow instance to retrieve the remaining dump artifacts.

    2) If the flow ID is not available, but the ECID is (as a dump parameter or obtained from a dump context), it is used to look up the flow instance and retrieve the flow trace. It uses the ECID to retrieve other dump artifacts.

    3) If both the flow ID and ECID are available, and the ECID is not equal to the flow's ECID, the ECID is ignored and a warning is displayed. Rule 1 is followed.

    4) If both the flow ID and ECID are not available, an exception error is displayed.

    ecid: (Optional) Specifies the ecid jndiName and adapterType.

  • Dump Mode:

    ASYNC

Dumps the connection factory information:

  • Managed connection factory properties

  • Connection pool properties

  • Transaction support property

Indicates if the same JNDI is being used by multiple composites.

14.2.16.1 WLST Command Dump Description and Execution

  1. Enter the following WLST command line syntax to display a dump description of soa.adapter.ra:
    wls:/soainfra/serverConfig> describeDump(name='soa.adapter.ra',
    appName='soa-infra')
    
  2. Enter the following WLST command line syntax to execute a dump of soa.adapter.ra:
    wls:/soainfra/serverConfig> executeDump(name='soa.adapter.ra',
    appName='soa-infra', args={'compositeName':'fa', 'partition':'default',
    'revision':'1.0'})
    

    The following information appears:

    CompositeDN = default/fa!1.0*soa_7ce2ebd9-ce17-4b5a-b436-2567eab33af2
    Endpoint Name = service
    Endpoint type = Service
    JNDI Name = eis/FileAdapter
    Adapter Type = FileAdapter
     
    Pool Parameters -
    ==================
     
    initial-capacity = 10
    test-connections-on-create = false
    test-connections-on-reserve = false
    connection-creation-retry-frequency-seconds = 2
    shrinking-enabled = true
    ignore-in-use-connections-enabled = true
    highest-num-waiters = 0
    shrink-frequency-seconds = 60
    connection-reserve-timeout-seconds = 5
    highest-num-unavailable = 0
    max-capacity = 2147483647
    profile-harvest-frequency-seconds = 300
    capacity-increment = 100
    test-connections-on-release = false
    match-connections-supported = false
    test-frequency-seconds = 0
     
    Transaction Support = NoTransaction
     
    Connection Factory Properties -
    ===============================
     
    outboundDataSource = none
    outboundDataSourceLocal = none
    outboundLockTypeForWrite = none
    controlDir = ${user.dir}
    inboundDataSource = none
    workingDirectory = default
     
    ================================================================
     
    CompositeDN = default/fa!1.0*soa_7ce2ebd9-ce17-4b5a-b436-2567eab33af2
    Endpoint Name = reference
    Endpoint type = Reference
    JNDI Name = eis/FileAdapter
    Adapter Type = FileAdapter
     
    Pool Parameters -
    ==================
     
    initial-capacity = 10
    test-connections-on-create = false
    test-connections-on-reserve = false
    connection-creation-retry-frequency-seconds = 2
    shrinking-enabled = true
    ignore-in-use-connections-enabled = true
    highest-num-waiters = 0
    shrink-frequency-seconds = 60
    connection-reserve-timeout-seconds = 5
    highest-num-unavailable = 0
    max-capacity = 2147483647
    profile-harvest-frequency-seconds = 300
    capacity-increment = 100
    test-connections-on-release = false
    match-connections-supported = false
    test-frequency-seconds = 0
     
    Transaction Support = NoTransaction
     
    Connection Factory Properties -
    ===============================
     
    outboundDataSource = none
    outboundDataSourceLocal = none
    outboundLockTypeForWrite = none
    controlDir = ${user.dir}inboundDataSource = noneworkingDirectory = default

14.2.17 Adapter Diagnostic Dumps (soa.adapter.connpool)

Table 14-19 identifies the adapter connection pool dump.

Table 14-19 Adapter Diagnostic Dumps

Dump Name Dump Parameters/Dump Mode Information Captured

soa.adapter.connpool

  • Dump parameters:

    flowid (Optional): When present, locates the flowtrace.xml file that includes the flow ID. It can be obtained from a dump context if not specified as a dump parameter. The following rules apply for actual parameter evaluation:

    1) If the flow ID is available (as a dump parameter or obtained from a dump context), it retrieves the flow instance and gets the flow trace. It uses the ECID associated with the flow instance to retrieve the remaining dump artifacts.

    2) If the flow ID is not available, but the ECID is (as a dump parameter or obtained from a dump context), it is used to look up the flow instance and retrieve the flow trace. It uses the ECID to retrieve other dump artifacts.

    3) If both the flow ID and ECID are available, and the ECID is not equal to the flow's ECID, the ECID is ignored and a warning is displayed. Rule 1 is followed.

    4) If both the flow ID and ECID are not available, an exception error is displayed.

    ecid: (Optional) Specifies the ecid jndiName, adapterType compositeName, partition, revision adapterType, and jndiName.

  • Dump Mode:

    ASYNC

Dumps the connection pool statistics for the configured connection factory JNDI.

14.2.17.1 WLST Command Dump Description and Execution

  1. Enter the following WLST command line syntax to display a dump description of soa.adapter.connpool:
    wls:/soainfra/serverConfig> describeDump(name='soa.adapter.connpool',
    appName='soa-infra')
    

    The following information appears:

    Name: soa.adapter.connpool
    Description: SOA adapter diagnostic dump that captures the Connection pool
    stats for configured adapters JNDI.
    Rules for actual parameter evaluation:
    if ecid is specified, use it to match composites associated with the ECID,
    composite name/partition/revision not used;
    if ecid is not specified, then use jndiName & adapterType to retrieve the
    connection pool attributes;
    if jndiName and adapterType are not specified, then use composite
    name/partition/revision to match composites;
    if no composite name/partition/revision are specified, then all the composites
    with jca binding are dumped.
    Mandatory Arguments:
    Optional Arguments:
        Name        Type     Description
        ecid        STRING   ECID(Execution Context ID - for tracking message flow
    across multiple instances), when presents, will be used to locate
    composites associated with it, and other composite matching parameters ignored;
    it can be obtained from dump context if not specified as dump parameter, see
    rules for actual parameter evaluation for details.
    revision    STRING   Revision of composite, e.g. '1.0', '2.0', can be wild card
    '*', meaning matching any revision, when missing, assume default composite's
     revision in the composite series.
     flowid      LONG       Flow ID, when presents, will be used to locate the
                            flowtrace.xml with it, it can be obtained from dump
                            context if not specified as dump parameter, see rules
                            for actual parameter evaluation for details.
     adapterType STRING     Resource Adapter type
     partition   STRING     Partition of composite, default to partition(s)
                            associated with resolved revision(s), can be wild 
                            card '*', meaning matching any partition.
     compositeName STRING   Composite name, e.g., 'OrderProcessing', can
                            be wild card '*',meaning matching any composite.
     jndiName    STRING     Adapter Connection Pool JNDI
    
  2. Enter the following WLST command line syntax to execute a dump of soa.adapter.connpool:
    wls:/soainfra/serverConfig> executeDump(name='soa.adapter.connpool',
    appName='soa-infra', args={'compositeName':'fa', 'partition':'default',
    'revision':'1.0'})
    

    The following information appears:

    CompositeDN=default/fa!1.0*soa_7ce2ebd9-ce17-4b5a-b436-2567eab33af2
    Endpoint Name = service
    Endpoint type = Service
    JNDI Name =eis/FileAdapter
    Adapter Type =FileAdapter
     
    ConnectionPool Attributes:
    ==========================
     
    Important ConnectionPool Attributes:
    ====================================
    InitialCapacity = 10
    MaxCapacity = 2147483647
    CurrentCapacity = 10
    State = Running
    FreeConnectionsCurrentCount = 10
    NumUnavailableCurrentCount = 0
    NumberDetectedLeaks = 0
    ConnectionsDestroyedByErrorTotalCount = 0
    ConnectionsRejectedTotalCount = 0
     
    Other ConnectionPool Attributes:
    ================================
    ActiveConnectionsCurrentCount = 0
    FreePoolSizeHighWaterMark = 0
    PoolSizeLowWaterMark = 0
    ConnectionsMatchedTotalCount = 0
    LastShrinkTime = 0
    FreeConnectionsHighCount = 10
    ConnectionsDestroyedTotalCount = 0
    ConnectionsDestroyedByShrinkingTotalCount = 0
    ShrinkingEnabled = true
    ConnectionsCreatedTotalCount = 10
    NumUnavailableHighCount = 0
    MaxIdleTime = 0
    LoggingEnabled = true
    ConnectionIdleProfileCount = 0
    ConnectionProfilingEnabled = false
    ShrinkCountDownTime = -10565
    FreePoolSizeLowWaterMark = 0
    ActiveConnectionsHighCount = 0
    ProxyOn = false
    NumWaitersCurrentCount = 0
    NumWaiters = 0
    CloseCount = 0
    PoolSizeHighWaterMark = 0
    AverageActiveUsage = 0
    RecycledTotal = 0
    ConnectionLeakProfileCount = 0
    HighestNumWaiters = 0
    ShrinkPeriodMinutes = 1
    NumberDetectedIdle = 0
    CapacityIncrement = 1
     
    ================================================================
    CompositeDN=default/fa!1.0*soa_7ce2ebd9-ce17-4b5a-b436-2567eab33af2
    Endpoint Name = reference
    Endpoint type = Reference
    JNDI Name =eis/FileAdapter
    Adapter Type =FileAdapter
     
    ConnectionPool Attributes:
    ==========================
     
    Important ConnectionPool Attributes:
    ====================================
    InitialCapacity = 10
    MaxCapacity = 2147483647
    CurrentCapacity = 10
    State = Running
    FreeConnectionsCurrentCount = 10
    NumUnavailableCurrentCount = 0
    NumberDetectedLeaks = 0
    ConnectionsDestroyedByErrorTotalCount = 0
    ConnectionsRejectedTotalCount = 0
     
    Other ConnectionPool Attributes:
    ================================
    ActiveConnectionsCurrentCount = 0
    FreePoolSizeHighWaterMark = 0
    PoolSizeLowWaterMark = 0
    ConnectionsMatchedTotalCount = 0
    LastShrinkTime = 0
    FreeConnectionsHighCount = 10
    ConnectionsDestroyedTotalCount = 0
    ConnectionsDestroyedByShrinkingTotalCount = 0
    ShrinkingEnabled = true
    ConnectionsCreatedTotalCount = 10
    NumUnavailableHighCount = 0
    MaxIdleTime = 0
    LoggingEnabled = true
    ConnectionIdleProfileCount = 0
    ConnectionProfilingEnabled = false
    ShrinkCountDownTime = -10565
    FreePoolSizeLowWaterMark = 0
    ActiveConnectionsHighCount = 0
    ProxyOn = false
    NumWaitersCurrentCount = 0
    NumWaiters = 0
    CloseCount = 0
    PoolSizeHighWaterMark = 0
    AverageActiveUsage = 0
    RecycledTotal = 0
    ConnectionLeakProfileCount = 0
    HighestNumWaiters = 0
    ShrinkPeriodMinutes = 1
    NumberDetectedIdle = 0
    CapacityIncrement = 1

14.2.18 Adapter Diagnostic Dumps (soa.adapter.stats)

Table 14-20 identifies the adapter diagnostic dump.

Table 14-20 Adapter Diagnostic Dumps

Dump Name Dump Parameters/Dump Mode Information Captured

soa.adapter.stats

  • Dump parameters:

    format: (Optional) Specify a value of xml to display dump diagnostics output in XML format.

  • Dump Mode:

    ASYNC

Based on the soa.adapter.stats metrics, DMS statistics such as message size and fault count are available.

14.2.18.1 WLST Command Dump Description and Execution

  1. Enter the following WLST command line syntax to display a dump description of soa.adapter.stats:
    wls:/soainfra/serverConfig> describeDump(name='soa.adapter.stats', appName='soa-infra')
    

    The following information appears:

    Name: soa.adapter.stats
    Description: SOA adapter diagnostic dump that captures DMS adapter
    statistics.Rules for actual parameter evaluation:
    if composite name/partition/revision are specified, dumps the DMS stats for
    that composite;
    if no composite name/partition/revision are specified, then all the composites
    with jca binding are dumped.
    Mandatory Arguments:
    Optional Arguments:
        Name        Type     Description
        revision    STRING   Revision of composite, e.g. '1.0', '2.0', can be wild
    card '*', meaning matching any revision, when missing, assume default
    composite's revision in the composite series.
        partition   STRING   Partition of composite, default to partition(s)
     associated with resolved revision(s), can be wild card '*', meaning matching
     any partition.
        compositeName  STRING   Composite name, e.g., 'OrderProcessing', can be
     wild card '*',meaning matching any composite.
    
  2. Enter the following WLST command line syntax to execute a dump of soa.adapter.stats:
    wls:/soainfra/serverConfig> wls:/soainfra/serverConfig>
    executeDump(name='soa.adapter.stats', appName='soa-infra',
    args={'compositeName':'fa', 
    'partition':'default', 'revision':'1.0'})
    

    The following information appears:

    CompositeDN -default/fa!1.0
    Service Name -service
    Process Incoming Message Metrics -
    ================================
    processIncomingMessages.time (Elapsed time in milliseconds ) - 4787 msecs
    processIncomingMessages.completed (Elapsed time in milliseconds ) - 2 ops
    processIncomingMessages.minTime (Elapsed time in milliseconds ) - 32 msecs
    processIncomingMessages.maxTime (Elapsed time in milliseconds ) - 4755 msecs
    processIncomingMessages.avg (Elapsed time in milliseconds ) - 2393.5 msecs
    processIncomingMessages.active (Elapsed time in milliseconds ) - 0 threads
    processIncomingMessages.maxActive (Elapsed time in milliseconds ) - 1 threads
    Error Metrics -
    =============
    Errors.count (Number of events errored during binding processing ) - 0 ops
    Process Incoming Message Events -
    ===============================
    processIncomingMessagesEvents.count ( Number of processed events ) - 2 ops

14.3 Executing Diagnostic Framework Thread Dumps for SOA Composite Applications

When diagnosing a problem that requires a thread dump, it is useful to have sufficient context around the thread activity. The Diagnostic Framework dump jvm.threads provides DMS execution context (EC) thread stack data for SOA composite applications. The following properties are inserted when the business flow instance starts executing and reset when the HTTP request completes.

  • composite_name

  • component_name

  • composite_instance_id

  • activity_name (Lists the activities executed in the BPEL process. Activities that do not have names, such as scope activities, are not captured.)

This information is output in tabular form when the jvm.threads dump is executed. This dump identifies where each thread is during execution of the jvm.threads dump.

This is useful for diagnosing which SOA composite applications are processing slowly.

14.3.1 WLST Command Dump Description and Execution

  1. Enter the following WLST command line syntax to execute a dump of jvm.threads:
    executeDump(name='jvm.threads',outputFile='path',args={'context':'true'})
    
===== THREAD CONTEXT INFORMATION =====

id      ECID                                                          RID   Context Values
------- ------------------------------------------------------------- ----- ---------------
id=23   e6e3527fc0d0bfd2:-6c720372:139026855d8:-8000-0000000000001d3f 0:1   WEBSERVICE_
                                                       PORT.name=CatchException_pt
                                                       composite_name=ExceptionHandler!1.0
                                                       J2EE_MODULE.name=fabric
                                                       component_name=CommsUtilityWS
                                                       WEBSERVICE_NAMESPACE.name=http://xmlns.
                                                       oracle.com/ExceptionHandler/CatchException
                                                       J2EE_APP.name=soa-infraWEBSERVICE.name=
                                                       catchexception_client_ep
                                                       composite_instance_id=1

id=61   e6e3527fc0d0bfd2:-6c720372:139026855d8:-8000-000000000000003c 0
id=70   e6e3527fc0d0bfd2:-6c720372:139026855d8:-8000-0000000000001e84 0
id=2170 e6e3527fc0d0bfd2:-6c720372:139026855d8:-8000-0000000000001d3f 0     DSID=0000Ĵ2fPtuDSc
                                                                            Y5Hro2yf1G8M9Z000002
id=1616 e6e3527fc0d0bfd2:-6c720372:139026855d8:-8000-0000000000000004 0
id=2179 e6e3527fc0d0bfd2:-6c720372:139026855d8:-8000-000000000000002b 0     dbRID=0:10
id=2195 e6e3527fc0d0bfd2:-6c720372:139026855d8:-8000-0000000000001e7e 0     dbRID=0:2
id=2196 e6e3527fc0d0bfd2:-6c720372:139026855d8:-8000-0000000000001e82 0     dbRID=0:2
id=2197 e6e3527fc0d0bfd2:-6c720372:139026855d8:-8000-0000000000001e80 0     dbRID=0:5

===== END OF THREAD CONTEXT INFORMATION =====

This information is also available in the AdminServer-diagnostic.log file log.

For more information about the jvm.threads dump, see Chapter "Diagnosing Problems" of Administering Oracle Fusion Middleware.

14.4 Supported DMS Metrics

DMS metrics with noun types are exposed as Oracle SOA Suite MBeans to use for diagnosing problems. This section describes the supported DMS metrics. DMS nouns can be used to create watches in Oracle WebLogic Server Administration Console.

The DMS metrics provide graphical details that appear on the Statistics page of the BPEL process service engine. For more information, see Monitoring BPEL Process Service Engine Request and Thread Performance Statistics and Viewing Statistics About the Time a Request Spends in the BPEL Process Service Engine.

Table 14-21 shows the supported service engine sensors.

Table 14-21 Service Engine Sensors

Noun Path Noun Type and Description Sensor Type
/soainfra/engines/ dispatcher/queuestats/
[REQUEST_TYPE]

The various request types are audit, delivery, domain, instance, invoke, maintenance, non-block-invoke, process, and system.

soainfra_cube_engine_dispatcher_queue_stats: Provides the active and scheduled count for the queues of various dispatcher sets.

active

schedule

 
/soainfra/engines/ [bpel|workflow|mediator|
decision]/message_
processing

soainfra_message_processing : Provides information about the total number (count) and average time taken to process various message types. The two message types are synchronous and asynchronous requests.

faultedRequestProcessingTime

faultedPostProcessingTime

requestProcessingTime

postProcessingTime

activeRequests

Phase Event

Phase Event

Phase Event

Phase Event

State

/soainfra/engines/bpel/
requests/[REQUEST_TYPE]

The request types are audit, engine, invoke, non-block-invoke, and system.

soainfra_bpel_requests

active

scheduled

State

State

/soainfra/engines/workflo
w/Task/service

soainfra_wfRequest

time

count

Phase

Event

/soainfra/engines/workflo
w/Task/[METHOD_NAME]
 

time

count

Phase

Event

/soainfra/engines/workflo
w/TaskQuery/[METHOD_NAME]
 

time

count

Phase

Event

/soainfra/engines/workflo
w/TaskMetadata/getTaskDef
inition
 

time

count

Phase

Event

/soainfra/engines/workflo
w/Verification/[METHOD_
NAME]

Only methods: authenticateUser, getPermissableTaskActions, and canUserPerfomTaskAction


time

count

Phase

Event

/soainfra/engines/workflo
w/TaskNotification/notify
ForTask
 

time

count

Phase

Event

/soainfra/engines/workflo
w/AssignmentRules/execute
Rules
 

time

count

Phase

Event

/soainfra/engines/bpel/di
spatcher/

soainfra_bpel_dipatcher

maxThreads

avgLifeTime

avgRequestCountPerSecond, and so on

State

State

State

Table 14-22 shows the supported binding sensors.

Table 14-22 Binding Sensors

Noun Path Noun Type Sensor Type

/soainfra/bindings/[inbound|outbound]/[ws|sdo|jca|b2b]

soainfra_binding

processRequests

requests

errors

Phase

Phase

Phase

Table 14-23 shows the supported composite sensors.

Table 14-23 Composite Sensors

Noun Path Noun Type Sensor Type

/soainfra/apps/[APP_NAME]/[COMPOSITE_NAME]/[REVERSION]/[COMPONENT_NAME]

/decision/[INTERACTION_PATTERN]/[INTERACTION_PATTERN_NAME]

soainfra_decision_interaction

executed

executionTime

Event

Phase

/soainfra/apps/[COMPOSITE_DN]/[COMPONENT_NAME]/[ACTIVITY_NAME] (for bpel)

soainfra_bpel_activity: Provides details about the activity level execution times

started

executionTime

faultedExecutionTime

Standard deviation (the user interface calculates this as it comes through)

Event

Phase

Phase

/soainfra/apps/[APP_NAME]/[COMPOSITE_NAME]/[VERSION]/[COMPONENT_NAME] /state/

soainfra_wfStateEvent

ASSIGNED

COMPLETED

ERRORED

EXPIRED

SUSPENDED

Event

/soainfra/apps/[APP_NAME]/[COMPOSITE_NAME]/[VERSION]/[COMPONENT_NAME] /outcome/

soainfra_wfOutcomeEvent

[OUTCOME NAME]

Event

/soainfra/apps/[APP_NAME]/[COMPOSITE_NAME]/[VERSION]/[COMPONENT_NAME] /taskCompletion/

soainfra_wfTaskCompletionTime

time

Phase

Table 14-24 shows the supported reference and service sensors.

Table 14-24 Reference and Service Sensors

Noun Path Noun Type Sensor Type

/soainfra/apps/[APP_NAME]/[COMPOSITE_NAME]/[REVERSION]/[REFERENCE_NAME]

soainfra_reference

processOutboundMessagesEvents

Errors

processOutboundMessages

Event

Event

Phase

/soainfra/apps/[APP_NAME]/[COMPOSITE_NAME]/[REVERSION]/[SERVICE_NAME]

soainfra_service

processInboundMessagesEvents

Errors

processInboundMessages

Event

Event

Event

Table 14-25 shows the supported Oracle B2B binding sensors.

Table 14-25 Oracle B2B Binding Sensors

Noun Path Noun Type Sensor Type

/soainfra/bindings/b2b/document_type/[inbound|outbound]/[DOCUMENT_NAME]

/soainfra/bindings/b2b/[inbound|outbound]

soainfra_b2b_document

soainfra_b2b_document_dir

processMessagesEvents

processMessagesErrors

processMessages

processMessageSize

Event

Event

Phase Event

State

/soainfra/bindings/b2b/trading_partner/[from|to]/[TRADING_PARTNER_NAME]

/soainfra/bindings/b2b/[from|to]/

soainfra_b2b_tradingPartner

soainfra_b2b_tradingPartner_dir

processMessagesEvents

processMessagesErrors

processMessages

processMessageSize

Event

Event

Phase Event

State

/soainfra/bindings/b2b/endpoint/[inbound|outbound]/[END_POINT]

/soainfra/bindings/b2b/[inbound|outbound]/

soainfra_b2b_endpoint

soainfra_b2b_endpoint_dir

endPointProtocol

endPointStatus

processMessagesEvents

State

State

Event

/soainfra/bindings/b2b/agreement/[AGREEMENT_NAME]

soainfra_b2b_agreement

processMessagesEvents

Event

/soainfra/bindings/b2b/activeEntities

soainfra_b2b_active_entities

activeTradingPartners

activeAgreements

activeDocuments

State

State

State

/soainfra/apps/[APP_NAME]/[COMPOSITE_NAME]/[REVERSION]/[SERVICE_NAME]/[TRADING_PARTNER_NAME]

soainfra_service_b2b_tradingPartner

processMessagesEvents

processMessagesErrors

processMessages

processMessageSize

Event

Event

Phase Event

State

/soainfra/apps/[APP_NAME]/[COMPOSITE_NAME]/[REVERSION]/[REFERENCE_NAME]/[TRADING_PARTNER_NAME]

soainfra_reference_b2b_tradingPartner

processMessagesEvents

processMessagesErrors

processMessages

processMessageSize

Event

Event

Phase Event

State

Table 14-26 shows the supported Oracle User Messaging Service sensors.

Table 14-26 Oracle User Messaging Service Event Bridge Metrics

Noun Path Noun Type Sensor Type

/soainfra/eventBridge/rfidBridge

soinfra_rfidBridge

eventsIn

eventsOut

eventsProcess

errors

Event

Event

Phase Event

Event

/soainfra/eventBridge/rfidBridge/device/[SERVER_NAME]/[DEVICE_NAME]

soainfra_rfidBridge_device

eventsIn

eventsOut

eventsProcess

status

Event

Event

Phase Event

State

/soainfra/eventBridge/rfidBridge/server/[SERVER_NAME]

soainfra_rfidBridge_server

status

State

14.5 Creating Watches and Notifications

You can create watches and send notifications around diagnosable conditions based on metrics collected from Oracle SOA Suite MBeans. When a watch expression evaluates to true (for example, heap space exceeds a specified amount), a notification is sent.

There are several options for creating watches:

  • Enable preconfigured rules and watches for deployment, memory, and elapsed time of web service calls with the sca_createWatches WLST command

  • Manually create Oracle SOA Suite watches in Oracle WebLogic Server Administration Console

The message IDs shown in Table 14-27 have been assigned for diagnostic purposes.

  • When you manually create a watch in the Oracle WebLogic Server Administration Console, you must follow the naming conventions in Table 14-27. The prefix for Oracle SOA Suite-related watches is SOA-message_ID.

  • When you enable the preconfigured watches, the names are automatically created for you.

Table 14-27 Message Prefixes

Scenario Message-ID Dumps Executed Watch Preconfigured?

Memory

SOA-900000

  • soa.env

  • soa.config

  • java.sysprops

Yes, see Enabling Preconfigured Rules and Watches

Deployment hang

SOA-900001

  • soa.env

  • soa.config

Yes, see Enabling Preconfigured Rules and Watches

Data source

SOA-900002

  • soa.env

  • soa.config

  • soa.db

No, see Manually Creating Oracle SOA Suite Watches and Notifications for creation instructions

Elapsed time of web service calls

SOA-900003

  • soa.env

  • soa.config

  • soa.wsdl

Yes, see Enabling Preconfigured Rules and Watches

Resequencer groups pending

MED-900000

  • mediator.resequencer

No, see Manually Creating Oracle SOA Suite Watches and Notifications for creation instructions

You can also link a WLDF notification to the watch. If you link the out-of-the-box Oracle Fusion Middleware Diagnostic Framework notification (named FMWDFW notification), then a set of SOA-specific dumps are executed. These dumps provide runtime information about the situation and environment. The list of dumps to execute is determined by predefined XML incident rules files.

Other notifications (like email) can also be linked to the watch.

14.5.1 Enabling Preconfigured Rules and Watches

The following preconfigured Diagnostic Framework rules are automatically installed with Oracle SOA Suite:

  • Log detection condition rule for creating an incident when an OWS-04086 error is encountered.

  • Condition rule that checks for the presence of the SOA composite application name in the DMS execution context (EC) and adds the soa.wsdl and soa.composite.trail diagnostic dumps to the list of dumps executed.

To enable these rules for use and generate the following watches, you must run the sca_createWatches WLST command after domain creation.

  • Deployment watch (with a threshold of 5 minutes)

  • Memory watch (heap free percent with a threshold of 25 percent)

  • Elapsed time of web service calls watch (with a threshold of 5 minutes)

To enable the preconfigured watches:

  1. Connect using WLST to the Oracle WebLogic Server instance and start an editing session. For information about connecting and starting an editing session, see Chapter "WLST Command and Variable Reference" of WLST Command Reference for WebLogic Server.
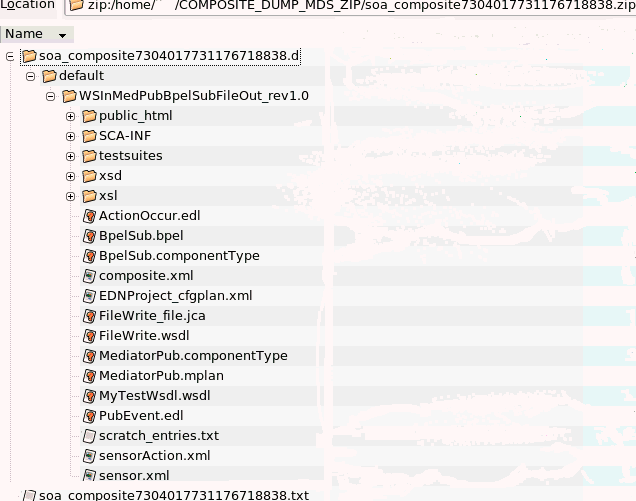
  2. Execute the following WLST command to enable the preconfigured watches.
    wls:/soainfra/serverConfig> sca_createWatches()
    

    The watches are enabled and displayed along with any watches you manually create at the bottom of the Settings for Module_Name page in Oracle WebLogic Server Administration Console.

For information about executing WLST commands in Oracle SOA Suite, see WLST Command Reference for SOA Suite.

14.5.2 Manually Creating Oracle SOA Suite Watches and Notifications

To manually create Oracle SOA Suite watches and notifications:

  1. Log in to Oracle WebLogic Server Administration Console.
    http://host:port/console
    
  2. In the Domain Structure, expand Diagnostics, and select Diagnostic Modules.

    The Summary of Diagnostic Modules page appears.

    You configure a diagnostic system module to monitor an aspect of a server or server resource. You can configure multiple system modules to monitor different aspects of a server, but only one such module can be active on a server.

  3. In the Diagnostic System Modules section, click Module-[Module_Name] (for example, Module-FMWDFW).
  4. On the Settings for Module_Name page, select Watches and Notifications > Watches.
  5. In the Watches section, click New.

    The Create a Diagnostic Watch page is displayed.

  6. Enter the following details to create a watch, and click Next.
    Field Description

    Watch Name

    Enter a name for the watch (for this example, SOA-900000#soa-infra#MemoryWatch is entered).

    The name of the watch must conform to the following pattern:

    message-id#soa-infra#some_other_text

    For example, SOA-900000#soa-infra#MemoryWatch.

    This is necessary because the watch name coordinates the Diagnostic Framework incident processing actions when watch conditions evaluate to true. Not following this pattern results in Oracle SOA Suite dumps not getting triggered when Oracle SOA Suite incidents are created.

    For additional information, see Table 14-27.

    If the watch is set up with the FMWDFW notification, the notification handler creates an incident that corresponds to the message-id specified in the watch name.

    Watch Type

    Select an option:

    • Collected Metrics: Sets a watch based on metrics collected from MBean attributes. It is recommended that you select this option because it works for the scenarios described in Table 14-1.

    • Server Log: Sets a watch based on data written to server logs. This type is only useful for extending an existing log watch such as StuckThread to include Oracle SOA Suite dumps.

    • Event Data: This option is not applicable because Oracle SOA Suite is not using any WLDF-based instrumentation.

    Enable Watch

    Select to enable a watch.

    The Configure Watch Rule Expressions page for adding an expression to the watch is displayed.

  7. Click Add Expressions.

    The Add Expression wizard is displayed.

  8. In the MBean Server location list, select the Oracle WebLogic Server MBean server for the expression you want to configure (for example, ServerRuntime).
  9. Click Next.
  10. Click the Select an MBean Type from the following list button.
  11. In the MBean Type list, select the MBean to use for collecting diagnostic information (for this example, Oracle WebLogic Server MBean weblogic.management.runtime.JRockitRuntimeMBean is selected).

    Note:

    If you want to create an automatic notification when a composite state is set to off, select oracle.fabric.management.composite.mbean.Composite from the MBean Type list.

  12. Click Next.

    The Select Instances page is displayed.

  13. From the Instance list, select the instance name or specify an instance name pattern to use to identify the metric for the expression.
  14. Click Next.
  15. Enter the following details to create a watch rule expression, and click Finish.
    Field Description

    Message Attribute

    Select a message attribute (for this example, HeapFreePercent is selected).

    The attributes that are displayed for selection are part of the MBean that you selected in Step 11. For example, if you selected:

    oracle.dms.name=/soainfra/engines/bpel/request/system.type=soa_infra_bpel_requests

    You see assigned attributes such as active_count, active_maxValue, active_minValue, scheduled_count, and others.

    Operator

    Select an operator (for this example, < is selected).

    Value

    Enter a value (for this example, 100 is specified).

    The Configure Watch Rule Expressions page is displayed with the watch rule expression you created.

  16. Click Next.

    The Config Watch Alarm page is displayed.

  17. Optionally specify an alarm and the alarm's reset value for the watch.
  18. Click Next.

    The Configure Watch Notifications page is displayed.

  19. In the Available table, select a notification to assign to the watch and click >.

    When a watch rule expression evaluates to true, a notification is triggered. This notification is handled by the Diagnostic Framework if the FMWDFW notification is selected, which links it to the watch. The FMWDFW notification is automatically shipped with Oracle SOA Suite. Oracle recommends that you select this notification because it creates the Oracle SOA Suite dumps described in Executing Oracle SOA Suite Diagnostic Dumps.

    The notification handler creates a problem incident package that contains appropriate Oracle SOA Suite dumps in the ADR. The incident package name corresponds to the message ID specified in the watch name. The incident package dumps can be viewed later using standard ADR tools. This feature enables you to take corrective actions for the problem scenario.

  20. Click Finish.

    The watch you created is displayed at the bottom of the Settings for Module_Name page. In addition, three WLDF watches that are automatically shipped with Oracle WebLogic Server (Deadlock, StuckThread, and UncheckedException) are also displayed.

  21. In the Name column, click the specific watch name to display configuration details about the watch.

14.5.3 Creating a Watch to Identify the Elapsed Time of Web Service Binding Calls

You can create a watch that keeps track of the time it takes for web service binding calls from a composite to an external references to complete. When the specified time threshold is exceeded, an incident can be created or an alert can be triggered. This watch is useful for the following scenarios:

  • Identify scenarios in which an invoked external reference is operating too slowly, which causes messages to collect while waiting for processing by this reference

  • Have strict service level agreements (SLAs) and want to be notified if the SLAs are being violated from the invoked services

To create a watch to identify the elapsed time of web service binding calls:

Follow the steps described in Manually Creating Oracle SOA Suite Watches and Notifications and use these guidelines to create a watch:

  • Set the CreateWSCallTrackingMBean property to true under the More SOA Infra Advanced Configuration Properties section of the SOA Infrastructure Common Properties page. This property controls the creation of MBeans for tracking the elapsed time of web service binding calls, and applies globally to all SOA composite applications in the SOA Infrastructure. For each web service binding call to an external reference, a new MBean is registered to keep track of the time, and then unregistered. This property is set to false by default. Do not set this property to true until you see problems in your system.

    For more information about accessing the SOA Infrastructure Common Properties page, see Configuring SOA Infrastructure Properties.

  • Specify SOA-900003#soa-infra#WSExtElapsedTimeWatch as the watch name.

  • Select Collected Metrics from the Watch Type list.

  • Specify CreateWSCallTrackingMBean in the Custom MBean Types field. This MBean is not available for selection from the MBean Type field.

  • Specify an expression rule for tracking the elapsed time it takes in milliseconds for web service binding calls from a SOA composite application to an external references to complete (in minutes). For example, this expression creates an incident when the watch is triggered.

    (${ServerRuntime//[oracle.fabric.management.wldf.mbean.WSExternalBindingWatchMXBeanImpl]//ElapsedTime} > 2
    
  • An incident is created in the Oracle SOA Suite ADR directory when the watch is triggered. A readme file in the directory displays information about the incident. For example:

    WatchDomainName:      soainfra
    Watch Data:
    ServerRuntime//[oracle.fabric.management.wldf.mbean.WSExternalBindingWatch
     MXBeanImpl]//ElapsedTime : oracle.soa.config:Application=soa-infra.j2eeType=
    CompositeReferenceWatch.name=bpel#20004/soainfra/AdminServer/soainfra/default/
    ExceptionHandler/1.0/soa.2075e8a1-5c69-4e5o-a679-c0ba2f6ae6/REFERENCEs/
    CommsUtilityS/PORTs/CommsUtilityPort//ElapsedTime:244013
    

    You can also create this watch automatically with the sca_createWatches WLST command. For information, see Enabling Preconfigured Rules and Watches.

14.5.4 Creating a Watch to Identify if Processing Delays Exceed a Specified Time Limit

You can create a watch that alerts you if the counts of message wait times or processing delays exceed a certain limit.

This watch is controlled by the DispatcherStatsMap attribute of the CubeDispatcher System MBean Browser property. You can access this setting as follows:

  1. Right-click soa-infra, and select Administration > System MBean Browser.
  2. Expand Application Defined MBeans > oracle.as.soainfra.bpm > Server : server_name > bpel > CubeDispatcher.
  3. Click CubeDispatcher.

Follow the steps described in Manually Creating Oracle SOA Suite Watches and Notifications and use these guidelines to create a watch in the Add Expressions section of the Create Watch wizard:

  • Select ServerRuntime, and click Next.

  • Specify com.collaxa.cube.engine.dispatch.DispatcherMXBeanAdapter in the Custom MBean Types field, and click Next. This MBean is not available for selection from the MBean Type field.

  • Specify oracle.as.soainfra.bpm:Application=soa-infra,name=CubeDispatcher,type=bpel in the Custom Instance field, and click Next.

  • Specify DispatcherStatsMap(invokeSet)(invoke)(scheduled) in the Attribute Expression field.

  • Complete the remaining fields on this page, and click Next.

14.5.5 Creating Resequencer Watches and Notifications

You can create a watch that tracks how long it takes for resequencer groups to process messages. When the time threshold you specify is exceeded, a notification can be generated.

To create resequencer watches and notifications:

Follow the steps described in Manually Creating Oracle SOA Suite Watches and Notifications using the following guidelines:

  • Create the watch and notification in the Module-FMWDFW module.

  • On the Create a Diagnostic Watch page, the name of the watch must conform to the following pattern:

    MED-900000#soa-infra#some_other_text
    

    For example, MED-900000#soa-infra#PendingGroups.

  • When you create the expression, select the following MBean type:

    oracle.tip.mediator.dfw.MediatorDiagnostic
    

    There is only once choice for the instance in the expression:

    oracle.mediator:name=MediatorDiagnostic,type=MediatorDiagnostic
    
  • For the Message Attribute field, select ResequencerMaxUnprocessTime. For the value, enter the number of minutes a group can be pending before triggering a notification.

  • For the operator, select the greater than symbol (>).

The completed expression should look similar to the following:

(${ServerRuntime//[oracle.tip.mediator.dwf.MediatorDiagnostic]oracle.mediator:name
=MediatorDiagnostic,type=MediatorDiagnostic//resequencerMaxUnprocessTime} > '15')

To create a sample custom rules file:

The watch rules expression is not provided in the dump context, so the criteria specified when generating a dump are not available. You can use a custom file, custom-rule.xml, to register the dump generation rules. For more information, see Predefined Incident Processing Rules.

  1. Create a watch, as described above.
  2. Create a file named custom-rules.xml in one of the following locations:
    • Server level configuration: FMW_HOME/user_projects/domains/domain_name/config/fmwconfig/servers/server_name/dfw

    • Domain level configuration: FMW_HOME/user_projects/domains/domain_name/config/fmwconfig/dfw

  3. Define the rules in the new file. Example 14-1 provides a resequencer sample file.
  4. Restart the domain or load the file dynamically. For information about dynamic loading, see Predefined Incident Processing Rules.

    The WLDF generates the dump.

Example 14-1 Sample Custom Rules File for Resequencer Dumps

<?xml version="1.0" encoding="UTF-8"?>
       <diagnosticRules
             xmlns="http://www.oracle.com/DFW/DiagnosticsFrameworkRules/" 
             xmlns:xs="http://www.w3.org/2001/XMLSchema-instance">
         <processingRules>
           <rule name="memory diagnosis rule">
              <ruleCondition>
                <condition name="MESSAGE_ID" value="MED-900000" 
                           operator="EQ"/>
              </ruleCondition>
              <ruleActions>
                <dumpAction name="mediator.resequencer">
                 <argument name="resequencerMaxUnprocessTime" value="10"
                           valueType="literal"/>
               </dumpAction>
              </ruleActions>
           </rule>
         </processingRules>
       </diagnosticRules>

Example 14-1 shows a sample custom rules file that generates a diagnostic dump when the length of time a group stops processing messages reaches 10 minutes.

14.6 Manually Triggering and Executing Dumps

You can manually execute existing dumps with the WLST command executeDump and create incidents when one has not been automatically created.

To manually trigger and execute dumps:

  1. Specify the executeDump command to place dump contents in a file (for this example, soa.config is the dump executed). This creates the following output:
    wls:/soainfra/serverConfig> executeDump(name='soa.config',outputFile='path',
    appName='soa-infra')
    
    Start Dumping deployedCompositesCatalog from MDS
    URI:deployed-composites/deployed-composites.xml to: /myhome/fmwhome/user_
    projects/domains/mydomain/servers/myserver/adr/diag/ofm/mydomain/
    myserver/incident/incdir_9/deployedCompositesCatalog
    
    Finished dumping specified MDS metadata to : /myhome/fmwhome/user_
    projects/domains/mydomain/servers/myserver/adr/diag/ofm/mydomain/myserver/incid
    ent/incdir_9/deployedCompositesCatalog
    
    Start Dumping soaServiceEnginesConfigurations from MDS
    URI:soa/configuration/default to: /myhome/fmwhome/user_projects/
    domains/mydomain/servers/myserver/AdminServer/adr/diag/ofm/mydomain/
    myserver/incident/incdir_9/soaServiceEnginesConfigurations
    
    Finished dumping specified MDS metadata to : /myhome/fmwhome/user_projects/
    domains/mydomain/servers/myserver/AdminServer/adr/diag/ofm/mydomain/
    myserver/incident/incdir_9/soaServiceEnginesConfigurations
  2. Specify the executeDump command to display dump contents to the screen.
    executeDump(name='soa.edn', appName='soa-infra')
    
    Type:oracle.integration.platform.blocks.event.saq.SAQBusinessEventBus
    Configuration:null
    Status: running=true started=true
    ThreadCount:3
    RetryCount:3
    In Global: Tx:false
    Cluster Info:oracle.integration.platform.blocks.cluster.CoherenceCluster
    Interface1mpt@163bd717
    SharedEDN:false
    OOAO Queue Name:edn_ooao_queue
    Java Subscriber Name:edn java subscriber
    Subscription Info:
    No namespace subscription...
    QName subscriptions:
    =============================================================
    qname={http://schemas.oracle.com/events/edl/ActionOccur}ADEvent
    subscriptions=
    id=default/WSInMedPubBpelSubFileOut!1.0*soa_7a055d6a-8402-49c2-ac56-5f85cbf3d7f/
    BpelSub, consistencyLevel=ONE_AND_ONLY_ONE, filter=XPath Filter: starts-with(/
    be:business-event/be:content/ns0:ActionOccurrence/ns0:ParentEntityType/@value,
     'A'), runAsRoles=[$publisher]
    id=partition_1/WSInMedPubBpelSubFileOut!1.0*soa_80a169ab1-395a-4b87-9986-9fa2742a8bd3/
    BpelSub, consistencyLevel=ONE_AND_ONLY_ONE, filter=XPath Filter: starts-with(/
    be:business-event/be:content/ns0:ActionOccurrence/ns0:ParentEntityType/@value,
     'A'), runAsRoles=[$publisher]
    EventThreadContextInfo:
    EventTargets:
    Event:partition_1/WSInMedPubBpelSubFileOut!1.0*soa0a169ab1-395a-4b87-9986-9fa2742a9bd3/
    BpelSub:::oracle.fabric.BPELServiceEngine@163bd6b5
    Event:default/WSInMedPubBpelSubFileOut!1.0*soa7a055d6a-8402-49c2-ac56-5f85cbf3
    d7f/BpelSub:::oracle.fabric.BPELServiceEngine@163bd6b5
    EDN DB Log enabled:false
    

You can also manually create incidents when one has not been automatically created. For example, this is useful when you notice performance issues and want to create an incident to send to Oracle Support Services. The incident can include SOA dumps, according to the SOA message ID mapping.

This can be performed with the following WLST command:

createIncident(messageId="SOA-90000", appName="soa-infra")

This has the same effect as WLDF watch notification execution, in which the watch has the message ID of SOA-90000 and application name of soa-infra.

For more information about executeDump, see Chapter "Diagnostic Framework Custom WLST Commands" of WLST Command Reference for WebLogic Server.
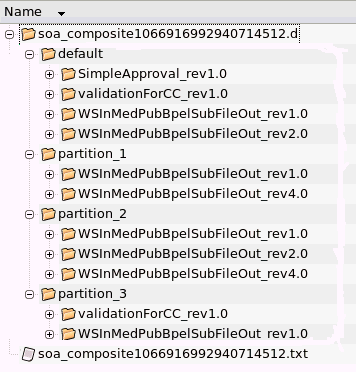
14.7 Viewing Incident Packages with ADR Tools

ADRCI is a command-line utility that enables you to investigate problems and package and upload first-failure diagnostic data to Oracle Support Services. ADRCI also enables you to view the names of dump files in the ADR, and to view the alert log with XML tags stripped, with and without content filtering.

ADRCI is installed in the following directory:

MW_HOME/wlserver_10.3/server/adr

For more information about ADRCI, see Chapter "ADRCI: ADR Command Interpreter" of Oracle Database Utilities.

For information about other tools, see Chapter "Managing Diagnostic Data" of Oracle Database Administrator's Guide

14.8 Querying Problems and Incidents

The Diagnostic Framework provides WLST commands that you can use to view information about problems and incidents, including the following:

  • Querying problems across Oracle WebLogic Servers

  • Querying incidents across Oracle WebLogic Servers

  • Viewing dump files associated with an incident on an Oracle WebLogic Server

For more information about these WLST commands, see Section "Understanding the Diagnostic Framework" of Administering Oracle Fusion Middleware and WLST Command Reference for WebLogic Server.