26 Working with Visualization Templates
Use visualization template to explore analytical data visually on a portal page. WebCenter Portal provides several built-in visualization templates, and a developer can create custom visualization templates in JDeveloper to meet specific requirements.
Permissions:
To perform the tasks in this chapter on shared visualization templates, you must have the application-level Manage Application Integration Visualization permission. Users with the Application Specialist role have this permission by default. For more information about application-level permissions, see About Application Roles and Permissions in Oracle Fusion Middleware Administering Oracle WebCenter Portal.
To perform the tasks in this chapter, you need one of the following portal-level permissions:
-
Assets: Create, Edit, and Delete AssetsorCreate AssetsandEdit Assets(standard permissions) -
Application Integration Visualization: Manage Application Integration Visualization(advanced permissions)
26.1 About Visualization Templates
Introduced in WebCenter Portal 12c (12.2.1) is the ability to retrieve data from a REST or SQL data source using a business object, simplifying the complexities of application integration. The retrieved data can be rendered on a portal page in a data visualization using a visualization template. For example, the data can be presented in one of the built-in visualization templates, or a developer can build a custom visualization template in JDeveloper.
The basic steps to accomplish this are:
-
Create data source. Create a REST or SQL data source from which to retrieve the data to present on the page (see Creating a REST Data Source and Creating a SQL Data Source).
-
(Optional) Create business object. If you need to filter the attributes and methods retrieved from the data source, create a business object (see Creating a Business Object). If you do not create a unique business object, one is automatically created when a data source is selected in the Define Data Visualization wizard, and all the attributes and methods for the data source are added to the business object. Manually-created business objects are listed on the portal Assets page and in the Define Data Visualization wizard, but automatically-created business objects are internal and not exposed anywhere.
-
Determine visualization template. Decide if you can use one of the built-in visualization templates (see About the Built-In Visualization Templates), or if you need to work with a developer to create a custom visualization template. When a custom visualization template is uploaded to a portal, it is shown on the Assets page for the portal; it can also be made available as a shared asset, available to all portals.
-
Configure data visualization. Add a data visualization component (Data Presenter Visualization) to a page, then configure the component to define the data visualization that you want to render on the page (see Configuring a Data Visualization).
WebCenter Portal provides several built-in visualization templates that you can use immediately, or a developer can create custom display templates in JDeveloper.
Notes:
-
You cannot create or edit visualization templates in WebCenter Portal; they must be developed in JDeveloper and published to WebCenter Portal as a shared asset or as an asset for a specific portal. For more information, see Working with Portal Assets in JDeveloper and Developing Visualization Templates in Oracle Fusion Middleware Developing WebCenter Portal Assets and Custom Components with Oracle JDeveloper.
-
If changes are made to a custom visualization template selected in a data visualization, you will need to configure a new data visualization to successfully generate the results of the changes on the page.
If a custom visualization template is a shared asset (available to all portals), it is shown on the Shared Assets page and on the Assets page of all portals along with portal-specific templates. You can not edit or manage the built-in visualization templates, so they are not exposed on the Shared Assets or portal Assets page.
26.1.1 About the Built-In Visualization Templates
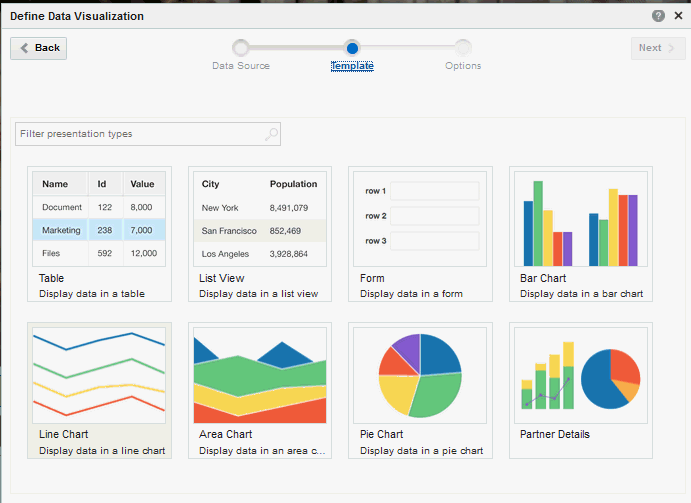
The built-in visualization templates provided with WebCenter Portal are exposed in the Define Data Visualization wizard on the Template page (Figure 26-1). You cannot edit or manage the built-in visualization templates, so they are not exposed on the Shared Assets or portal Assets page.
Figure 26-1 Define Data Visualization Wizard: Template Page
See Also:
Configuring a Data VisualizationThe built-in visualization templates provide standard data presentation styles: table, form, list, or one of four types of charts. When you select a built-in visualization template in the Define Data Visualization wizard, you can set template-specific options, but you cannot make modifications to the look and feel of a built-in template. If none of the built-in visualization templates meet your needs for data presentation, a developer can create a custom visualization template, as described in Developing Visualization Templates in Oracle Fusion Middleware Developing WebCenter Portal Assets and Custom Components with Oracle JDeveloper
Table 26-1 lists and describes the built-in visualization templates provided with WebCenter Portal.
Table 26-1 Built-In Visualization Templates
| Name | Icon | Description |
|---|---|---|
|
Area Chart |
 |
Displays data in an area chart, using options specified in the Define Data Visualization wizard for chart title, horizontal and vertical axes title and data, legend title and position, and zoom. |
|
Bar Chart |
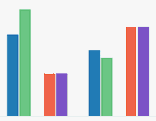 |
Displays data in a bar chart, using options specified in the Define Data Visualization wizard for chart title, horizontal and vertical axes title and data, legend title and position, and zoom. |
|
Form |
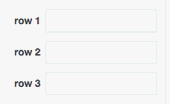 |
Displays data in a form, using options specified in the Define Data Visualization wizard for navigation controls, header, refresh, and field attribute values to show. |
|
Line Chart |
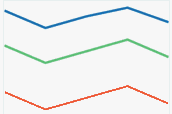 |
Displays data in a line chart, using options specified in the Define Data Visualization wizard for chart title, horizontal and vertical axes title and data, legend title and position, and zoom. |
|
List View |
 |
Displays data in a list view, using options specified in the Define Data Visualization wizard for fetch size and and column attribute values to show. |
|
Pie Chart |
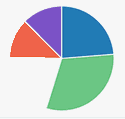 |
Displays data in a pie chart, using options specified in the Define Data Visualization wizard for chart title, pie data, 3D effect, sorting, number of slices, chart footnote, and legend position and title. |
|
Table |
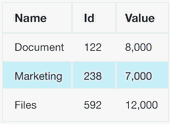 |
Displays data in a table, using options specified in the Define Data Visualization wizard for header row, filtering, sorting, toolbar, header, refresh, paginations, items per page, and column attribute values to show. |
.
26.2 Creating or Editing a Visualization Template
Creating or editing a visualization template is a complex task that requires a good understanding of Application Development Framework (ADF) and how to visualize retrieved data. For this reason, custom visualization templates must be created and edited by developers using JDeveloper.
A developer can publish a custom visualization template directly to WebCenter Portal (the portal server) as a shared asset or to a specific portal for immediate use and testing.
For more information, see Working with Portal Assets in JDeveloper and Developing Visualization Templates in Oracle Fusion Middleware Developing WebCenter Portal Assets and Custom Components with Oracle JDeveloper
26.3 Managing a Visualization Template
The following options are available on the Assets and Shared Assets page to enable you to manage visualization templates.
See Also:
-
Delete—You can delete a visualization template when it is no longer required.
For more information, see Deleting an Asset.
-
Upload—You can upload an archive file that contains a visualization template that has been developed using JDeveloper.
For more information, see Uploading an Asset.
-
Download—You can download a visualization template into an archive file for further development in JDeveloper.
For more information, see Downloading an Asset.
-
Actions
-
Edit Source—You can directly edit the source code of a visualization template on the Fragment tab. Editing the source code is not recommended unless you are making a minor edit.
-
Copy—You can create a copy of a visualization template. This is the only way to create a new visualization template in WebCenter Portal. Once copied, you can download the template for customization in JDeveloper.
For more information, see Copying an Asset.
-
Copy To Shared Assets—You can copy a visualization template to application-level shared assets for use by other portals.
-
Show Properties—Each visualization template has an associated Show Properties dialog that summarizes useful information about it.
For more information, see Viewing Information About an Asset.
-
Edit Properties—Each visualization template has certain properties associated with it that control how it is displayed in the portal. You can edit these properties through the Edit Properties dialog.
For more information, see Setting Properties on an Asset.
-
Upload Icon—You can upload an icon to display in the Define Data Visualization wizard to represent the custom visualization template. The icon image file must be of file type GIF, PNG, or JPG, and should be no larger than 150K and 200x143 pixels for best results. For an example of a custom visualization template with an icon assigned and available for selection on the Template page, see Figure 25-7 in Configuring a Data Visualization.
-
-
Available—You can control whether or not a visualization template is available for select in the Define Data Visualization wizard by selecting or deselecting this check box.
For more information, see Showing and Hiding Assets.