4 Configuring Instrumentation
This section discusses how to make changes to the current configuration settings, and how to add methods to and remove methods from the configuration.
How do I change configuration settings to suit my system needs?
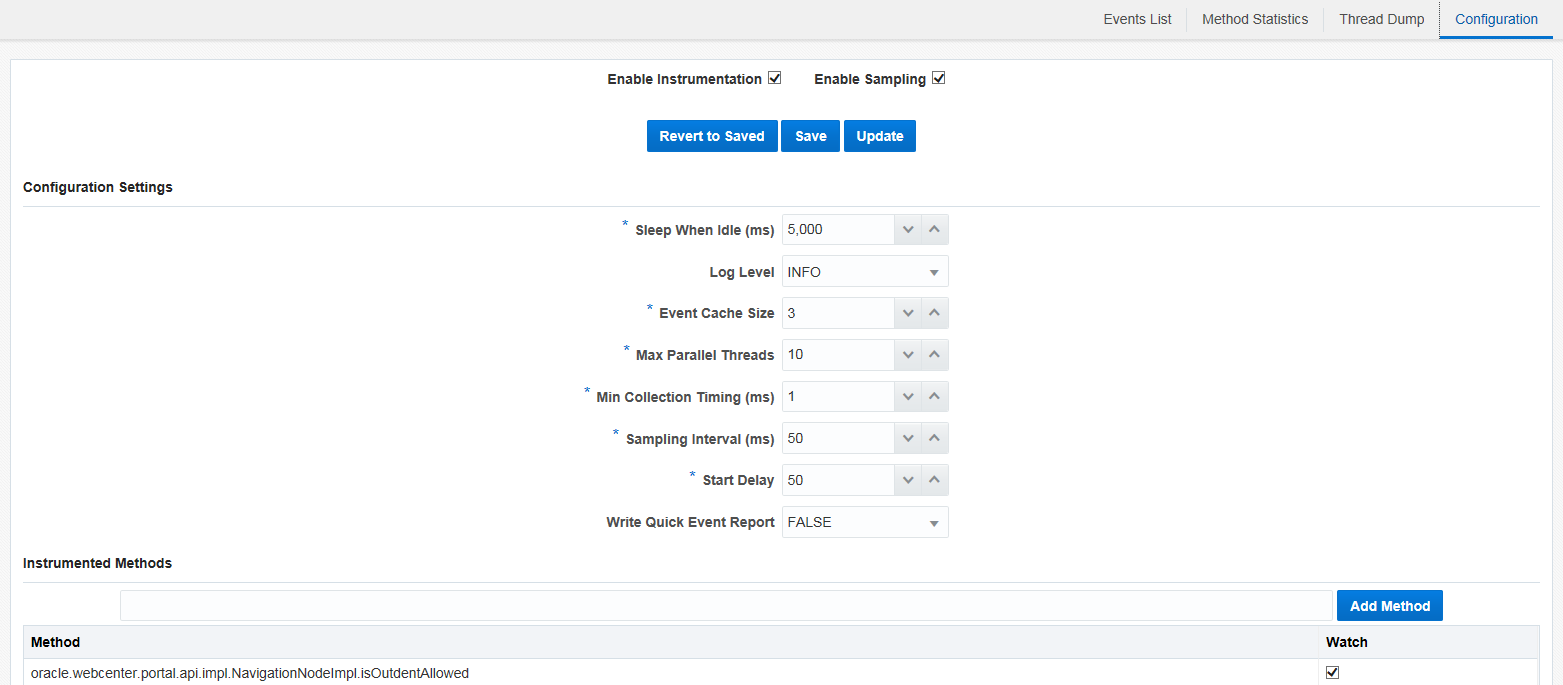
The Configuration page lets you enable instrumentation and sampling, as well as change certain configuration settings.

Description of the illustration GUID-838FFC92-9BA1-48A9-9041-25E348E6D9DF-default.png
You can change the following configuration settings.
| Configuration Setting | Description |
|---|---|
| Enable Instrumentation | Select to enable method instrumentation. Unselect to disable method instrumentation. |
| Enable Sampling | Select to enable method sampling. Unselect to disable method sampling.
Note: You can only change this setting if Instrumentation is enabled. |
| Sleep When Idle | Defines how frequent to wake the internal thread to process instrumentation events. Default is 5 seconds.
Note that if you set the frequency to a greater value, you may see a delay with events appearing in the events list. A frequency less than the default time means the events list is more up-to-date but there’s a cost with system overhead. |
| Log Level | Defines the log-level. The default is INFO. Valid values are:
|
| Event Cache Size | Defines the cache size of the monitored event. The default is 3.
The greater the cache size, the faster the reload time but with more memory required. |
| Max Parallel Threads | Defines the maximum number of threads to be monitored in parallel. Default value is 10.
For a heavily loaded system you may want to increase this setting to avoid missing instrumentation. However, the greater the number, the more memory required. |
| Collection Timing (ms) | Defines the minimum method timing to be collected for profiling. Methods that spend less than this timing are not recorded or reported. Default value is 1 millisecond.
This setting lets you reduce the amount of data that’s collected so you can concentrate on slower methods. |
| Sampling Interval (ms) | Defines the interval between two consecutive samplings. Default is 50 milliseconds.
The smaller the sampling interval, the more precise the sampling but with greater system overload. |
| Start Delay (ms) | Defines the delay time before instrumentation and sampling starts. Default is 50 milliseconds.
This setting lets you ignore any small and fast events. |
| Write Quick Event Report | Defines whether or not to produce a separate event report using text format. Default is False.
Valid values are True or False. |
After you make changes, you can:
-
Update — Saves the changes but does not update the configuration file.
-
Save — Saves the changes and updates the configuration file.
Here’s the location of the configuration file:
<domain_home>/tahoe/<server_name>/tahoe.cfg -
Revert to Saved — Removes your changes and restores the last saved configuration settings.
How do I add methods to the instrumentation configuration?
You can add and remove methods to and from the instrumentation configuration using the sampling method tree, the thread dump, or the Configuration page. You can also add and remove methods from the instrumented method tree.
You don’t have to stop and start WebCenter Portal Performance Pack or the target JVM when you add or remove methods. You just perform the task.
To add or remove methods using the sampling method tree:
-
Go to the Configuration page and verify instrumentation and sampling have been enabled.
Note:
Once you’ve enabled the instrumentation and sampling, you must access the webapp to ensure that data is loaded in the sampling tree. -
Go to the Sampling Method Tree section to see the key methods that may have been missed in the configuration.
-
Find the method you want to instrument and select Watch. To remove methods from being instrumented, just unselect Watch from the instrumentation and/or sampling method trees.
A confirmation dialog is displayed for both actions.
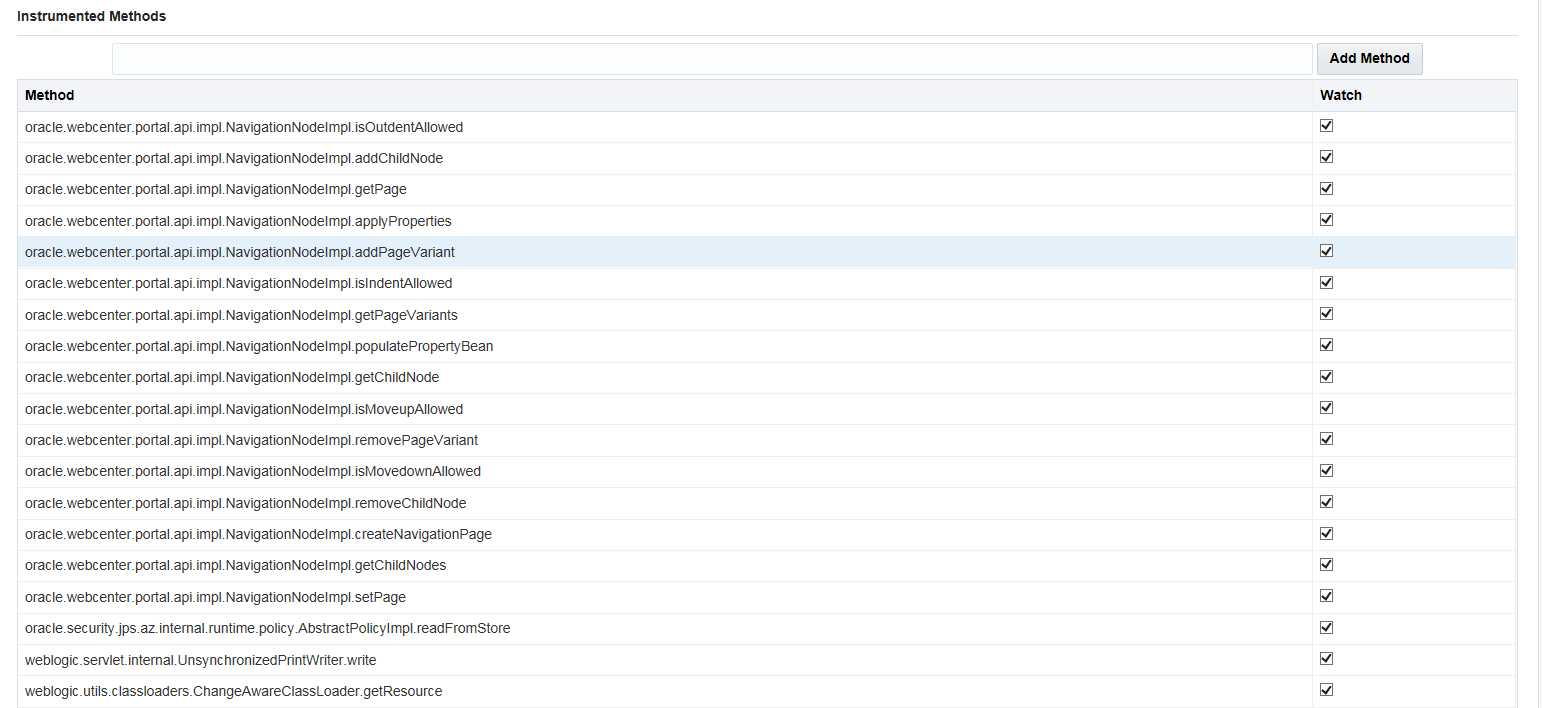
Now let’s say you’ve added some new code to Oracle WebCenter Portal and you want to monitor the performance. You can add and/or remove instrumented methods manually from the Configuration page.

Description of the illustration GUID-03F00834-F329-48EA-8C7E-D1D0D6353E59-default.png
To add new methods to the configuration
-
Go to the Configuration page and verify instrumentation and sampling have been enabled.
-
Go to the Instrumented Method section and simply add your method (
package.class.name) and click Add Method. -
Repeat the previous step until you’ve added all the methods you’re interested in from your new code.
-
Save the configuration.
-
Sign in to Oracle WebCenter and perform functions using your new code.
-
Return toWebCenter Portal Performance Pack and monitor the performance for your new methods using the Events list or Method Statistics.
Note:
Methods displayed in “Grey” colored Italics indicate classes that are yet to be loaded by the JVM. You should wait for the class to be invoked by the program and start watching it once it is loaded. Methods displayed in “Blue” indicate changes that are not yet saved to the configuration file.
You can remove methods from the configuration by simply unselecting Watch for selected methods and then saving the configuration.
Note:
If you click Update, you’ll change the properties in memory and the properties do take effect; but they don’t persist to file until you click Save.