3 Working with Method Statistics and Dump Threads
This section discusses how to find methods for optimization as well as how to find methods that are causing serious performance issues.
How do I find methods for optimization?
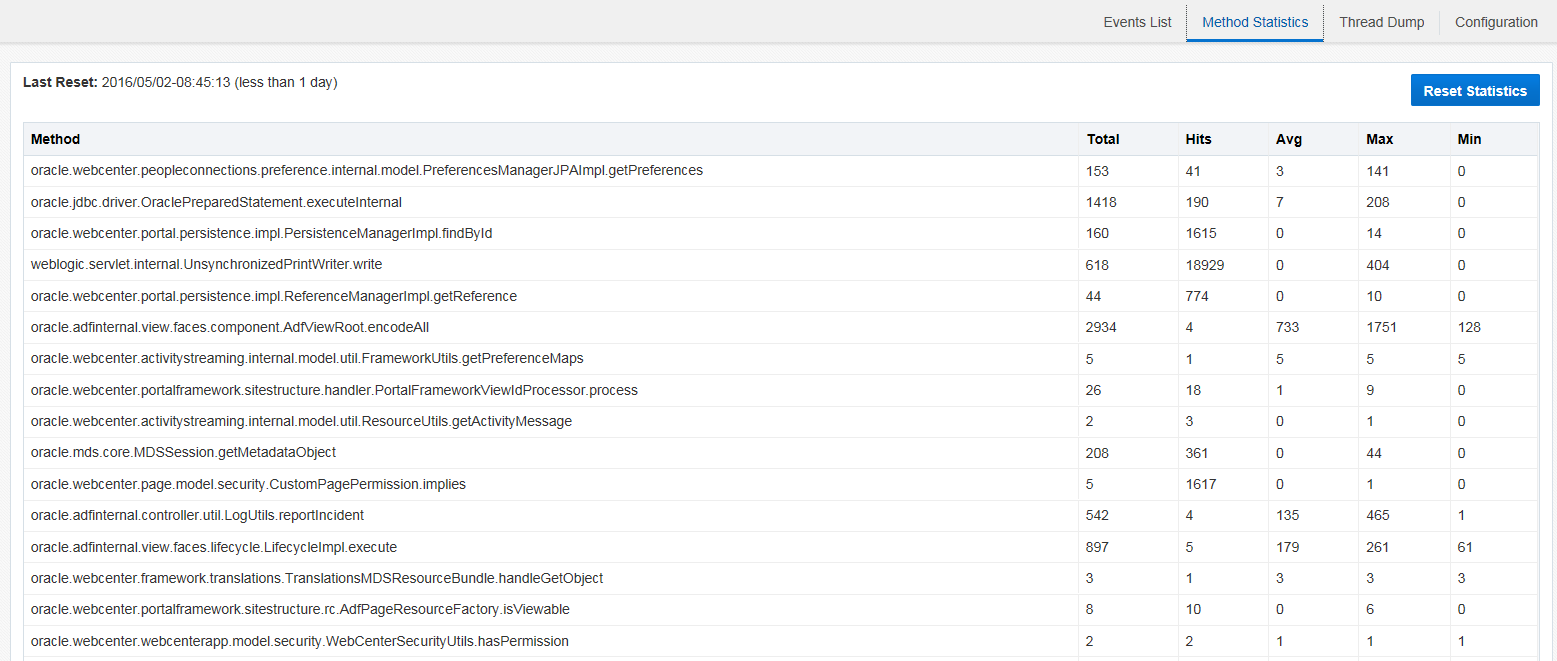
The Method Statistics page is used to help you identify methods that can be optimized based on aggregated statistics.
Let’s say you have expanded your company and will be hiring 50 new employees. This means that additional users will soon be performing the set of tasks that current users perform in Oracle WebCenter Portal on a daily basis. You want to know if you can optimize any methods to make sure that performance isn’t compromised by adding these new users.
To find methods for possible optimization:
-
Go to the Method Statistics page and click Reset Statistics to remove all the current methods listed.
-
Sign in to Oracle WebCenter Portal and perform the required set of tasks.
-
Go to the Method Statistics page.
Every instrumented method that was executed during the test has been aggregated and is listed in the table.

Description of the illustration GUID-0DDBE658-5A2A-4F84-99C2-6E61025906B6-default.png
By scanning the list of methods and concentrating on the number of hits and total time for each method, you can easily determine methods that are the most expensive. By eliminating high-level methods you can then limit your search to low-level methods. For these methods you should also take into consideration the minimum, maximum, and average times. By optimizing the methods that are most expensive you should not find any performance issues when new users are added.
How do I locate cause of serious performance issues?
If users are experiencing serious slowness or the system has hung when using Oracle WebCenter Portal, you can perform a thread dump.
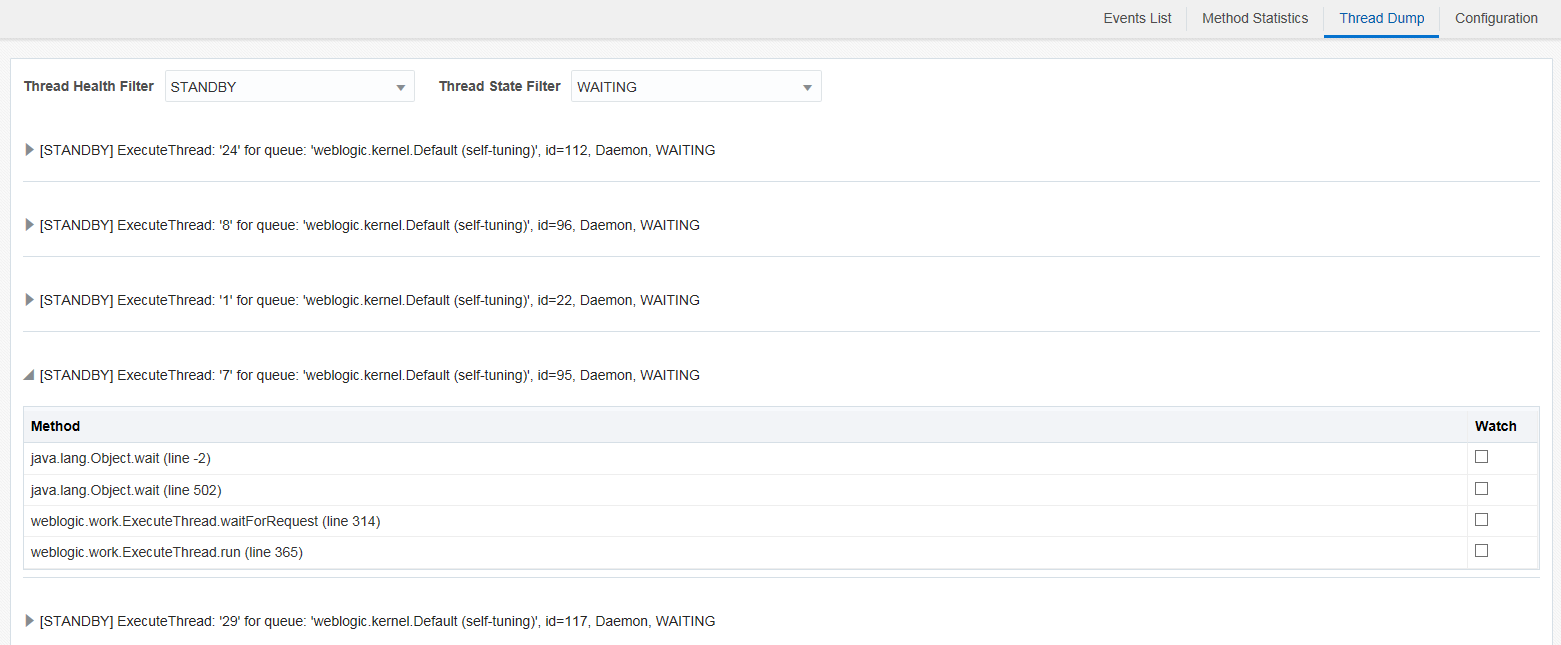
The thread health status is what’s assigned to threads based on certain time thresholds that have been allotted for specific actions to complete. For example, let’s say a thread is waiting for response from the database. While it’s waiting for a new request, it’s given the health status STANDBY. By default, the request timeout is set to 10 mins in the WebLogic Server. If a request has not finished processing after the time specified, the health status changes to STUCK.
Threads are also assigned a server status that you can see displayed at the end of the thread name.
To perform a thread dump, simply click the Thread Dump tab. The page opens with the results of the dump. You can filter the data by health status (ALL, ACTIVE, STANDBY, SUSPENDED, STUCK and/or server status (WAITING, RUNNABLE, TIMED-WAITING, and PENDING). Note that only states that are present in the current thread dump appear in the drop-down menus.

Description of the illustration GUID-2D8B69F6-0686-4378-8751-4DC2142E4B23-default.png
If your system has a serious performance issue, you can rapidly diagnose the problem causing the slowdown by filtering by the status STUCK.
You can expand specific threads to view the methods associated. Note that the methods may take awhile to load. You can then select to instrument suspect methods by selecting to watch them. You don’t have to stop and restart WebCenter Portal Performance Pack or the target JVM to begin watching these suspect methods.