1 Getting Started with Visual Analyzer
This topic helps you understand Visual Analyzer and how to navigate the home page.
About Oracle Data Visualization
Oracle Data Visualization makes it easy for you to quickly explore your data and discover meaningful insights. It includes tools to help you analyze data in your Oracle Business Intelligence repository as well as data outside the repository, with easy to use visualization and data management tools.
What is the Visual Analyzer Home Page?
You can use the Visual Analyzer home page to create, edit, or view visual analyzer projects, dashboard, or analyses.
In Oracle BI EE the Visual Analyzer Home Page is also called the New Home Page. You can toggle from the Visual Analyzer home page to the Oracle BI EE home page, which is also called the OBI Classic page, by clicking Open OBI Classic. Use the OBI Classic page to create other business intelligence objects such as alerts, prompts, and Oracle Business Intelligence Publisher reports. See What is the Oracle BI EE Home Page?
The home page is the location from where you begin your data visualization tasks. The following sections outline the tasks you can perform.
Creating and Using Data Sources
The Data Sources area contain the data that you use to create visualizations and analyses. A data source can be either a subject area or a data set. You can create data sets by either uploading an Excel file or by building a connection to Oracle BI Applications or to a database. See Adding Your Own Data.
Using the Catalog
The Display area provides several categories to help you quickly locate analyses, dashboards, and visualization projects stored in the catalog. Use My Folder or Shared Folders to browse the catalog. Or click the Favorites, Recents, VA Projects, Dashboards, or Analyses category to quickly locate an object that you recently viewed or a specific object by type.
Searching for Objects in the Catalog
You can use keywords to search for the objects in the catalog. Type a search term in the Find content or visualize field to see a list of objects that match your search criteria, and click on a row with the magnifying glass icon (located at the top of the dropdown window in the Search results containing section). See Searching for Projects and Visualizations.
Visualizing Data with BI Ask
You can use BI Ask to quickly combine existing data objects into a visualization. Type a search term in the Find content or visualize field to see a list of objects that match your search criteria, and click on a row with an data attribute icon (located in the Visualize data using section of the dropdown window) to start building your visualization. See Visualizing Data with BI Ask.
Creating Objects
-
VA Project as described in Typical Workflow for Exploring Content
-
Dashboard as described in Creating Dashboards in User’s Guide for Oracle Business Intelligence Enterprise Edition
-
Analysis as described in Specifying the Criteria for Analyses in User’s Guide for Oracle Business Intelligence Enterprise Edition
Getting More Information
You can learn more about the home page functions by clicking Academy to access additional information sources to help you work with Oracle BI EE.
Searching for Projects and Visualizations
From the Home page you can quickly and easily search for saved objects.
Visualizing Data with BI Ask
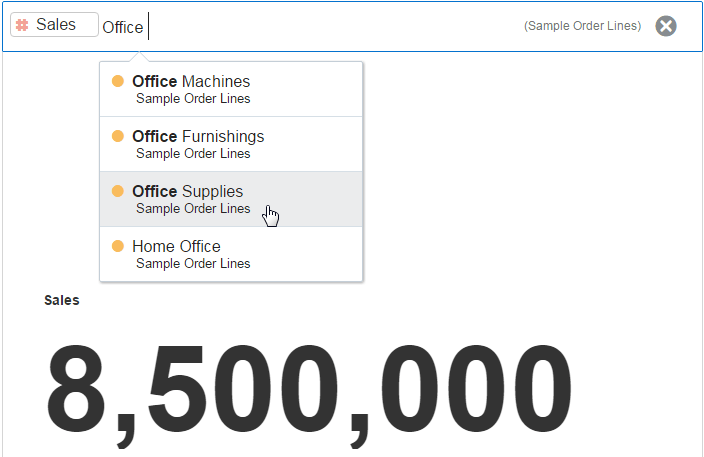
Use BI Ask to enter column names into the search field, select them, and quickly see a visualization containing those columns. You can use this functionality to perform impromptu visualizations without having to first build a project.
- In the Home Page, click the Find content or visualize field.
- Enter your criteria. As you enter the information, the application returns search results in a drop-down list. If you select an item from this drop-down list, then your visualized data is displayed.
-
What you select determines the data source for the visualization, and all other criteria that you enter is limited to columns or values in that data source. The name of the data source you’re choosing from is displayed in the right side of the Find content or visualize field. Note the following BI Ask search and visualization example:

Description of the illustration GUID-1A462EC3-0B8E-44FB-925D-C6E9D20ABAF2-default.gif -
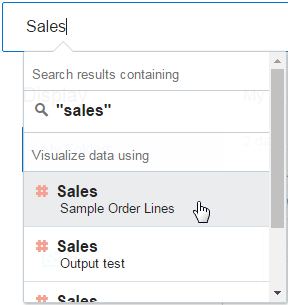
You can use the Find content or visualize field to search for projects and visualizations or to use BI Ask. When you enter your initial search criteria, the drop-down list contains BI Ask results, which are displayed in the Visualize data using section of the drop-down list. Your initial search criteria also build a search string to find projects and visualizations. That search string is displayed in the Search results containing section of the drop-down list and is flagged with the magnifying glass icon. See Search Tips.

Description of the illustration GUID-EFC73807-BAA8-4356-83AA-187AA978C337-default.gif
-
- Enter additional criteria in the search field, select the item that you want to include, and the application builds your visualization.
- Optional. Enter the name of the visualization that you want your results to be displayed in. For example, enter scatter to show your data in a scatter plot chart, or enter pie to show your data in a pie chart.
- Optional. Click Change Visualization Type to apply a different visualization to your data.
- Optional. Click Open in Data Visualization to further modify and save the visualization.
- To clear the search criteria, in the Find content or visualize field, click the X icon.
Search Tips
You must understand how the search functionality works and how to enter valid search criteria.
Wildcard Searches
You can use the asterisk (*) as a wildcard when searching. For example, you can specify *forecast to find all items that contain the word “forecast. ” However, using two wildcards to further limit a search returns no results (for example, *forecast*).
Meaningful Keywords
When you search, use meaningful keywords. If you search with keywords such as by, the, and in it returns no results. For example, if you want to enter by in the search field to locate two projects called “Forecasted Monthly Sales by Product Category” and “Forecasted Monthly Sales by Product Name,” then it returns no results.
Items Containing Commas
If you use a comma in your search criteria the search returns no results. For example, if you want to search for quarterly sales equal to $665,399 and enter 665,399 in the search field, then no results are returned. However, entering 655399 does return results.
Date Search
If you want to search for a date attribute, you search using the year-month-date format. Searching with the month/date/year format (for example, 8/6/2016) doesn’t produce any direct matches. Instead, your search results contain entries containing 8 and entries containing 2016.
Searching in Non-English Locales
When you enter criteria in the search field, what displays in the drop-down list of suggestions can differ depending upon your locale setting. For example, if you’re using an English locale and enter sales, then the drop-down list of suggestions contains items named sale and sales. However, if you’re using a non-English locale such as Korean and type sales, then the drop-down list of suggestions contains only items that are named sales and items such as sale aren’t included in the drop-down list of suggestions.
For non-English locales, Oracle suggests that when needed, you search using stem words rather than full words. For example, searching for sale rather than sales returns items containing sale and sales. Or search for custom to see a results list that contains custom, customer, and customers.