6 Managing Data that You Added
This topic describes the functions available to manage the data that you added from data sources.
Typical Workflow for Managing Added Data
Here are the common tasks for managing the data added from data sources.
| Task | Description | More Information |
|---|---|---|
| Manage added data | Modify, update, and delete the data that you added from various data sources. | Managing Data Added from Data Sources |
| Refresh data | Refresh data in the data set when newer data is available or refresh the cache for Oracle Applications and databases if the data is stale. | Refreshing Data that You Added |
| Update details of added data | Inspect and update the properties of the added data. | Updating Details of Data that You Added |
| Manage data sets | See the available data sets and examine or update a data set's properties. | Managing Data Sets |
| Blend data | Blend data from one data source with data from another data source. |
Managing Data Added from Data Sources
You can modify, update, and delete the data that you added from various data sources to Data Visualization.
Managing Data Sets
You can use the Data Sets page to see all of the available data sets.
Note:
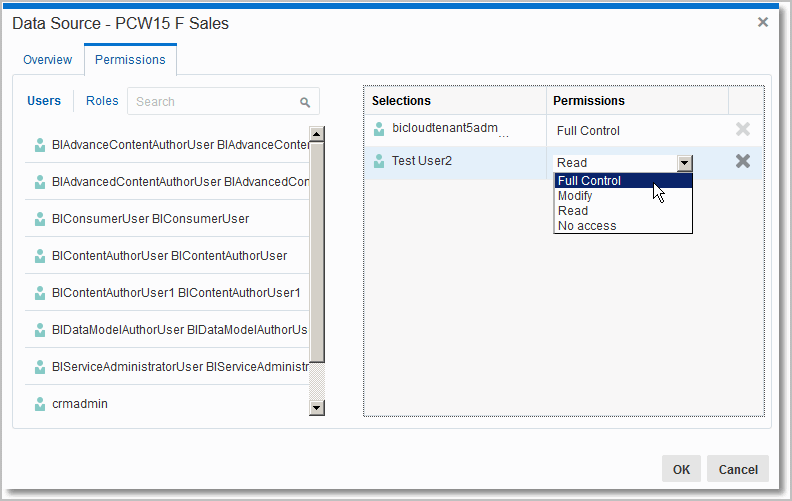
If you have Full Control permissions, you can grant permissions to others and delete uploaded data sets, but be careful not to delete a data file that is still a data source for projects. See Deleting Data that You Added.Refreshing Data that You Added
After you add data, the data might change, so you must refresh the data from its source.
Note:
Rather than refreshing a data set, you can replace it by loading a new data set with the same name as the existing one. However, replacing a data set can be destructive and is discouraged. Don’t replace a data set unless you understand the consequences:
-
Replacing a data set breaks projects that use the existing data set if the old column names and data types aren’t all present in the new data set.
-
Any data wrangling (modified and new columns added in the data stage) is lost and projects using the data set are likely to break.
Databases
For databases, the SQL statement is rerun and the data is refreshed.
CSV or TXT
To refresh a CSV or TXT file, you must ensure that it contains the same columns that are already matched with the date source. If the file that you reload is missing some columns, then you’ll see an error message that your data reload has failed due to one or more missing columns.
You can refresh a CSV or TXT file that contains new columns, but after refreshing, the new columns are marked as hidden and don’t display in the Data Elements pane for existing projects using the data set. To resolve this issue, use the Inspect option of the data set to show the new columns and make them available to existing projects.
Excel
To refresh a Microsoft Excel file, you must ensure that the newer spreadsheet file contains a sheet with the same name as the original one. In addition, the sheet must contain the same columns that are already matched with the data source. If the Excel file that you reload is missing some columns, then you'll see an error message that your data reload has failed due to one or more missing columns.
You can refresh an Excel file that contains new columns, but after refreshing, the new columns are marked as hidden and don’t display in the Data Elements pane for existing projects using the data set. To resolve this issue, use the Inspect option of the data set to show the new columns and make them available to existing projects.
Oracle Applications
You can reload data and metadata for Oracle Applications data sources, but if the Oracle Applications data source uses logical SQL, reloading data only reruns the statement, and any new columns or refreshed data won’t be pulled into the project. Any new columns come into projects as hidden so that existing projects that use the data set aren’t affected. To be able to use the new columns in projects, you must unhide them in data sets after you refresh. This behavior is the same for file-based data sources.
Updating Details of Data that You Added
After you add data, you can inspect its properties and update details such as the description and aggregation.
Deleting Data Sets from Data Visualization
You can delete data sets from Data Visualization when you need to free up space on your system.
- Go to the Data page and select Data Sets.
- Select the data set you want to delete and click the Actions Menu or right-click, then select Delete.
Modifying and Adding Uploaded Data Sets
You can modify and manage the data sets that you created and then added to visualization projects.
Modifying Uploaded Data Sets
You can modify uploaded data sets to help you further curate (organize and integrate from various sources) data in projects. This is also sometimes referred to as data wrangling.
You can create new columns, edit columns, and hide and show columns for a data set. The column editing options depend on the column data type (date, strings, or numeric). Selecting an option invokes a logical SQL function that edits the current column or creates a new one in the selected data set.
For example, you can select the Convert to Text option for the Population column (number data type). It uses the formula of the Population column, and wraps it with a logical SQL function to convert the data to text and adds that newly converted data text column to the data set. Note that the original Population column isn’t altered.
Modifying data sets can be very helpful in cases where you haven’t been able to perform joins between data sets because of dirty data. You can create a column group or build your own logical SQL statement to create a new column with which you essentially "scrub" data (amend or remove data in the database that isn't correct in some way).
-
For a date or time column, create a year, quarter, month, or day column.
-
For an attribute column, convert a column to a number or convert it to a date. You can:
-
Concatenate or replace the column.
-
Group or split the column.
-
Apply uppercase, lowercase, or sentence-case to the data items in the column.
-
-
For a measure column, apply operators such as power, square root, or exponential.
Renaming a Data Set
Even if you change the name of a data set, that change doesn't affect the reference for the project; that is, the project using the specific data set continues to work.
-
Go to the Data page and select Data Sets.
-
Select a data set you want to rename and click the Actions menu or right-click, then select Edit.
-
Click Edit Data Set table icon.
-
Change the value in the Name field, then click Save.
If a data set with the same name already exits in your system, an error message is displayed. Click Yes to overwrite the existing data set (with the data set whose name you're changing) or cancel the name change.
Modifying the Data Set Columns
-
In the Project Editor, click the Prepare canvas.
-
On the project toolbar, click Stage.
-
If there is more than one uploaded data set in the project, then go to the tabs at the bottom of the window and select the data set that you want to work with. The first 100 records in the selected data set are displayed.
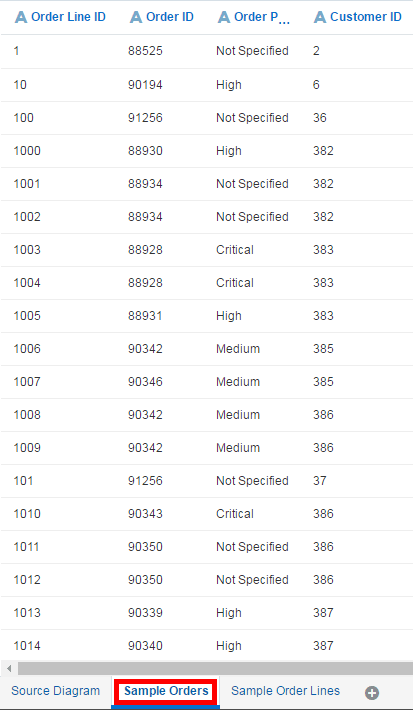
Description of the illustration GUID-D50F26EB-2ECE-4374-A594-D477AAE5413D-default.gif -
If there are more than one uploaded data sets in the project, select the one you want to work with. Only the first 100 records in the selected data set are displayed.

Description of the illustration GUID-656C5708-D105-441B-A4F5-BB0D4993771C-default.gif -
Click Options for the column that you want to work with, and then select an option to modify or convert the column. The options list and column modifications you can perform depends on the type of column you’re working with.
Data wrangling doesn't modify the original columns in the data set. Instead, it creates duplicate columns.
-
Click Save.
Note:
When you edit a data set in this way, it affects all projects that use the data set. For example, if another user has a project that uses the data set that you modified, and they open the project after you change the data set, they see a message in their project that indicates that the data set has been modified.The following table lists the column options that might be available.
| Column Option | Description |
|---|---|
| Day, Month Name, Quarters, Year | NA |
| Edit | Edits the current column and can be used to reformat a source column without creating a second column and hiding the original column. |
| Hide | Hides the column in the Data Elements pane and in visualizations on the canvas. If you want to see hidden columns, click Hidden columns (ghost icon) on the page footer. You can then unhide individual columns or unhide all hidden columns at the same time. |
| Group, Conditional Group | Select Group to create your own custom groups. For example, you can group States together into custom Regions. Or you can categorize dollar amounts into groups indicating small, medium, and large. |
| Split | Splits a specific column value into parts. For example, you can split a column called Name into first and last name. |
| Uppercase | Updates the contents of a column with the values in all capital letters. |
| Lowercase | Updates the contents of a column with the values all in lowercase letters. |
| Sentence Case | Updates the contents of a column to make the first letter of the first word of a sentence uppercase. |
| Rename | Allows you to change the name of any column. |
| Duplicate | Creates a column with the identical contents of the selected column. |
| Convert to Text | Changes the data type of a column to Text. |
| Replace | Changes specific text in the selected column to a different specified value. For example, you can change all instances of Mister to Mr. in the column. |
| Create | Creates a column based on a function. |
| Convert to Number | Changes the data type of the column to Number, which deletes any values that aren't numbers from the column. |
| Convert to Date | Changes the data type of the column to Date, which deletes any values that aren’t dates from the column. |
| Bin | Creates your own custom groups for number ranges. For example, you can create bins for an Age column with age ranges binned into Pre-Teen, Young Adult, Adult, Senior based on custom requirements. |
| Log | Calculates the natural logarithm of an expression. The logarithm is the inverse operation to exponentiation, just as division is the inverse of multiplication. That means the logarithm of a number is the exponent to which another fixed number, the base, must be raised to produce that number. For example, log2 64 = 6, as 64 = 26. |
| Power | Takes the values of a column and raises them to the power that you specify. The default power is 2. |
| Square Root | Creates a new column populated with the square root of the value in the column selected. |
Adding Data to a Project
You can add one or more data sets to your new or existing projects.
You can use the Add Data Set page to familiarize yourself with all available data sets. Data sets have distinct icons to help you quickly identify them by type.
- You can add a data set to a project in two ways:
- To create a new project, go to the Home page, click Create, then click Project to display the Add Data Set dialog.
- If you’re working with an existing project, then open the project and in the Data Elements pane click Add (+), then Add Data Set to display the Add Data Set dialog.
- Build your project using the columns that are displayed in the Data Elements pane. Or if needed, explore or modify the data set to better fit your project.
- You can create new columns, edit columns, and hide and show columns in the data set. See Modifying Uploaded Data Sets.
- If your project contains two data sets, then you can blend the data from one data set with the other. See Blending Data that You Added and About Changing Data Blending.
- You can review your data set’s columns to better understand its data. See unresolvable-reference.htm.
Removing Data from a Project
You can remove a data set from a project.
About Editing Data Sets
You can work with data sets in Data Visualization that come from spreadsheets, Oracle Applications, or database data sources.
The image shows the Data Set editor when you’re working with a data set created from a subject area or analysis in an Oracle application. The Data Set editor looks different and enables you to perform different tasks when you’re working with a data set created from a spreadsheet or a database. In the Data Set editor you perform tasks such as searching or browsing for columns, adding filters, updating column attributes, and writing Logical SQL.
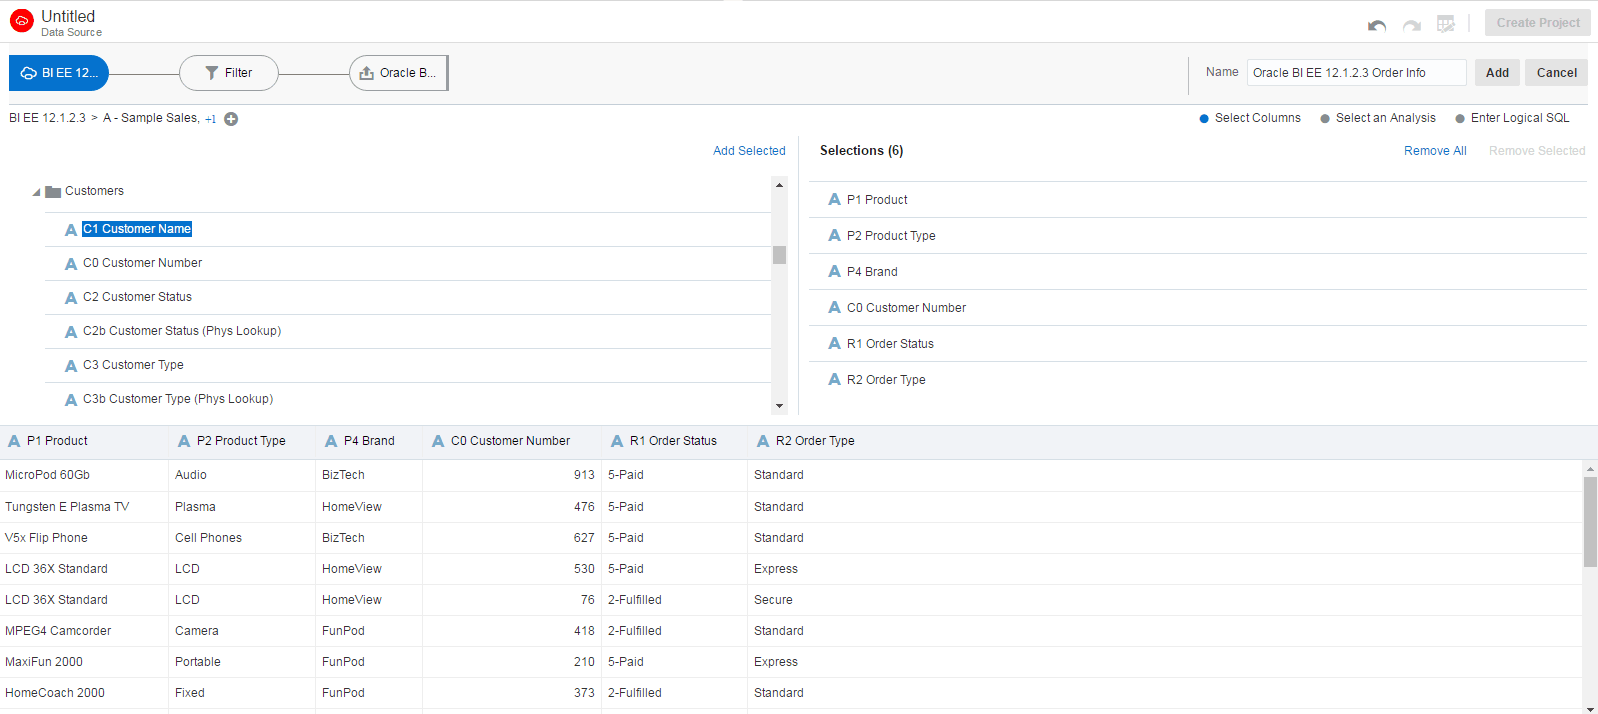
Description of the illustration GUID-C70CB7F0-902E-45D6-A4EC-2180F936D717-default.gif
You can edit data sets in the Data Set dialog:
-
You can navigate between the column selector page, the filters page, and the information page when working with data sets created from Oracle Applications or databases by clicking the bubbles on the Step editor.
-
You can see a sample of the data set’s data by clicking Get Preview Data or the Preview Data icon. For example, to see if the filtered data is what you expect, add a filter and then select Get Preview Data.
-
You can include or exclude a related subject area, when you’re working with a data set created from a subject area by clicking Add/Remove Related Subject Area.
-
You can adjust column attributes of a data set that is created from a spreadsheet or a database. For example, you can configure a column to be treated as a measure or an attribute, and if a measure column, you can add an aggregation.
-
You can specify which query mode to use when refreshing a data set created from a database.
-
You can edit the SQL statement of a data set, when it is created from a database or Oracle Applications.
Blending Data that You Added
You might have a project where you added multiple data sets. You can blend data from one data set with data from another data set.
When you add more than one data set to a project, the system tries to find matches for the data that’s added. It automatically matches external dimensions where they share a common name and have a compatible data type with attributes in the existing data set.
Data sets that aren't joined are divided by a line in the Data Elements pane of the project. If the project includes multiple data sets and if any aren't joined, then you'll see restrictions between data elements and visualizations. For example, you can't use the data elements of a data set in the filters, visualizations, or calculations of another data set if they're not joined. If you try to do so, you see an error message. You can match data elements of data sets that aren't joined in the Data Diagram of a project, or you can create individual filters, visualizations, or calculations for each data set.
You can specify how you want the system to blend your data. See About Changing Data Blending.
- Add one or multiple data sets to your project. See Adding Data from External Sources .
- In the Data Elements pane, click Menu, then Data Diagram. You can also select a data set in the Data Element pane, then right-click and select Data Diagram.
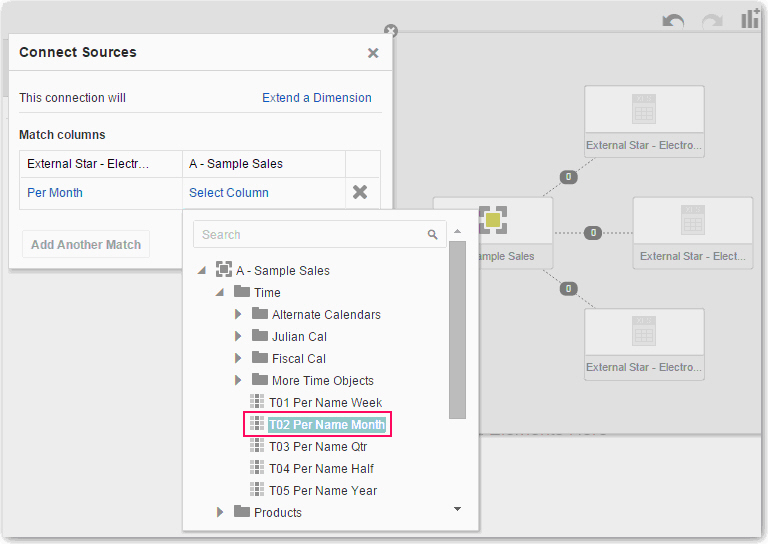
- Click the number along the line that connects the external source to the newly loaded source to display the Connect Sources dialog.
- In the Connect Sources dialog, make changes as necessary.
- Click OK to save the matches from the external source to the data model on the server.
About Changing Data Blending
Sometimes Data Visualization omits rows of data that you expect to see in a data set. This happens when your project includes data from two data sets that contain a mixture of attributes and values, and there are match values in one source that don’t exist in the other.
When this happens, you must specify which data set to use for data blending. See Changing Data Blending.
Suppose we have two data sets (Source A and Source B) with slightly different rows, as shown in the following image. Note that Source A doesn‘t include IN-8 and Source B doesn’t include IN-7.
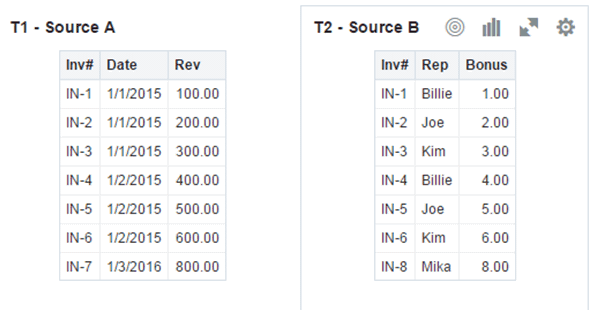
Description of the illustration GUID-E59DBD51-1745-4319-A8CA-0C009E177897-default.gif
The following results are displayed if you select the All Rows data blending option for Source A and select the Matching Rows data blending option for Source B. Because IN-7 doesn’t exist in Source B, the results contain null Rep and null Bonus.

Description of the illustration GUID-1C542D71-9750-490B-98E6-809A8FC7E71E-default.gif
The following results are displayed if you select the Matching Rows data blending option for Source A and select the All Rows data blending option for Source B. Because IN-8 doesn’t exist in Source A, the results contain null Date and null Revenue.

Description of the illustration GUID-1F6068C4-1AD8-4EDD-80F0-C9EC8F8FB795-default.gif
The visualization for Source A includes Date as an attribute, and Source B includes Rep as an attribute, and the match column is Inv#. Under dimensional rules, you can’t use these attributes with a measure from the opposite table unless you also use the match column.
There are two settings for blending tables that contain both attributes and measures. These are set independently in each visualization based on what columns are used in the visualization. The settings are All Rows and Matching Rows and they describe which source rows the system uses when returning data to be visualized.
The system automatically assigns data blending according to the following rules:
-
If the visualization contains a match column, then the system sets sources with the match column to All Rows.
-
If the visualization contains an attribute, then the system sets its source to All Rows and sets the other sources to Matching Rows.
-
If attributes in the visualization come from the same source, then the system sets the source to All Rows, and sets the other sources to Matching Rows.
-
If attributes come from multiple sources, then the system sets the source listed first in the project's elements panel to All Rows and sets the other sources to Matching Rows.
