12 Diagnostics and Performance Monitoring
It covers the following topics:
Diagnosing and Resolving Issues in Oracle BI Publisher
System administrators are typically responsible for supporting end users when they experience issues with the use of Oracle BI Publisher and for interacting with Oracle Support to understand the cause of issues and apply fixes.
Issues may be reported in response to end users receiving error messages, experiencing poor performance, or lack of availability.
The principal activities administrators perform to support issue resolution include:
-
Examination of error and diagnostic log information. For more information, see:
-
Examination of system and process metrics to understand availability and performance issues. For more information, see:
About Diagnostic Log Files
BI Publisher writes diagnostic log files in the Oracle Diagnostic Logging (ODL) format.
Log file naming and the format of the contents of log files conform to an Oracle standard. You can view log files by using the WLST displayLogs command, or you can download log files to your local client and view them using another tool (for example a text editor, or another file viewing utility).
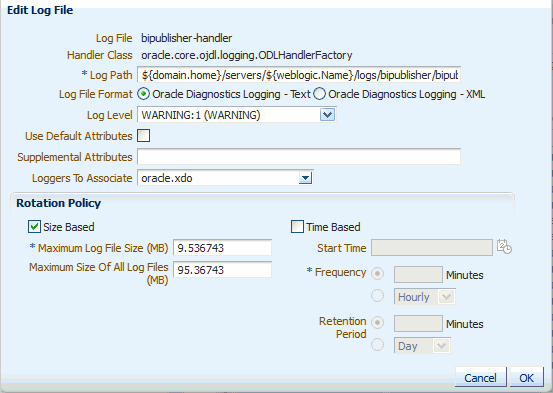
Log files are created and edited using Oracle Fusion Middleware Control. By default, after installation, the bipublisher-handler log is created. You can configure this log file or create a new logger.
About Log File Message Categories and Levels
Each log file message category is set to a specific default value between 1-32, and only messages with a level less or equal to the log level are logged.
Various log file message categories exist, as described in the table below.
| Level | Description |
|---|---|
|
IncidentError:1 |
A serious problem caused by unknown reasons. You can only fix the problem by contacting Oracle support. Examples are errors from which you cannot recover or serious problems. |
|
Error:1 |
A problem requiring attention from the system administrator has occurred, and is not caused by a bug in the product. No performance impact. |
|
Warning:1 |
A potential problem that should be reviewed by the administrator. Examples are invalid parameter values or a specified file does not exist. |
|
Notification:1 |
A major lifecycle event such as the activation or deactivation of a primary sub-component or feature. This is the default level for NOTIFICATION. |
|
NOTIFICATION:16 |
A finer level of granularity for reporting normal events. |
|
TRACE:1 |
Trace or debug information for events that are meaningful to administrators, such as public API entry or exit points. |
|
TRACE:16 |
Detailed trace or debug information that can help Oracle Support diagnose problems with a particular subsystem. |
|
TRACE:32 |
Very detailed trace or debug information that can help Oracle Support diagnose problems with a particular subsystem. |
About Log File Formats
A log file must contain a consistent format.
However, since there can be multiple formats, you can change the format used in a log file. When you change the format used in a log file, and the new format differs from the current log file's format, a new log file is created. For example, a log file that contains ODL-XML, always contains XML, and is never mixed with text.
Configure the log file format in the Edit Log File dialog. See Configuring Log Files. The format can by Text or XML.
Configuring Log Files
Use Oracle Fusion Middleware Control to configure BI Publisher log files.
See the following topics:
Setting the Log Level
You can set the log level in Oracle Fusion Middleware Control.
Enabling Diagnostics for Scheduler Jobs
You can enable diagnostics for a scheduler job in the Schedule Report Job page, and download the diagnostic logs from Report Job History.
To enable and download diagnostics for a scheduler job:
Enabling Diagnostics for Online Reports
In the Report Viewer, you can enable diagnostics for online reports.
Administrators and BI Authors can enable diagnostics before running the online report, and then download the diagnostic logs after the report finishes. Diagnostics are disabled by default.
If you enable diagnostics for an online report with interactive output, you can:
-
Download the following diagnostic logs in a .zip file:
-
SQL logs
-
Data engine logs
-
Report Processor logs
-
-
View the following details in the diagnostic logs:
-
Exceptions
-
Memory guard limits
-
SQL query
-
To enable diagnostics and download the diagnostic logs for an online report:
- If the report is running, click Cancel to stop the report execution.
- Click Actions in the Report Viewer.
- Select Enable Diagnostics from the Online Diagnostics option.
- Submit the report.
- To download the diagnostic logs after the report runs:
- Click Actions in the Report Viewer.
- Select Download Diagnostics from the Online Diagnostics option.
Viewing Log Messages
You can view log messages using Oracle Fusion Middleware Control or you can view the log files directly.
To view log messages in Oracle Fusion Middleware Control:
Viewing Messages by Reading the Log File
The log file is located in the directory that is specified in the Log Path in the Edit Log File dialog. Navigate to the directory on the server to view the log file.
The following example shows an ODL format error message:
<msg time="2009-07-30T16:00:03.150-07:00" comp_id="xdo" type="ERROR" level="1" host_id="MyBIPHost" host_addr="122.22.222.22" module="oracle.xdo" tid="11" user="Administrator">
<txt>Variable 'G_dept' is missing...</txt>
</msg>
The table below describes the message attributes displayed in the log file:
| Attribute Name | Description |
|---|---|
|
time |
The date and time when the message was generated. This reflects the local time zone. |
|
comp_id |
The ID of the component that originated the message. |
|
type |
The type of message. Possible values are: INCIDENT_ERROR, ERROR, WARNING, NOTIFICATION, TRACE, and UNKNOWN. See About Log File Message Categories and Levels for information about the message types. |
|
level |
The message level, represented by an integer value that qualifies the message type. Possible values are from 1 (highest severity) through 32 (lowest severity). |
|
host_id |
The name of the host where the message originated. |
|
host_addr |
The network address of the host where the message originated. |
|
module |
The ID of the module that originated the message. If the component is a single module, the component ID is listed for this attribute. |
|
tid |
The ID of the thread that generated the message. |
|
user |
The name of the user whose execution context generated the message. |
About Performance Monitoring and User Auditing
Performance monitoring enables you to monitor the performance of queries, reports and document generation and to analyze the provided details.
BI Publisher collects performance statistics through Oracle Dynamic Monitoring Service (DMS). You can monitor the performance data by using the DMS Spy servlet provided by DMS on Enterprise Manager at http://server_address:enterprise_manager_port/dms/Spy. BI Publisher also provides MBeans that reveal attributes, operations, and relevant statistics gathered by DMS. The table below summarizes the beans that are provided.
| Management Bean | Description |
|---|---|
|
ReportEventMonitor |
Creates an Mbean per report and displays detailed monitoring data for the report. |
|
ServerEventMonitor |
Exists per server and displays user and server activity summaries. |
|
UserEventMonitor |
Creates an Mbean per user and displays detailed monitoring data for the user. |
Enabling Monitoring and Auditing
You enable monitoring and auditing on the Administration Server Configuration page
To enable monitoring and editing:
-
Enable Monitor and Audit on the Administration Server Configuration page. See Enabling Monitor and Audit on the Server Configuration Page.
-
Configure the Audit Policy Settings with Fusion Middleware Control (Enterprise Manager). See Configuring the Audit Policy Settings.
-
Restart WebLogic Server.
Enabling Monitor and Audit on the Server Configuration Page
You can turn on monitoring and auditing for the BI Publisher application.
- Click the Administration link.
- Under System Maintenance, click Server Configuration.
- Under the Monitor and Audit region, select the Enable Monitor and Audit check box.
Configuring the Audit Policy Settings
Configure Audit Policy settings in Oracle Fusion Middleware Control.
To configure the audit policy settings
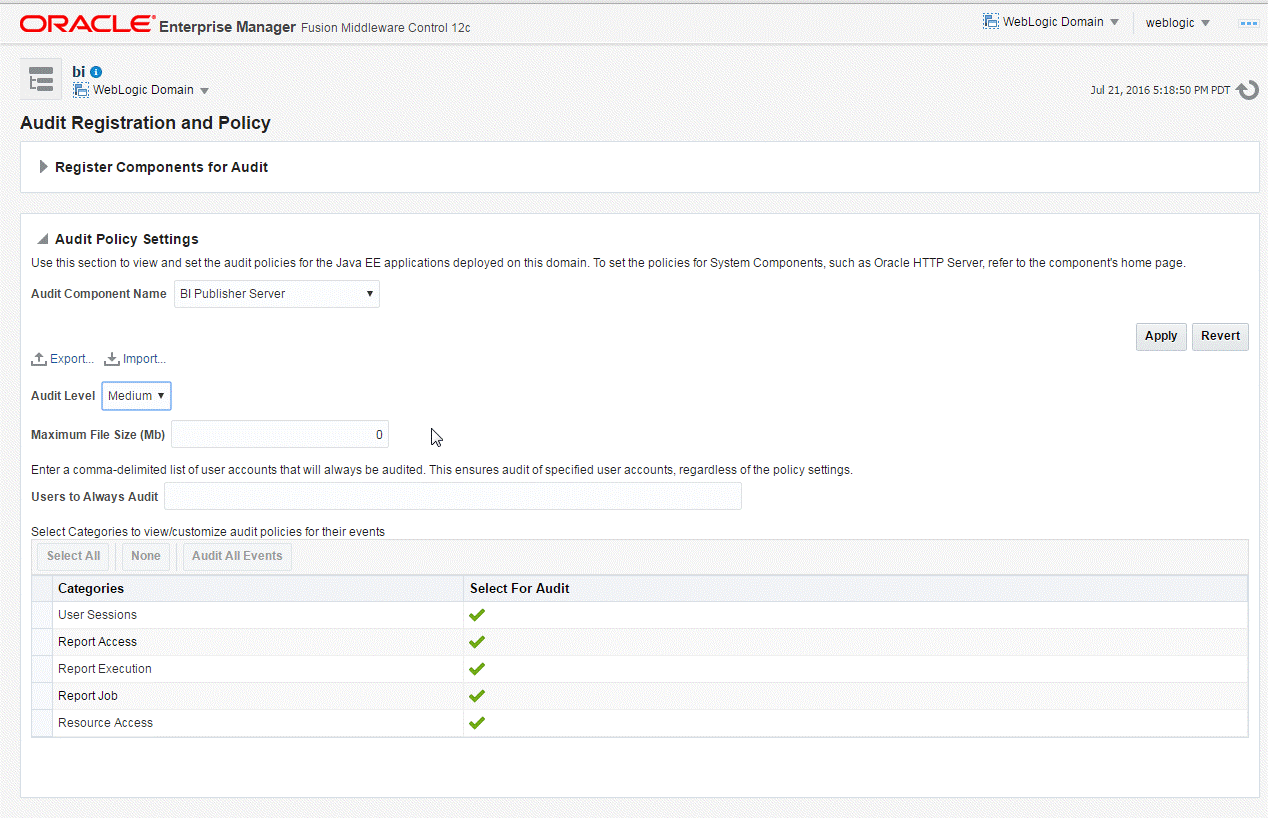
Typically, set the Audit Level to Medium.
To customize the audit level for each event, select Custom from the Audit Level list. This setting enables you to set the audit level for each event and apply filters. Select a category (User Session, Report Access, Report Execution, Report Job, or Report Access) to view the available events.
The events that are audited for the BI Publisher server are:
-
User Login
-
User Logout
-
Report Request
-
Scheduled Report Request
-
Report Republish
-
Report Data Download
-
Report Download
-
Report Data Process
-
Report Rendering
-
Report Delivery
-
Report Job Scheduled
-
Report Job Canceled
-
Report Job Deleted
-
Report Job Purged
-
Report Job Resumed
-
Report Job History Deleted
-
Report Job History Purged
-
Resource Created
-
Resource Updated
-
Resource Copied
-
Resource Deleted
-
Resource Renamed
Viewing the Audit Log
You can view the audit log under the under the bipublisher folder under the WebLogic Server BI server directory. ORACLE_HOME/user_projects/domains/bi/servers/bi_server1/logs/auditlogs/bipublisher/audit_1_0.log.
You can also query the audit repository on database. You can create your own reports using BI Publisher to analyze the data collected.
For more information on the reports provided by Audit Framework, see Securing Applications with Oracle Platform Security Services.
In 12c release, when you configure the BI domain, an audit schema is created, a data source is created, and the audit database is registered for your domain.
Using BI Publisher to Create Audit Reports
Once auditing is configured, you can use BI Publisher to create your own reports to visualize your auditing data.
To create a report on your auditing data in BI Publisher:
- Register the data source in BI Publisher.
- Create a data model.
- Create the report.
Registering the Data Source in BI Publisher
Register the audit data source (JNDI/JDBC connection) that you created in the previous procedure as a JNDI data source in BI Publisher.
Because you created a JDBC connection registered as JNDI, you do not need to create a new JDBC connection by typing the connection URL, username/password, and so on. You can just register it using the JNDI name (for example: jdbc/AuditDB).
- Log in to BI Publisher with administrator privileges and click the Administration link.
- Under Data Sources, click JNDI Connection, then click Add Data Source.
- Enter the Data Source Name and JNDI Name jdbc/AuditViewDataSource.
- Click Test Connection to ensure that the data source connection works.
- Add the appropriate roles to the data source so that the report developers and consumers can view the reports built on this data source.
- Click Apply to save.
Creating a Data Model
Run SQL queries against the BIPUBLISHER_V view to create data models.
To create a data model from your auditing data source:
Note:
See Data Modeling Guide for Oracle Business Intelligence Publisher.
Viewing Performance Statistics in DMS Spy
Only users with administrator privileges can use the DMS Spy servlet to view the performance statistics collected by the Report Event Monitor, User Event Monitor, and Server Event Monitor.
Viewing Performance Statistics in the MBean Browser
You can use the System MBean browser to view the performance statistics collected by the Report Event Monitor, Server Event Monitor, and User Event Monitor.
- In Oracle Fusion Middleware Control, click WebLogic Domain, and select System MBean Browser.
- In the System MBean Browser, under the Application Defined MBeans, expand the oracle.xdo folder to view the BI Publisher MBeans. Expand the list and select the bean to view the details.

