11 Managing Analytics
This chapter describes how to configure and manage Analytics for WebCenter Portal and Portal Framework applications. Analytics enables you to display usage and performance metrics for these applications.
Always use Fusion Middleware Control or the WLST command-line tool to review and configure back-end services for WebCenter Portal and Portal Framework applications. Any configuration changes that you make postdeployment are stored in the MDS metadata store as customizations. See Section 1.3.5, "Oracle WebCenter Portal Configuration Considerations." Any changes that you make to Analytics Collector configuration are stored in the Analytics database.
Note:
Changes that you make to Analytics configuration through Fusion Middleware Control or using WLST are not dynamic so you must restart the managed server on which the Analytics Collector or portal application is deployed for your changes to take effect. See Section 7.2, "Starting and Stopping Managed Servers for WebCenter Portal Application Deployments."
This chapter includes the following sections:
-
Section 11.5, "Registering an Analytics Collector for Your Application"
-
Section 11.8, "Viewing the Current WebCenter Portal's Analytic Event List"
Permissions:
To perform the tasks in this chapter, you must be granted the WebLogic Server Admin role through the Oracle WebLogic Server Administration Console and the Administrator role in the deployed application:
-
WebCenter Portal:
Administratorrole granted through Portal Builder Administration. -
Portal Framework application:
Administratorrole granted through the Administration Console.
For more information about roles and permissions, see Section 1.8, "Understanding Administrative Operations, Roles, and Tools."
11.1 About Analytics in WebCenter Portal
Analytics allows WebCenter Portal administrators and business users to track and analyze portal usage. Analytics provides the following basic functionality:
-
Usage Tracking Metrics: Analytics collects and reports metrics for common portal functions, including community, page, portlet, and document visits.
-
Behavior Tracking: Users can analyze portal metrics to determine usage patterns, such as portal visit duration and usage over time.
-
User Profile Correlation: Users can correlate metric information with user profile information. Usage tracking reports can be viewed and filtered by user profile data such as country, company, or state. For more details, see the "Query Options" section in Oracle Fusion Middleware Building Portals with Oracle WebCenter Portal.
An overview of Analytics components and ready-to-use task flows are described in the following sections:
11.1.1 Analytics Components
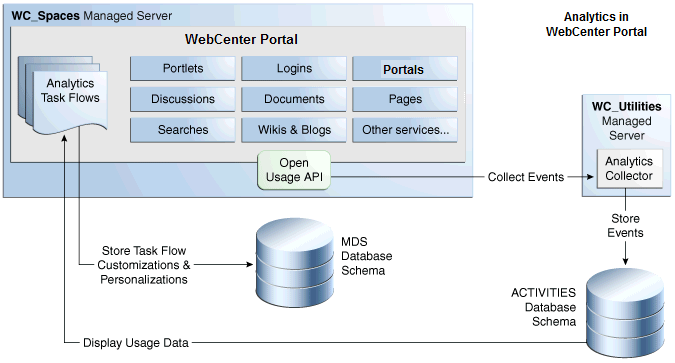
Figure 11-1 illustrates components for Analytics in WebCenter Portal:
-
WC_Spaces - The managed server in which the WebCenter Portal is deployed.
(Portal Framework applications are deployed on different managed servers.)
-
WC_Utilities - The managed server in which the Analytics Collector is deployed.
-
Event Data - Analytics tracks and collects a defined set of events. A comprehensive set of the most common events are provided out-of-the-box.
-
Open Usage API - The OpenUsage API sends metrics to the Analytics Collector using UDP (User Datagram Protocol).
-
Analytics Collector - The Analytics Collector component gathers event data.
Analytics Collectors can be clustered to provide increased scalability and reliability.
-
Analytics Database - The Analytics database (ACTIVITIES) stores metrics gathered from portal and non-portal events.
-
Analytics Task Flows - Analytics provides a series of task flows to report metrics for common portal functions.
-
MDS - The Oracle Metadata Services (MDS) repository that stores task flow customizations.
11.1.2 Analytics Task Flows
Table 11-1 lists the Analytics task flows available with WebCenter Portal. The task flows work similarly for Portal Framework applications and WebCenter Portal. For detailed information about these task flows and how to use them, see the "About Analytics"section in Oracle Fusion Middleware Building Portals with Oracle WebCenter Portal.
Table 11-1 Analytics Task Flows in WebCenter Portal
| Analytics Task Flows | Description |
|---|---|
|
WebCenter Portal Traffic |
A summarized view for common events within the portal. |
|
Page Traffic |
Displays the number of page visits and the number of unique users that visited any page within the portal. |
|
Login Metrics |
Reports portal logins. |
|
Portlet Traffic |
Displays usage data for a portlet. |
|
Portlet Response Time |
Displays performance data for a portlet. |
|
Portlet Instance Traffic |
Displays usage data for a portlet instance. When the same portlet displays on several different pages, each placement is considered as a portlet instance. |
|
Portlet Instance Response Time |
Displays performance data for a portlet instance. |
|
Search Metrics |
Tracks portal searches. |
|
Document Metrics |
Tracks document views. |
|
Wiki Metrics |
Tracks most popular/least popular wikis. |
|
Blog Metrics |
Tracks most popular/least popular blogs. |
|
Discussion Metrics |
Tracks most popular/least popular discussions. |
|
Portal Traffic* |
(WebCenter Portal only) Displays usage data for a portal. |
|
Portal Response Time* |
(WebCenter Portal only) Displays page performance data for a portal. |
* These task flows are specific to WebCenter Portal. These task flows are not available for Portal Framework applications.
11.2 Configuration Roadmap for Analytics
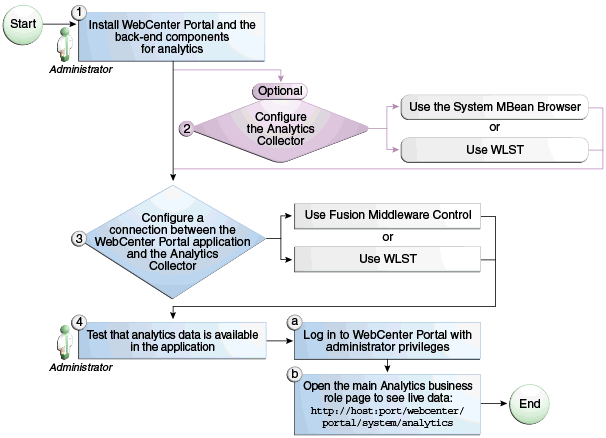
The flow chart in Figure 11-2 and tasks in Table 11-2 provide an overview of the prerequisites and tasks required to get Analytics working in WebCenter Portal.
Table 11-2 Configuring Analytics for Use in WebCenter Portal
| Actor | Task | Sub-task |
|---|---|---|
|
Administrator |
1. Install Oracle WebCenter Portal and the back-end components for Analytics. |
|
|
Administrator |
2. (Optional) Configure the Analytics Collector Settings using either of the following tools: |
|
|
Administrator |
3. Configure a connection between the WebCenter Portal and the Analytics Collector using either of the following tools: |
|
|
WebCenter Portal Administrator |
4. Test that analytics data is available in WebCenter Portal |
4.a Log into WebCenter Portal with administrator privileges 4.b Open the main Analytics business role page to see live data:
|
11.3 Analytics Prerequisites
This section includes the following subsections:
11.3.1 Analytics - Installation
The Analytics Collector is an optional installation option for Oracle WebCenter Portal. To install this product, select Oracle WebCenter Portal Analytics Collector in the Fusion Middleware Configuration Wizard. For detailed installation instructions, see Oracle Fusion Middleware Installation Guide for Oracle WebCenter Portal.
The Analytics schema (ACTIVITIES) and the WebCenter Portal schema (WEBCENTER) can be installed on the same database or on separate databases.
11.3.2 Analytics - Configuration
The Analytics Collector is configured to receive events out-of-the-box, using installation defaults. If the default values are not suitable for your installation or you have a cluster, you may configure different values using WLST or MBeans Browser. For more details, Section 11.4, "Configuring Analytics Collector Settings."
Out-of-the-box, WebCenter Portal is not configured to send events to the Analytics Collector. If you want to collect usage and performance metrics for WebCenter Portal (or any Portal Framework application) you must register the Analytics Collector and enable event collection. For more details, see Section 11.5, "Registering an Analytics Collector for Your Application." Once connected, analytics data is collected and displays in your application (through Analytics task flows) without further configuration.
11.3.3 Analytics - Security Considerations
In WebCenter Portal, Resource Catalogs only display Analytics task flows to users with appropriate permissions:
-
Administrators - Users with the
Administratorrole have access to all Analytics task flows -
Moderators - Within a particular portal, members with the
Moderatorrole have access to Analytics task flows that display usage data for that portal only
Analytics usage data is valuable for portal analysis but might be regarded as private or sensitive to portal users. To protect security and privacy interests associated with usage metrics WebCenter Portal administrators and individual portal moderators must manage page security such that only appropriate, specified users have access to pages that expose analytics data. See also, the "Setting Page Security" section in Oracle Fusion Middleware Building Portals with Oracle WebCenter Portal.
Similarly, developers building Portal Framework applications must set up a suitable security model for exposing Analytics task flows and data. For details, see the "Setting up Security for Analytics Task Flows and Usage Data" section in Oracle Fusion Middleware Developing Portals with Oracle WebCenter Portal and Oracle JDeveloper.
11.3.4 Analytics - Limitations
Analytics task flows do not display custom event information.
11.4 Configuring Analytics Collector Settings
During installation, the Analytics Collector is configured to receive events using the following default values:
-
Collector Host Name - localhost
-
Default Port - 31314
-
Maximum Port Number - 31314
-
Broadcast Type - Multicast
-
Clustering - The clustering settings do not apply. Clustering is not supported in this version.
If these default values are not suitable for your installation or you have a cluster, you can configure suitable values using WLST or the MBeans Browser in Fusion Middleware Control:
These Analytics Collector configuration settings are stored in the Analytics database (ACTIVITIES).
11.4.1 Setting Analytics Collector Properties Using WLST
Use the WLST command setAnalyticsCollectorConfig to set event collection properties for the Analytics Collector. For command syntax and examples, see the "setAnalyticsCollectorConfig" section in Oracle Fusion Middleware WebLogic Scripting Tool Command Reference.
For information on how to run WLST commands, see Section 1.13.3.1, "Running Oracle WebLogic Scripting Tool (WLST) Commands."
Note:
To start using the property values you must restart the managed server on which the Analytics Collector application is deployed (WC_Utilities). For more information, see the "Starting and Stopping Managed Servers Using WLST" section in Oracle Fusion Middleware Administrator's Guide.
11.4.2 Setting Analytics Collector Properties Using Fusion Middleware Control
Use the Systems MBeans Browser in Fusion Middleware Control to set event collection properties for the Analytics Collector:
To configure the Analytics Collector (deployed on the WC_Utilities managed server):
-
Log in to Fusion Middleware Control and navigate to the home page for WebCenter Portal or your Portal Framework application. For more information, see:
-
Open the System MBean Browser:
-
For WebCenter Portal - From the WebCenter Portal menu, select System MBean Browser.
-
For Portal Framework applications - From the Application Deployment menu, select System MBean Browser.
-
-
Navigate to:
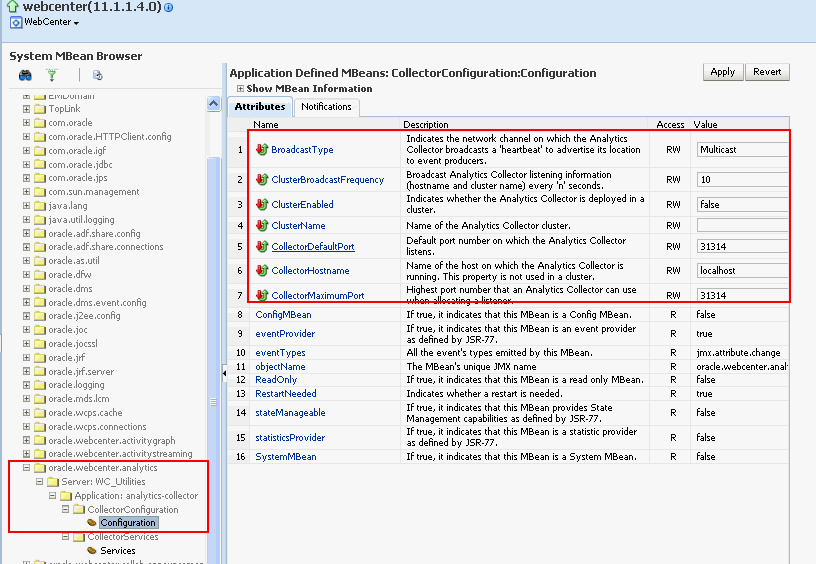
Application Defined MBeans >oracle.webcenter.analytics >Server: WC_Utilities >Application: analytics-collector >CollectorConfiguration >ConfigurationAlternatively, search for
CollectorConfigurationor filter the System MBean Browser tree using the MBean pattern:oracle.webcenter.analytics:* -
Modify configuration properties for the Analytics Collector. For details, see Table 11-3.
Table 11-3 Analytics Collector - Configuration Properties
Field Description BroadcastType
Specify the network channel on which the Analytics Collector broadcasts a 'heartbeat' to advertise its location to event producers. Valid values are
BroadcastandMulticast:Broadcast - use the standard network broadcast channel.
Multicast - use a special fixed multicast address.
CollectorHostName
Enter the name of the host on which the Analytics Collector is running.
The default setting is
localhost.CollectorDefaultPort
Enter the default port number on which the Analytics Collector listens. The default value is
31314.CollectorMaximumPort
Enter the highest port number that an Analytics Collector can use when allocating a listener.
This property is mostly used in a clustered environment where multiple collectors run in the same box. Each collector listens for incoming UDP messages on a free port within a given port range. The range is from the default port number to the maxPort number.
ClusterEnabled
The clustering settings do not apply. Clustering is not supported in this version.
ClusterName
The clustering settings do not apply. Clustering is not supported in this version.
HeartbeatFrequency
The clustering settings do not apply. Clustering is not supported in this version.
-
To start using the new settings you must restart the managed server on which the Analytics Collector application is deployed (
WC_Utilities). For more information, see Section 7.2, "Starting and Stopping Managed Servers for WebCenter Portal Application Deployments."
11.5 Registering an Analytics Collector for Your Application
Events raised in WebCenter Portal or a Portal Framework application using OpenUsage APIs can be sent to an Analytics Collector for use by Analytics, Recommendations and the Activity Graph Engine. If you intend to use any of the features or task flows provided by these tools you must connect WebCenter Portal or the Portal Framework application to an Analytics Collector.
While you can register multiple Analytics Collector connections for WebCenter Portal or your Portal Framework application, only one Analytics Collector is used - the default (or active) connection.
To start using a new configuration you must restart the managed server on which WebCenter Portal or your Portal Framework application is deployed.
This section includes the following subsections:
-
Section 11.5.1, "Registering an Analytics Collector Using Fusion Middleware Control"
-
Section 11.5.2, "Registering an Analytics Collector Using WLST"
-
Section 11.5.3, "Disabling WebCenter Portal Event Collection"
11.5.1 Registering an Analytics Collector Using Fusion Middleware Control
To register an Analytics Collector for WebCenter Portal or a Portal Framework application:
-
Log in to Fusion Middleware Control and navigate to the home page for WebCenter Portal or your Portal Framework application. For more information, see:
-
Open the Service Configuration page:
-
For WebCenter Portal - From the WebCenter Portal menu, select Settings > Service Configuration.
-
For Portal Framework applications - From the Application Deployment menu, select WebCenter Portal > Service Configuration.
-
-
From the list of services on the WebCenter Portal Service Configuration page, select Analytics and Activity Graph.
-
To connect to an Analytics Collector, click Add (Figure 11-4).
-
Enter a unique name for this connection.
The name must be unique (across all connection types) within WebCenter Portal or your Portal Framework application.
-
Select Active Connection to use this connection for Analytics and Activity Graph.
While you can register multiple Analytics Collector connections for WebCenter Portal or your Portal Framework application, only one connection is used—the default (or active) connection.
-
Select Enable WebCenter Portal Event Collection to send analytics events raised using OpenUsage APIs to the Analytics Collector.
Deselect this option if you do not want to collect analytics data.
-
Enter connection details for the Analytics Collector. For details, see Table 11-4.
Table 11-4 Analytics Collector Connection - Connection Details
Field Description Messaging Mode
This property specifies whether to send events to a clustered Analytics Collector in multicast mode or a single Analytics Collector using unicast communication. Clustering the Analytics Collector is not supported in the current release, so the only valid value for this release is
Unicast.Collector Host Name
If the messaging mode is set to
Unicast, enter the host name where the Analytics Collector is running.The default setting is
localhost.Collector Port
Enter the port on which the Analytics Collector listens for events. The default value is
31314.Cluster Name
If the messaging mode is set to
Multicast, enter the name of the cluster where a clustered Analytics Collector is running.Timeout (Seconds)
If the messaging mode is set to
Multicast, enter the length of time (in seconds) to wait for a response from the Analytics Collector.The default value is 30 seconds.
-
Click OK to save.
-
To start using the new (active) connection you must restart the managed server on which WebCenter Portal or your Portal Framework application is deployed. For more information, see Section 7.2, "Starting and Stopping Managed Servers for WebCenter Portal Application Deployments."
11.5.2 Registering an Analytics Collector Using WLST
Use the WLST command createAnalyticsCollectorConnection to create an Analytics Collector connection for WebCenter Portal or your Portal Framework application. To update an existing connection, use setAnalyticsCollectorConnection. For command syntax and examples, see the "createAnalyticsCollectorConnection" and "setAnalyticsCollectorConnection" sections in Oracle Fusion Middleware WebLogic Scripting Tool Command Reference.
For information on how to run WLST commands, see Section 1.13.3.1, "Running Oracle WebLogic Scripting Tool (WLST) Commands."
Note:
To start using the new connection, ensure that isEnabled=1 and default=1, and then restart the managed server on which WebCenter Portal or your Portal Framework application is deployed. See the "Starting and Stopping Managed Servers Using WLST" section in Oracle Fusion Middleware Administrator's Guide.
11.5.3 Disabling WebCenter Portal Event Collection
If you do not want to collect events raised using OpenUsage APIs, you can stop event transmission temporarily or permanently.
This section includes the following subsections:
-
Section 11.5.3.1, "Disabling WebCenter Portal Event Collection Using Fusion Middleware Control"
-
Section 11.5.3.2, "Disabling WebCenter Portal Event Collection Using WLST"
11.5.3.1 Disabling WebCenter Portal Event Collection Using Fusion Middleware Control
To disable event collection for WebCenter Portal or your Portal Framework application:
-
Log in to Fusion Middleware Control and navigate to the home page for WebCenter Portal or your Portal Framework application. For more information, see:
-
Open the Service Configuration page:
-
For WebCenter Portal - From the WebCenter Portal menu, select Settings > Service Configuration.
-
For Portal Framework applications - From the Application Deployment menu, select WebCenter Portal > Service Configuration.
-
-
From the list of services on the WebCenter Portal Service Configuration page, select Analytics and Activity Graph.
-
Select the connection in the table, and then click Edit.
-
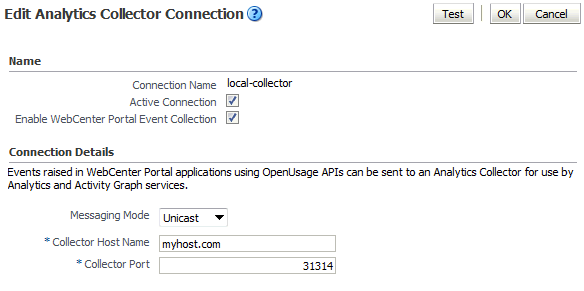
Deselect Enable WebCenter Portal Event Collection (Figure 11-5).
-
To effect this change you must restart the managed server on which WebCenter Portal or your Portal Framework application is deployed. For more information, see Section 7.2, "Starting and Stopping Managed Servers for WebCenter Portal Application Deployments."
11.5.3.2 Disabling WebCenter Portal Event Collection Using WLST
To disable event collection using WLST, run the setAnalyticsCollectorConnection command with the isEnabled argument set to 0 (false). For command syntax and examples, see the "setAnalyticsCollectorConnection"section in Oracle Fusion Middleware WebLogic Scripting Tool Command Reference.
For information on how to run WLST commands, see Section 1.13.3.1, "Running Oracle WebLogic Scripting Tool (WLST) Commands."
11.6 Configuring User Profile Events Timing
User profile information is cached, meaning that changes to a user profile are not visible in reports until the cache is updated. The cache is limited to 1000 objects by default, with each object remaining in the cache for 60 minutes by default. You can change these values using WLST. To change the maximum number of objects in the cache, run the setProfileCacheNumberOfObjects command. To change the time an object remains idle in the cache, run the setProfileCacheTimeToLive command.
For information on how to run WLST commands, see Section 1.13.3.1, "Running Oracle WebLogic Scripting Tool (WLST) Commands."
11.7 Validating Analytic Event Collection
You can check whether events reach the Analytics Collector by checking the trace log at:
<base_domain_name>/servers/WC_Utilities/logs/analytics-collector/collector.trc
Event messages are similar to the following:
[2010-09-16T07:13:56.906-07:00] [WC_Utilities] [TRACE] []
[SRC_METHOD: OnMessageReceived] Event = [[
EVENT_TYPE: {http://www.myorg.com/videoapp}VIDEOVIEWS
VERSION: 3.0.XXXX
AS_DIMENSION_USER.USERID: testuser01
VIDEO.RESOURCEID: video8736
VIDEO.TITLE: Project Kick Off
VIDEO.LOOP: false
QUALITY: 720
PROPERTY_VERSION: 3.0.XXXX
To display analytics collector configuration information, enter the following URL:
http://hostname:WC_Utilities_port/collector
This page lists the following:
-
Collector Default Port
-
Collector Max Port
-
Collector Server Name
-
Broadcast Type
-
Cluster Enabled
-
Cluster Name
-
Partitioning Enabled
-
Time Dimension for This Year
-
Space Dimension Exists (for WebCenter Portal)
11.8 Viewing the Current WebCenter Portal's Analytic Event List
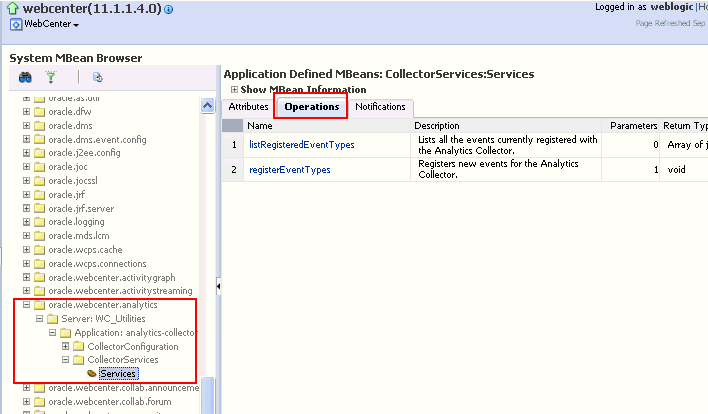
Use the Systems MBeans Browser in Fusion Middleware Control to see which events an Analytics Collector is configured to collect.
To display the current list of analytics events:
-
Log in to Fusion Middleware Control and navigate to the home page for WebCenter Portal or your Portal Framework application. For more information, see:
-
Open the System MBean Browser:
-
For the WebCenter Portal application - From the WebCenter Portal menu, select System MBean Browser.
-
For Portal Framework applications - From the Application Deployment menu, select System MBean Browser.
-
-
Navigate to:
Application Defined MBeans> oracle.webcenter.analytics Server: WC_Utilities> Application: analytics-collector> CollectorServices> ServicesAlternatively, search for
CollectorServicesor filter the System MBean Browser tree using the MBean pattern:oracle.webcenter.analytics:* -
Select the Operations tab.
-
Click listRegisteredEventTypes.
-
Click Invoke.
Alternatively, use the WLST command listAnalyticsEventTypes. For command syntax and examples, see the "listAnalyticsEventTypes" section in Oracle Fusion Middleware WebLogic Scripting Tool Command Reference.
11.9 Purging Analytics Data
For information about purging analytics data, see the "Purging Oracle WebCenter Portal's Analytics Data" section in Oracle Fusion Middleware Administrator's Guide.
11.10 Partitioning Analytics Data
For information about partitioning analytics data, see the "Partitioning Oracle WebCenter Portal's Analytics Data"section in Oracle Fusion Middleware Administrator's Guide.
11.11 Troubleshooting Issues with Analytics
If users cannot see analytics in WebCenter Portal or your Portal Framework application, verify the following:
-
Check that the Analytics Collector configuration is correct and in particular that both Enable WebCenter Event Collection and Active Connection are both set (Figure 11-7). See Registering an Analytics Collector for Your Application.
If you make changes to the connection you must restart the managed server on which WebCenter Portal or your Portal Framework application is deployed. For more information, see Section 7.2, "Starting and Stopping Managed Servers for WebCenter Portal Application Deployments."
-
If WebCenter Portal or your Portal Framework application was recently upgraded, verify that the domain startup script does not contain legacy Analytics Collector settings as these values override any connection details that you specify through Fusion Middleware Control or using WLST.
-
-
Shut down the managed server on which WebCenter Portal or your Portal Framework application is deployed.
-
Edit the domain startup script
setDomainEnvlocated at:UNIX:
DOMAIN_HOME/bin/setDomainEnv.shWindows:
DOMAIN_HOME\bin\setDomainEnv.cmd -
Remove Analytics Collector settings.
-
Restart the managed server.
-
