Using Advanced Breakpoint Techniques
-
Using breakpoint counts
-
Using bounded breakpoints
-
Picking a useful breakpoint count
-
Watchpoints
-
Using breakpoint conditions
-
Micro replay using pop
-
Using fix and continue
This section demonstrates some advanced techniques for using breakpoints:
This section, and the example program, are inspired by an actual bug discovered in dbx using much the same sequence described in this section.
Note - To get the correct output as shown in this section, the example program must still be "buggy". If you fixed the bug, re-download the OracleDeveloperStudio12.5-Samples directory from Example Program.
The source code includes a sample input file named in, which triggers a bug in the example program. in contains the following code:
display nonexistent_var	# should yield an error
display var
stop in X	# will cause one "stopped" message and display
stop in Y	# will cause second "stopped" message and display
run
cont
cont
run
cont
cont
When you run the program with the input file, the output is as follows:
$ a.out < in
> display nonexistent_var
error: Don't know about 'nonexistent_var'
> display var
will display 'var'
> stop in X
> stop in Y
> run
running ...
stopped in X
var = {
      a = '100'
      b = '101
      c = '<error>'
      d = '102
      e = '103'
      f = '104'
      }
> cont
stopped in Y
var = {
      a = '105'
      b = '106'
      c = '<error>'
      d = '107'
      e = '108'
      f = '109'
      }
> cont
exited
> run
running ...
stopped in X
var = {
      a = '110'
      b = '111'

      c = '<error>'
      d = '112'
      e = '113'
      f = '114'
      }
> cont
stopped in Y
var = {
      a = '115'
      b = '116'

      c = '<error>'
      d = '117'
      e = '118'
      f = '119'
      }
> cont
exited
> quit
Goodby
This output might seem voluminous but the point of this example is to illustrate techniques to be used with long running, complex programs where stepping through code or tracing just are not practical.
Notice that when showing the value of field c, you get a value of <error>. Such a situation might occur if the field contains a bad address.
The Problem
Notice that when you ran the program a second time, you received additional error messages that you did not get on the first run:
error: cannot get value of 'var.c'
The error() function uses a variable, err_silent, to silence error messages in certain circumstances. For example, in the case of the display command, instead of displaying an error message, problems are displayed as c = '<error>'.
Step 1: Repeatability
The first step is to set up a debug target and configure the target so the
bug can easily be repeated by clicking Restart  .
.
-
If you have not yet compiled the example program, do so by following the instructions in Example Program.
-
Choose Debug → Debug Executable.
-
In the Debug Executable dialog box, browse for or type the path to the executable.
-
In the Arguments field, type:
< in
The directory portion of the executable path is displayed in the Working Directory field.
-
Click Debug.

Start debugging the program as follows:
In a real world situation, you might want to populate the Environment field as well.
When debugging a program, dbxtool creates a debug target. You can use the same debugging configuration by choosing Debug → Debug Recent and then choosing the desired executable.
You can set many of these properties from the dbx command line. They will be stored in the debug target configuration.
The following techniques help sustain easy repeatability. As you add breakpoints, you can quickly go to a location of interest by clicking Restart without having to click Continue on various intermediate breakpoints.
Step 2: First Breakpoint
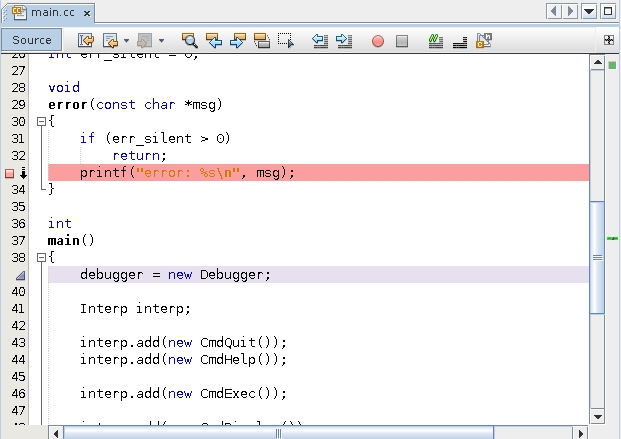
Put the first breakpoint inside the error() function in the case where it prints an error message. This breakpoint will be a line breakpoint on line 33.
In a larger program, you can easily change the current function in the Editor window by typing the following, for example, in the Debugger Console window:
(dbx) func error
The lavender stripe indicates the match found by the func command.
-
Create the line breakpoint by clicking in the left margin of the Editor window on top of the number 33.
-
Click Restart
 to run the program and upon hitting the
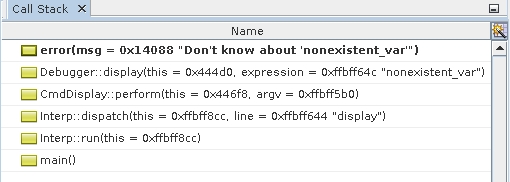
breakpoint, the stack trace shows the error message that is
generated due to the simulated command in the
in file:
to run the program and upon hitting the
breakpoint, the stack trace shows the error message that is
generated due to the simulated command in the
in file:> display var # should yield an error
The call to error() is expected behavior.
-
Click Continue
 to continue the process and hit the
breakpoint again.
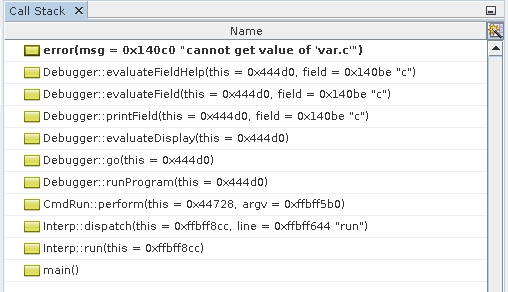
 An unexpected error message appears.
Step 3: Breakpoint Counts
It would be better to arrive at this location repeatedly on each run without having to click Continue after the first hit of the breakpoint due to the command:
> display var # should yield an error
You can edit the program or input script and eliminate the first troublesome display command. However, the specific input sequence you are working with might be a key to reproducing this bug so you do not want to alter the input.
-
In the Breakpoints window, right-click the breakpoint and choose Customize.
-
In the Customize Breakpoint dialog box, type 2 in the Count Limit field.
-
Click OK.
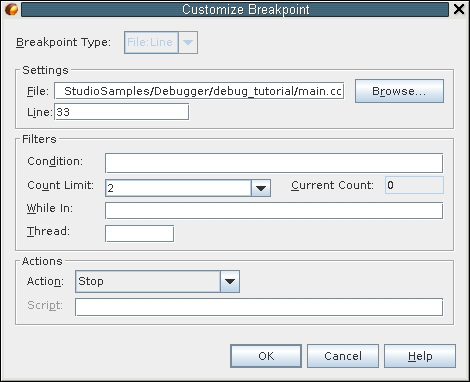
Because you are interested in the second time you reach this breakpoint, set its count to 2.
Now you can repeatedly arrive at the location of interest.
In this case,choosing a count of 2 was trivial. However, sometimes a place of interest is called many times. See Step 7: Determining the Count Valueto easily choose a good count value. But for now, you will explore another way of stopping in error() only in the invocation you are interested in.
Step 4: Bounded Breakpoints
-
Open the Customize Breakpoint dialog box for the breakpoint inside error() and disable breakpoint counts by selecting Always Stop from the drop-down list for the Count Limit.
-
Rerun the program.
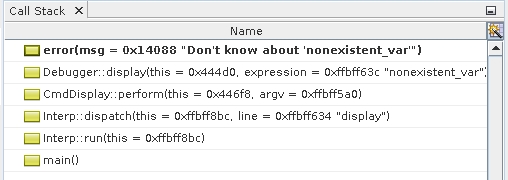
Pay attention to the stack trace the two times you stop in error(). The first time, the stop in error() looks like the following screen:
The second time, the stop in error() looks like the following screen:
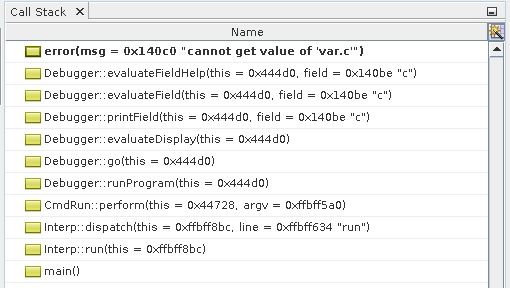
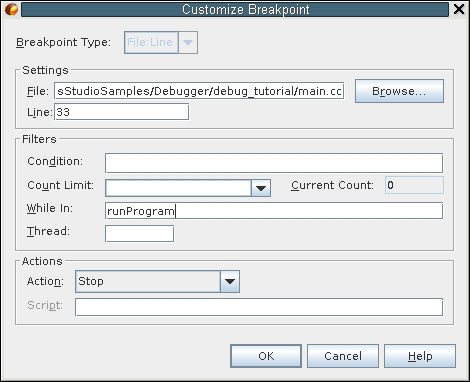
To arrange to stop at this breakpoint when it is called from runProgram (frame [7]), open the Customize Breakpoint dialog box again and set the While In field to runProgram.
Step 5: Looking for a Cause
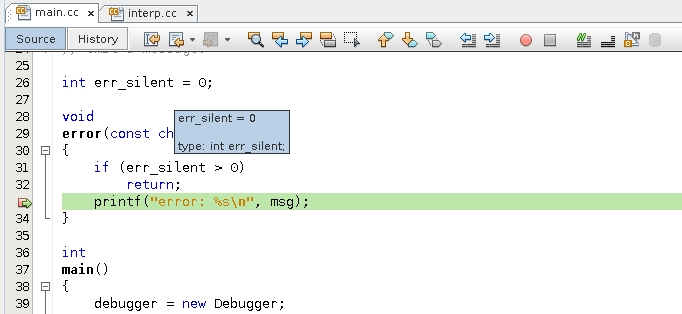
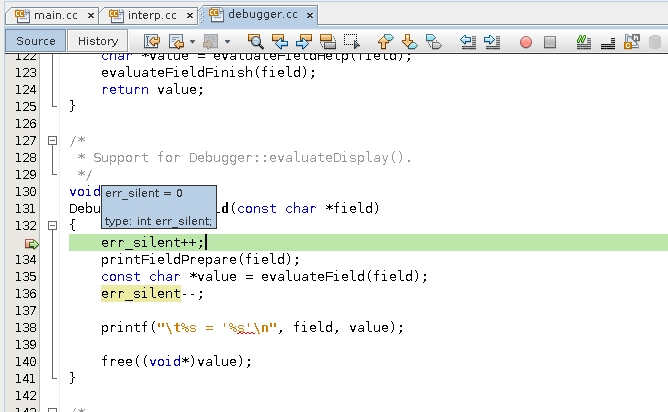
The unwanted error message is issued because err_silent is not > 0. Take a look at the value of err_silent with balloon evaluation.
-
Put your cursor over err_silent in line 31 and wait for its value to be displayed.
Follow the stack to see where err_silent was set.
-
Click Make Caller Current
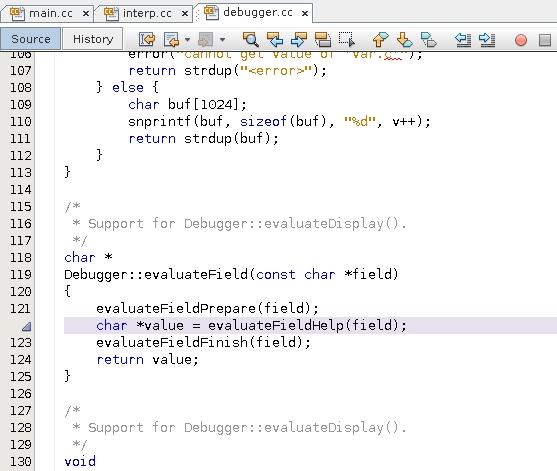
 twice to evaluateField(),
which has already called
evaluateFieldPrepare() simulating a
complex function that might be manipulating
err_silent.
-
Click Make Caller Current again to get to printField(), where err_silent is being incremented. printField() has also already called printFieldPrepare(), also simulating a complex function that might be manipulating err_silent.
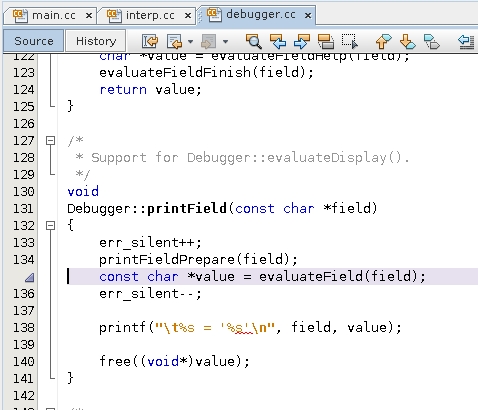
Notice how err_silent++ and err_silent-- bracket some code.
err_silent could go wrong in either printFieldPrepare() or evaluateFieldPrepare(), or it might already be wrong when control gets to printField().
Step 6: More Breakpoint Counts
-
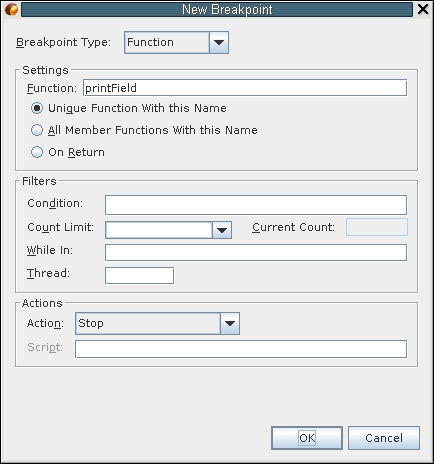
Select printField(), right-click, and choose New Breakpoint.
The New breakpoint type is pre-selected and the Function field is pre-populated with printfield.
-
Click OK.
-
Click Restart
 .
. The first time you hit the breakpoint is during the first run, on the first stop, and on the first field, var.a. err_silent is 0, which is OK.
-
Click Continue.
err_silent is still OK.
-
Click Continue again.
err_silent is still OK.
To find out whether err_silent was wrong before or after the call to printField(), put a breakpoint in printField().
Reaching the particular call to printField() that resulted in the unwanted error message might take a while. You need to use a breakpoint count on the printField breakpoint. But what shall the count be set to? In this simple example, you could attempt to count the runs and the stops and the fields being displayed, but in practice the process might be more difficult. There is a way to determine the count semi-automatically.
Step 7: Determining the Count Value
-
Open the Customize Breakpoint dialog box for the breakpoint on printField() and set the Count Limit field to infinity.
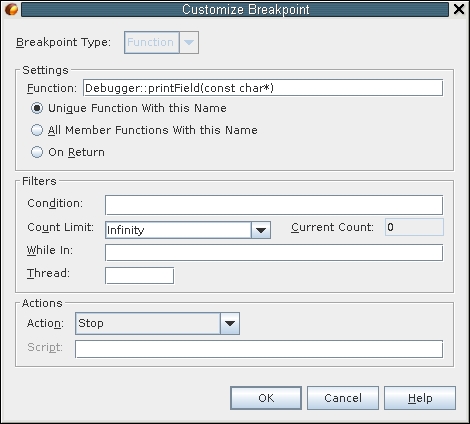
This setting means that you will never stop at this breakpoint. However, it will still be counting.
-
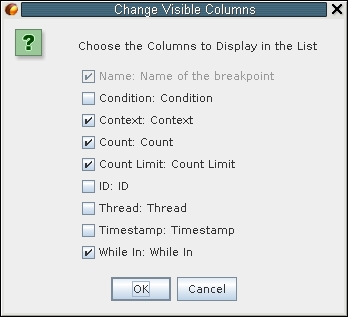
Set the Breakpoints window to show more properties, such as counts.
-
Click the Change Visible Columns button
 at the top right corner of the
Breakpoints window.
 -
Select Count Limit, Count, and While In.
-
Click OK.
-
-
Run the program again. You will hit the breakpoint inside error(); the one bounded by runProgram().
-
Look at the count for the breakpoint on printField().

The count is 15.
-
In the Customize Breakpoint window again, click the drop-down list in the Count Limit column and select Use current Count value to transfer the current count to the count limit, and click OK.
Now when you run the program, you will stop in printField() the last time it is called before the unwanted error message.
Step 8: Narrowing Down the Cause
Use balloon evaluation to inspect err_silent again. Now it is -1. The most likely cause is one err_silent-- too many, or one err_silent++ too few, being executed before you got to printField().
You can locate this mismatched pair of err_silents in a small program like this example by careful code inspection. However, a large program might contain numerous pairings of the following:
err_silent++;
err_silent--;
A quicker way to locate the mismatched pair is by using watchpoints.
The cause of the error might not be a mismatched set of err_silent++; and err_silent--; at all, but a rogue pointer overwriting the contents of err_silent. Watchpoints would be more effective in catching such a problem.
Step 9: Using Watchpoints
-
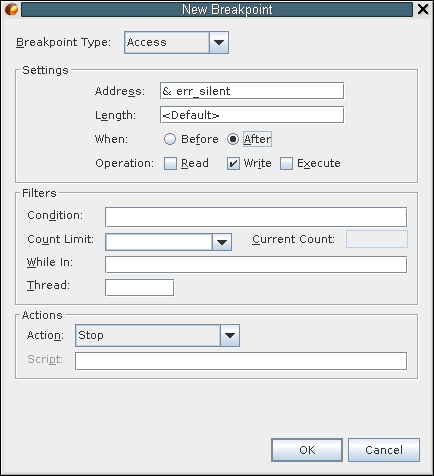
Select the err_silent variable, right-click, and choose New Breakpoint.
-
Set Breakpoint Type to Access.
Note how the Settings section changes and how the Address field is & err_silent.
-
Select After in the When field.
-
Select Write in the Operation field.
-
Click OK.
-
Run the program.
You stop in init(). err_silent was incremented to 1 and execution stopped after that.
-
Click Continue.
You stop in init() again.
-
Click Continue again.
You stop in init() again.
-
Click Continue again.
You stop in init() again.
-
Click Continue again.
Now you stop in stopIn(). Things look OK here too, with no -1s.
To create a watchpoint on err_silent:
Instead of clicking Continue over and over until err_silent is set to -1, you can set a breakpoint condition.
Step 10: Breakpoint Conditions
-
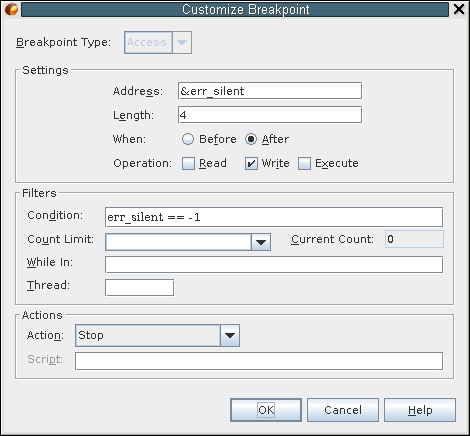
In the Breakpoints window, right-click the After Write breakpoint and choose Customize.
-
Verify that After is selected in the When field.
Selecting After enables you to see what the value of err_silent was changed to.
-
Set the Condition field to err_silent == -1.
-
Click OK.
-
Run the program again.
You stop in checkThings(), which is the first time err_silent is set to -1. As you look for the matching err_silent++ you see what looks like a bug: err_silent is incremented only in the else portion of the function.
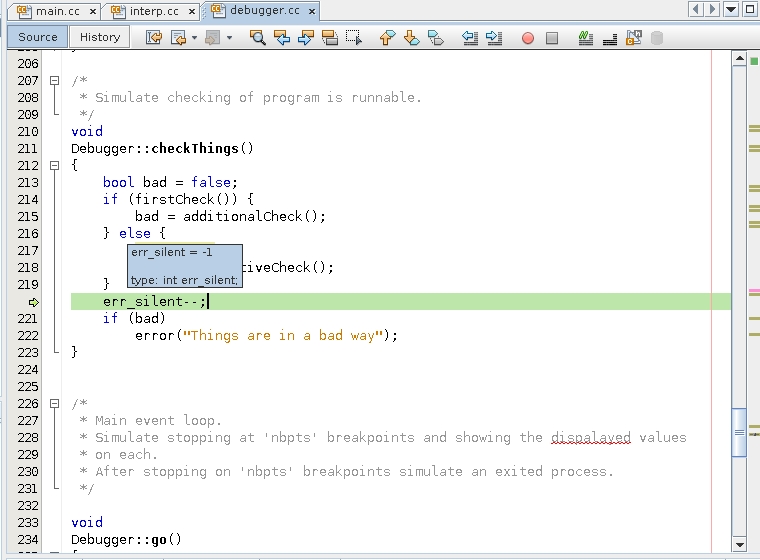
Could this be the bug you've been looking for?
To add a condition to your watchpoint:
Step 11: Verifying the Diagnosis by Popping the Stack
One way to double-check that you indeed went through the else block of the function would be to set a breakpoint on checkThings() and run the program. But checkThings() might be called many times. You can use breakpoint counts or bounded breakpoints to get to the right invocation of checkThings(), but a quicker way to replay what was recently executed is to pop the stack.
-
Choose Debug → Stack → Pop Topmost Call.
Notice the Pop Topmost Call does not undo everything. In particular, the value of err_silent is already wrong because you are switching from data debugging to control flow debugging.
The process state reverts to the beginning of the line containing the call to checkThings().
-
Click Step Into
 . and observe as
checkThings() is called again.
 As you step through checkThings(), you can verify that the process executes the if block where err_silent is not incremented and then is decremented to -1.
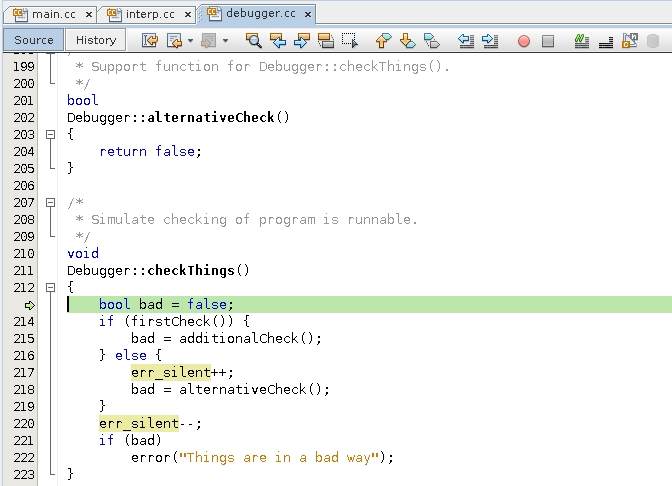
Although you appear to have found the programming error, you might want to triple check it.
Step 12: Using Fix to Further Verify The Diagnosis
Fix the code in place and verify that the bug has indeed gone away.
-
Fix the code by putting the err_silent++ above the if statement.
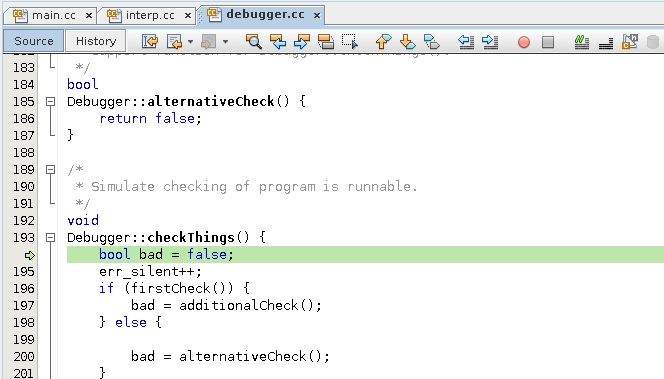
-
Choose Debug > Apply Code Changes or press the Apply Code Changes button
 .
. -
Disable the printField breakpoint and the watchpoint but leave the breakpoint in error() enabled.

-
Run the program again.
Note that the program completes without hitting the breakpoint in error() and its output is as expected.
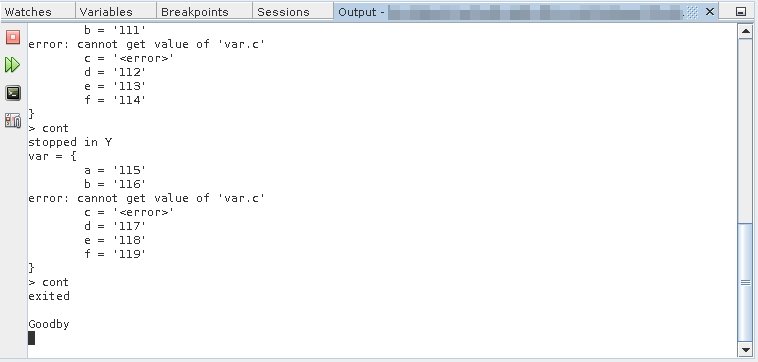
Discussion
This example illustrates the same pattern as discussed at the end of Using Breakpoints and Stepping, that is, you stop the misbehaving program at some point before things have gone wrong and then steps through the code comparing the intent of the code with the way the code actually behaves. The main difference is that finding the point before things have gone wrong is a bit more involved.