Diagnosing a Core Dump
To find bugs, run the example program again, and press Return without entering a command.
$ a.out
> display var
will display 'var'
>
Segmentation Fault (core dumped)
$
Start dbxtool with the executable and the core file.
$ dbxtool a.out core
Notice that the dbxtool command accepts the same arguments as the dbx command.
dbxtool displays output like the following example.
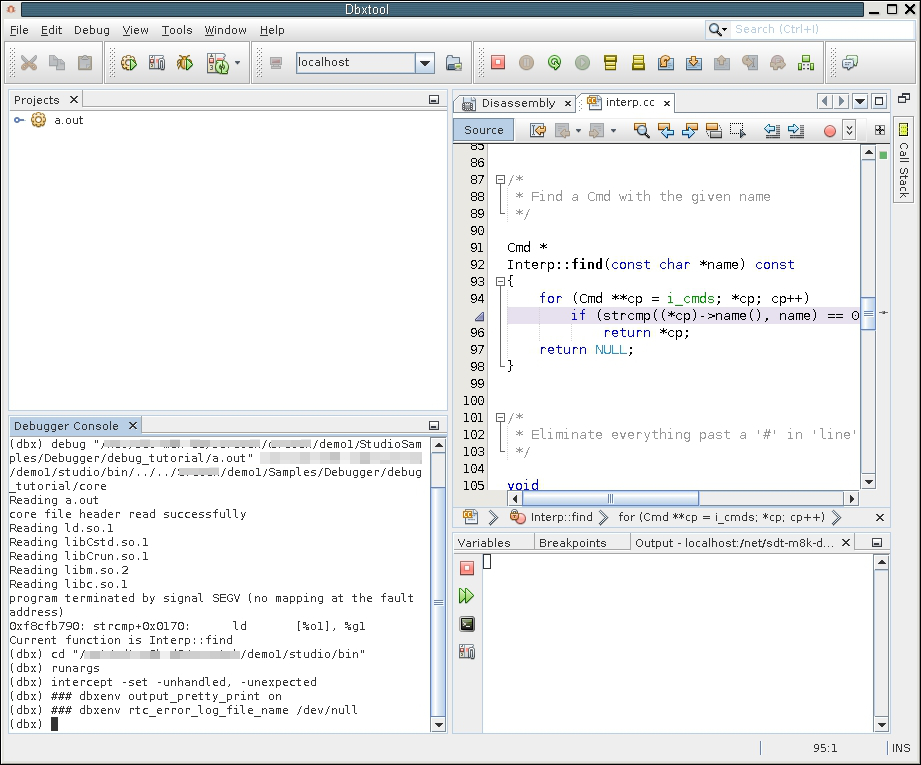
-
In the Debugger Console window, you see a message like the following example:
program terminated by signal SEGV (no mapping at fault address)
0xf8cfb790: strcmp+0x0170:      ld       [%ol], %gl
Current function is Interp::find
-
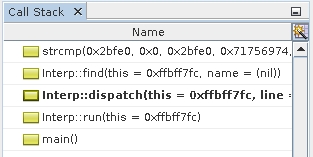
Even though the SEGV happened in the strcmp() function, dbx automatically shows the first frame with a function that has debugging information. See how the stack trace in the Call Stack window has a border around the icon for the current frame.
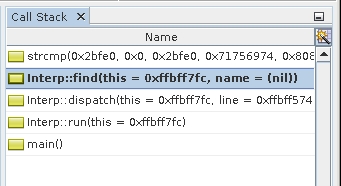
Note that the Call Stack window shows the parameter names and values. In this example, the second parameter passed to strcmp() is 0x0 and that the value of name is NULL.
-
In the Editor window, the lavender stripe and a triangle on line 95 instead of a green stripe and arrow signify the location of the call to strcmp() rather than the actual location of the error.
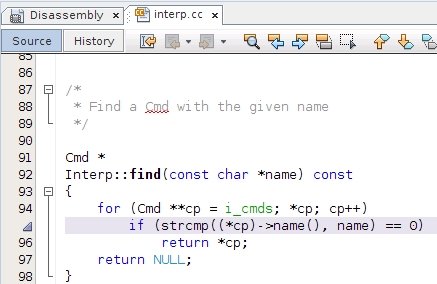
If you do not see parameter values, check that the dbxenv variable stack_verbose is set to on in your .dbxrc file. You can also set verbose mode in the Call Stack window by right-clicking in the window and selecting the Verbose option. For more information about dbxenv variables and your .dbxrc, see Chapter 3, Customizing dbx in Oracle Developer Studio 12.6: Debugging a Program with dbx.
Note the following:
Functions usually fail when they are passed bad values as parameters. To check the values passed to strcmp():
-
The Variables window displays all local variables automatically. Check the values of the parameters in the Variables window.
-
Click the Variables tab.
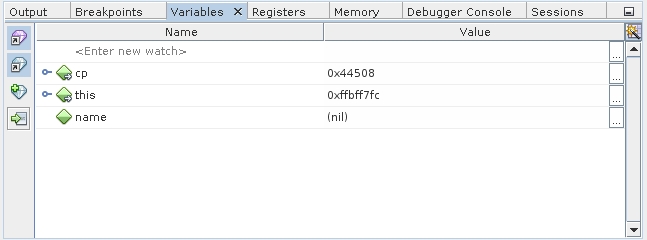
Note that the value of name is NULL. That value is quite likely to be the cause of the SEGV, but check the value of the other parameter, (*cp)->name().
-
In the Variables window, expand the cp node and then expand the (cp*) node. The name in question is “quit”, which is valid.
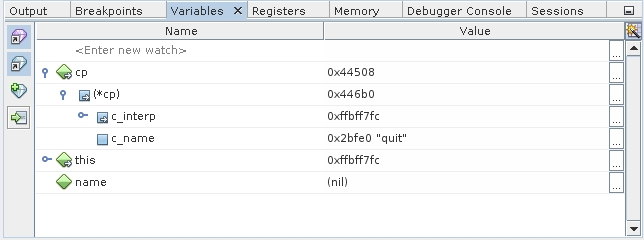
If expanding the *cp node does not show additional variables, check that the dbx environment variable output_inherited_members in your .dbxrc file is set to on. You can also turn on the display of inherited members by right-clicking in the window and selecting the Inherited Members check box to add a check mark.
-
-
Use Balloon Evaluation to confirm the value of a parameter. Click into the Editor window, then hover the cursor over the name variable being passed to strcmp(). A tip is displayed showing the value of name as NULL.
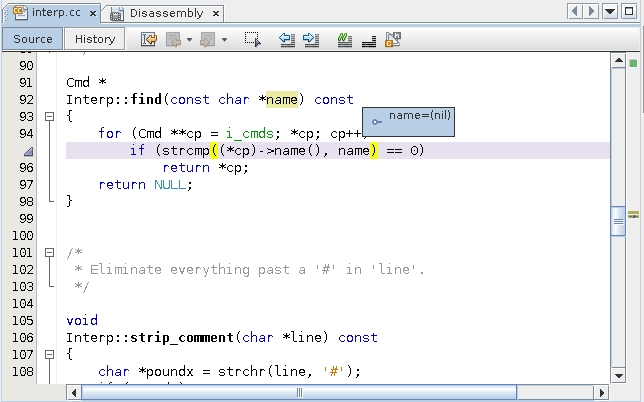
Using balloon evaluation, you can also place the cursor over an expression like (*cp)->name(). However, balloon evaluation of expressions with function calls is disabled because:
-
You are debugging a core file.
-
Function calls might have side effects that could occur as a result of casual hovering in the Editor window.
-
Because the value of name should not be NULL, you need to discover which code passed this bad value to Interp::find(). To find out:
-
Move up the call stack by choosing Debug → Stack → Make Caller Current or click the Make Caller Current button (Alt - Page Down)
 on the toolbar.
-
In the Call Stack window, double-click the frame corresponding to Interp::dispatch().
The Editor window now highlights the corresponding code:
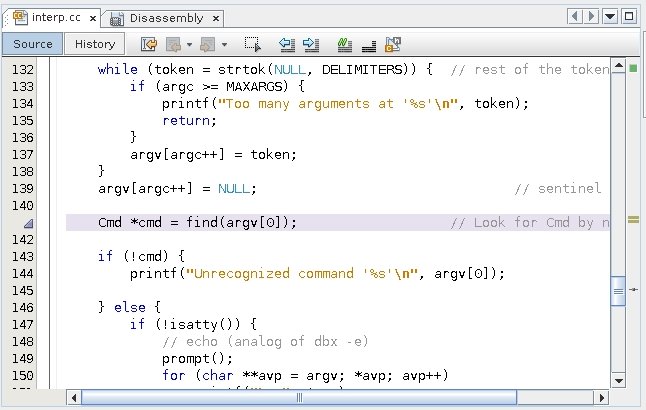
This code is unfamiliar and does not provide any clues other than that the value of argv[0] is NULL.
Debugging this problem might be easier by dynamically using breakpoints and stepping.