Using Breakpoints and Stepping
Breakpoints enable you to stop a program before the manifestation of a bug and step through the code in the hope of discovering what went wrong.
If you have not already done so, undock the Output window.
You ran the program from the command line earlier. Reproduce the bug by running the program in dbxtool.
-
Click the Restart button
 on the toolbar or type run in
the Debugger Console window.
 -
Press Return in the Debugger Console window.
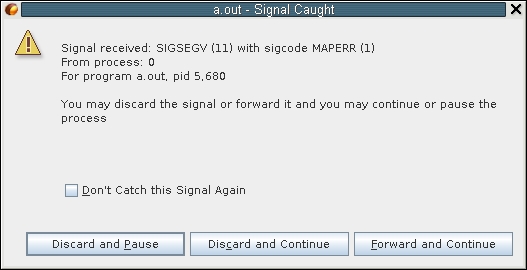
An alert box provides information about the SEGV.
-
In the alert box, click Discard and Pause.
The Editor window once again highlights the call to strcmp() in Interp::find().
-
Click the Make Caller Current button
 in the toolbar to go to the unfamiliar code you
saw earlier in Interp::dispatch().
 -
In the next section, you will set a breakpoint a bit before the call to find() so you can step through the code to learn why things went wrong.
Setting Breakpoints
You can set a breakpoint in several ways, such as a line breakpoint or a function breakpoint. The following list explains the several ways to create a breakpoint.
Note - If the line numbers are not showing, enable line numbers in the editor by right-clicking in the left margin and selecting the Show Line Numbers option.
-
Setting a Line Breakpoint
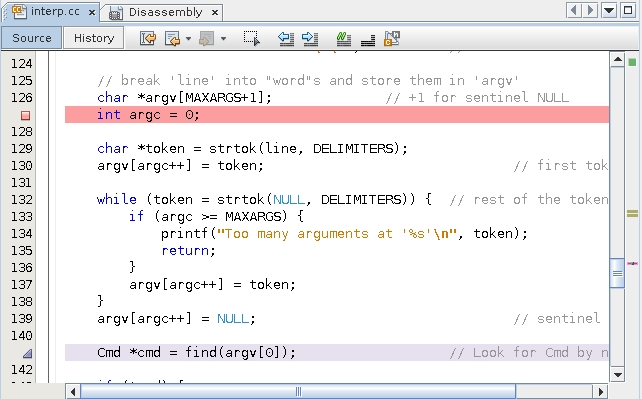
Toggle a line breakpoint by clicking in the left margin next to line 127.
-
Setting a Function breakpoint
Set a function breakpoint.
-
Select Interp::dispatch in the Editor window.
-
Choose Debug → New Breakpoint or right-click and choose New Breakpoint.
The New Breakpoint dialog box appears.
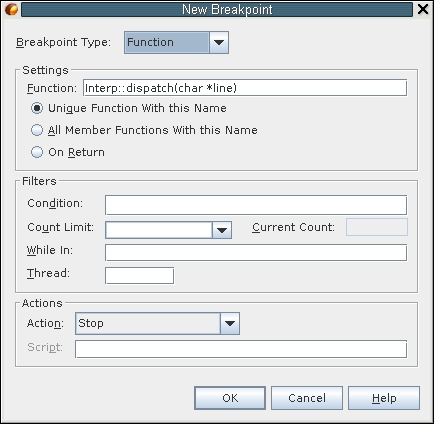
Notice that the Function field is seeded with the selected function name.
-
Click OK.
-
-
Setting a Breakpoint from the Command Line
The easiest method to set a function breakpoint is from the dbx command line. Type the stop in command in the Debugger Console window:
(dbx) stop in dispatch
(4) stop in Interp::dispatch(char*)
(dbx)
Notice that you did not have to type Interp::dispatch. Just the function name sufficed.
Your breakpoints window and Editor probably look like the following:
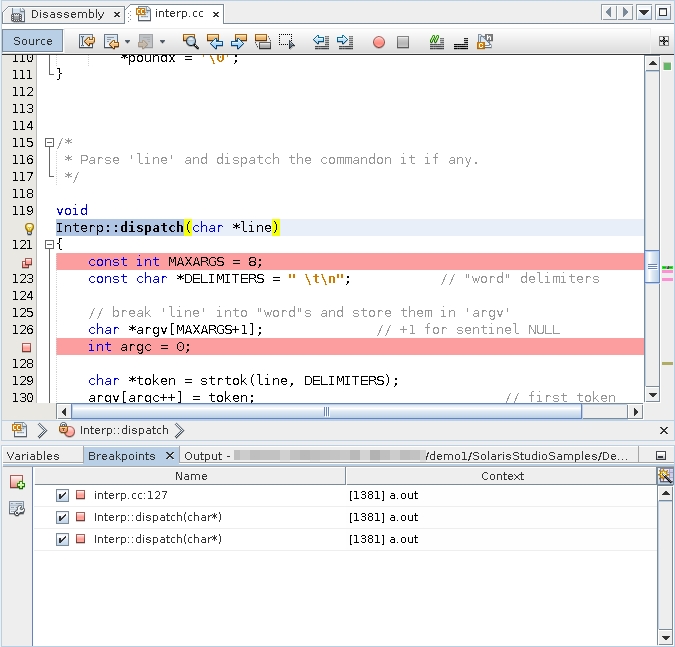
To avoid clutter in the Editor, use the Breakpoints window.
-
Click the Breakpoints tab (or maximize it if you minimized it earlier).
-
Select the line breakpoint and one of the function breakpoints, right-click, and choose Delete.
For more information about breakpoints, see Chapter 6, Setting Breakpoints and Traces in Oracle Developer Studio 12.6: Debugging a Program with dbx.
Advantages of Function Breakpoints
Setting a line breakpoint by toggling in the editor might be intuitive. However, many dbx users prefer function breakpoints for the following reasons:
-
Typing si dispatch in the Debugger Console window means you do not have to open a file in the editor and scroll to a line just to place a breakpoint.
-
Because you can create function breakpoints by selecting any text in the editor, you can set a breakpoint on a function from its call site instead of opening a file.
Tip - si is an alias for stop in. Most dbx users define many aliases and put them in the dbx configuration file ~/.dbxrc. Some common examples are:alias si stop in alias sa stop at alias s step alias n next alias r run
For more information about customizing your .dbxrc file and dbxenv variables, see Setting dbxenv Variables in Oracle Developer Studio 12.6: Debugging a Program with dbx.
-
The name of a function breakpoint is descriptive in the Breakpoints window. The name of a line breakpoint is not descriptive, although you can find what is at line 127 by right-clicking the line breakpoint in the Breakpoints window and choosing Go To Source, or by double-clicking the breakpoint.
-
Function breakpoints persist better. Because dbxtool persists breakpoints, line breakpoints might easily become skewed if you edit code or do a source code control merge. Function names are less sensitive to edits.
Using Watches and Stepping
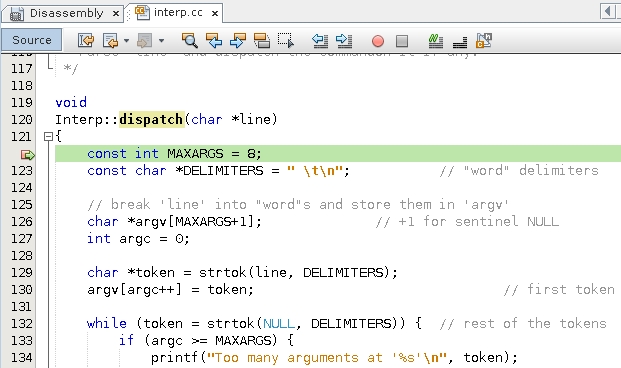
Now that you have a single breakpoint at
Interp::dispatch(), if you click Restart  again and press Return in the Debugger Console window,
the program stops at the first line of the
dispatch()function that contains executable code.
-
Select an instance of argv in the Editor window.
-
Right-click and choose New Watch. The New Watch dialog box appears seeded with the selected text:

-
Click OK.
-
To open the Watches window, choose Window → Watches (Alt + Shift 2).
-
In the Watches window, expand argv.
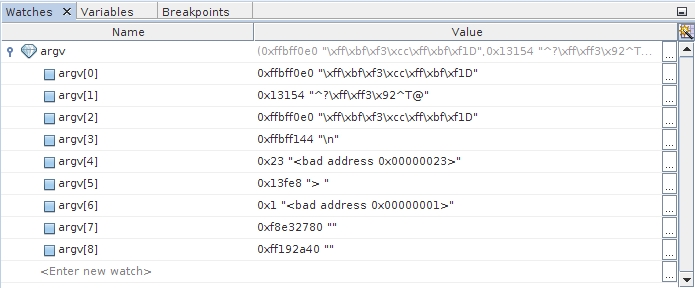
Note that argv is uninitialized and because it is a local variable, argv might “inherit” random values left on the stack from previous calls. Could this be the cause of problems?
Note - Watch variables can be viewed in the Variables window as well as the Watches window. -
Click Step Over (F8)
 twice until the green PC arrow points to
int argc = 0;.
 -
Because argc is going to be an index into argv, create a watch for argc also. Note that argc is also currently uninitialized and might contain unwanted values.
Because you created the watch for argc after the watch for argv, it appears second in the Watches window.
-
To alphabetize the watch names, click the Name column header to sort the column. Note the sort triangle in the following illustration.:

-
Click Step Over (F8)
 .
. argc now shows its initialized value of 0 and is displayed in bold to signify that the value just changed.
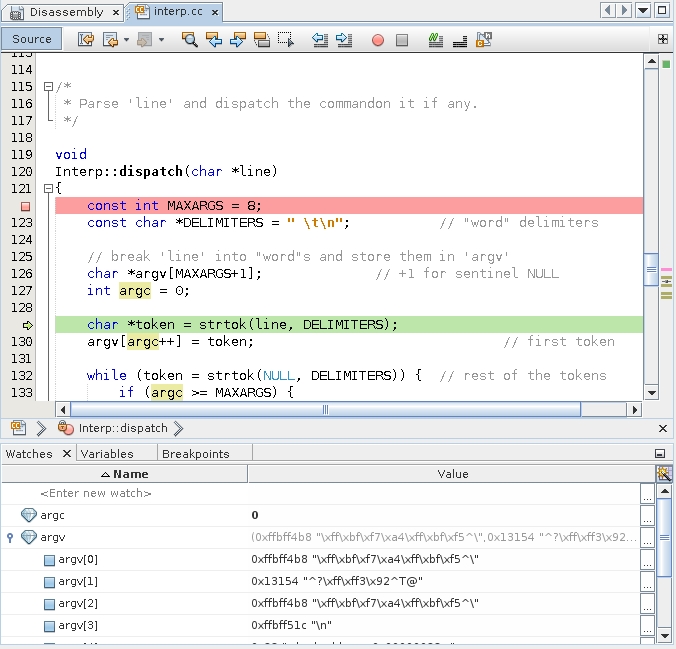
The application is going to call strtok().
-
Click Step Over to step over the function, and observe, for example, by using balloon evaluation, that token is NULL.
The strtok() function helps divide a string, for example, into tokens delimited by one of the DELIMITERS. For more information, see the strtok(3) man page.
-
Click Step Over again to assign the token to argv. Then there is a call to strtok() in a loop.
As you step over, you do not enter the loop (there are no more tokens) and instead a NULL is assigned.
-
Step over that assignment too, to reach the threshold of the call to find where the sample program crashed.
-
To double check that the program crashes at this point, step over the call to find().
The Signal Caught alert box is displayed again.

-
Click Discard and Pause as before.
The first call to find() after stopping in Interp::dispatch() is indeed where things go wrong.
You can quickly get back to where you originally called find().
-
Click Make Caller Current
 .
. -
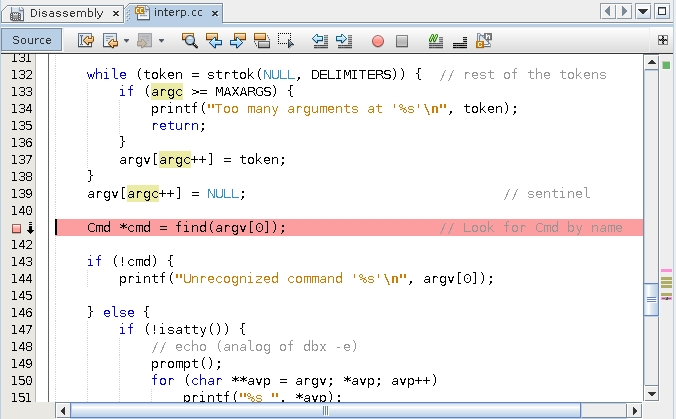
Toggle a line breakpoint at the call site of find().
-
Open the Breakpoints window and disable the Interp::dispatch() function breakpoint.
dbxtool should look like the following illustration:
-
The downward arrow indicates that two breakpoints are set on line 141 and that one of them is disabled.
-
-
Click Restart
 and press Return in the Debugger Console
window.
and press Return in the Debugger Console
window.The program returns in front of the call to find(). Note that the Restart button evokes restarting. When debugging, you restart much more often than initially starting.)
Tip - If you rebuild your program, for example after discovering and fixing bugs, you need not exit dbxtool and restart it. When you click the Restart button, dbx detects that the program (or any of its constituents) has been recompiled, and reloads it. Therefore, consider keeping dbxtool on your desktop, perhaps minimized, and ready to use on your debugging problems. -
Where is the bug? Look at the watches again:
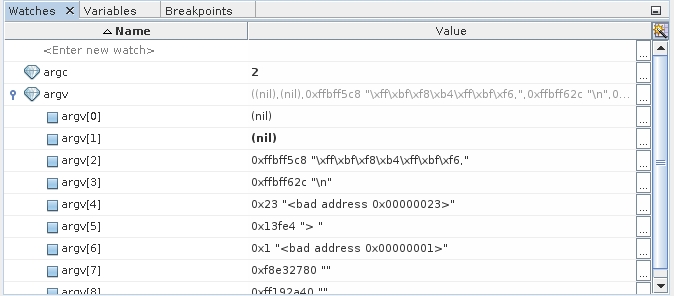
Note that argv[0] is NULL because the first call to strtok() returns NULL because the line was empty and had no tokens.
Fix this bug before proceeding with the remainder of this tutorial, if you like.
If you will be running the program under the debugger, you can patch the code in the debugger, as described in Using Breakpoint Scripts to Patch Your Code.
Because you have identified the problem of the argv[0] being passed to find() use a watch on argv:
The developer of the example code should probably have tested for this condition and bypassed the rest of Interp::dispatch().
Discussion
The example illustrates the most common debugging pattern, where you stop the misbehaving program at some point before things have gone wrong and then step through the code comparing the intent of the code with the way the code actually behaves.
The next section describes some advanced techniques for using breakpoints to avoid some of the stepping and watches that you used in this example.