Custom Analytics
Custom Analytics is a new way to see only the metrics that matter most to you. You can create as many customized analytics pages using our new simple drag-and-drop interface. You can use all the same metrics that are available in Analytics, but now you can pick and choose to create exactly the report that’s most useful to you.
You can work with Custom Analytics if you are an Oracle Social Marketing customer.
Getting Started
You’ll find Custom Analytics on the Dashboards tab of Social Station.
In this article:
- Export - Lets you export the entire report as an image (PNG file), PDF, or Excel file.
- Enable/Disable Annotations - Lets you add annotations to the modules on your report. Disable hides any annotations you have added.
Note: Annotations you add to a module will be saved in Disable mode, they just will be hidden on the page. When you click Enable, the annotations will display again. (For example, if you want to use your report in a presentation, but don’t want your notes displayed.) - Duplicate Workspace - Lets you create a duplicate of the current workspace that is identical, but not linked. This is useful when you want the same report with some minor modifications without having to recreate it from scratch.
- Enable/Disable Annotations - Enable: Lets you add annotations to the modules on your report. Disable hides any annotations you have added.
Note: Annotations you add to a module will be saved in Disable mode, they just will be hidden on the page. When you click Enable, the annotations will display again. (For example, if you want to use your report in a presentation, but don’t want your notes displayed.) - Delete - Deletes the report.
- Sharing - Lets the other users on your bundle have access your report. The use who created the report will be the owner. If a user who isn’t the owner unshares the report, they are only removing their own access from the report.
- Save - Saves your report and takes you out of Edit mode.
- Single Metric - Displays a single metric for one or more streams
- Multi Metric - Displays several related metrics charted together to build context for one or more streams
- Note - Displays a text box, where you can add notes about the report as a whole or a specific module
- Message Monitor - Displays the message activity from an Engage channel and/or label
- Key Performance Indicator - Displays the performance for a specific metric for one or more streams
- Key Performance Indicator for Engage - Displays the performance of a specific Engage metric for one or more streams or users” and link to the appropriate section
- Single Metric for Engage - Displays a single Engage metric for one or more streams or users” and link to the new section described below
- Choose Your Network - Choose a social network you want to see metrics for (one only): Facebook, Google+, Twitter, YouTube, LinkedIn, Instagram, or Tumblr.
- Select Your Streams - Choose the stream or streams you want to see metrics for. Click on the box and a list of your social networks will appear for you to choose from. Click on a stream to add it. You can also search for a specific stream by typing the name into the box.
- Choose a Metric - Choose the metric you want to view. This list will change depending on which social network you choose.
- Select a Graph Type - Choose how you want your data to display. Your graph options will change depending on the metric you choose.
- Select a Module Size - Choose whether you want your module to display as half-width or full-width size.
- Date Range - Choose the time frame you want to display data for. You can choose from the current month, the previous month, or from a range.
- Choose Your Network - Choose a social network you want to see metrics for (one only): Facebook, Google+, Twitter, LinkedIn, Instagram, or Tumblr.
- Select Your Streams - Choose the stream or streams you want to see metrics for. Click on the box and a list of your social networks will appear for you to choose from. Click on a stream to add it. You can also search for a specific stream by typing the name into the box.
- Choose a Metric - Choose the metric group you want to view. This list will change depending on which social network you choose.
- Select a Module Size - Choose whether you want your module to display as half-width or full-width size.
- Date Range - Choose the time frame you want to display data for. You can choose from the current month, the previous month, or from a range.
- Choose Your Network - Choose a social network you want to see metrics for (one only): Facebook, Google+, Twitter, YouTube, LinkedIn, Instagram, or Tumblr.
- Select Your Streams - Choose the stream or streams you want to see metrics for. Click on the box and a list of your social networks will appear for you to choose from. Click on a stream to add it. You can also search for a specific stream by typing the name into the box.
- Choose a Metric - Choose the metric you want to view. This list will change depending on which social network you choose.
- Choose a Time Period - Choose the time period you want to view. This time period will display with the same time period prior in the module. For example, if you choose Prior Week, when the module is saved you will see the the date range for the prior week, and the week before that.
You can choose from: Prior Week, Current Week to Date, Prior Month, Current Month to Date, Prior Quarter, Current Quarter to Date, Last Seven Days, Last Thirty Days, Custom.
- A few notes on these time ranges:
- Weeks start on Sunday.
- A day is a 24 hour period, not a whole day. (This figures in to the Last Seven Days and Last Thirty Days ranges.)
- Quarters are Jan 1 - March 31, April 1 - June 30, July 1 - Sept 30, and Oct 1 - Dec 31.
- Metrics that are total values over time, for example: Total Fans. These metrics use the value from the last day in the date range.
- Metrics that are totals for a day, for example: Impressions on a post. These metrics sum up the daily values over the date range.
- Metrics that are daily magnitude values, for example: Reach of a post. These metrics are averaged over the date range.
- Facebook
- Fans
- Fans Added
- Fans Added Unique
- Fans Removed
- Fans Removed Unique
- Twitter
- Followers
- Google+
- Followers
- Circle Followers
- Total +1s
- Total Replies
- Total Reshares
- LinkedIn
- Total Followers
- Total Organic Followers
- Total Paid Followers
- Instagram
- Total Followers
Creating a Report · Action Bar
Adding Modules
· Single Metric
· Multi Metric
· Note
· Message Monitor
· Key Performance Indicator
· Key Performance Indicator for Engage
· Single Metric for Engage
Saving Your Module · Module Icons
Metric Options and Definitions
Note: The Quick Post functionality is sunset. For information about publishing, refer to Creating a Post.
Click a link above to get directly to that section, or scroll down and start reading.
Creating a Report
The first time you enter Custom Analytics, you’ll be taken to a blank report. If you have already created a report, you’ll be taken to the Custom Analytics home page, where you’ll see all the reports you have created.
To create a new report, click Add New on the Custom Analytics home page.
The report will open in Edit mode.
Action Bar
At the top of the page, you’ll see an action bar. Here, you can give your report a name (we suggest something that will remind you of what type of report you have created), give your report a description (to help you remember what this report is all about), and use the icons on the right to perform different actions on your report.
The action bar shows different icons if you are editing a report than when you are just viewing it. You'll see the following actions when you are viewing a report:
When you are in edit mode for a report, you'll see the following actions in the bar:
Adding Modules
The main part of your report is adding modules. Modules display analytics data for various metrics on your report. There are several options available on the modules, so let’s go through them.
To start, click Add New Module.
SELECT A TYPE OF MODULE
You have five options for your module:
Each module type has several options to choose from.
Note: If you are an Unmetric customer, you can display Unmetrics data in Custom Analytics. See our Unmetric help article for more information on this integration.
Single Metric
A single metric module has the following options:
Multi Metric
A multi metric module displays a pre-created group of related metrics, so you won’t see the same options as the single metric modules. Here are the options you'll see:
Note
The Notes module opens a text field where you can create a note. You have a basic text editing bar to help format your note. You can also select a size for your note module.
Message Monitor
The Message Monitor module displays a list of messages from Engage for a specific stream. You can narrow what you see by choosing to only display messages tagged with certain labels.
To get started, choose the stream you want to see messages for using the drop down menu, then choose any labels you want to apply. Click Done to create a list of messages.
Note: If you don't choose any labels, all the messages for that stream will be displayed.
In the list of messages, you'll see the total number of messages that have come in for that stream/label, a short preview of the message, and the time stamp for when it came in.
You can expand the Message Monitor module to full screen by clicking on the message total at the top of the module.
If you click on a specific message, the message will expand to show you the entire thing, including any included media.
Note: You cannot perform actions on these messages in the Message Monitor module. But from the extended view, you can click Go To Engage button or View in Engage from an expanded message to be taken to Engage so you can perform actions.
Key Performance Indicator
The Key Performance Indicator module (or KPI) displays the percent change and quantity change for a particular metric for a chosen time period date range from a prior time period date range.
The KPI module has the following options:
Saved Key Performance Indicator Module
Once you save your module, here's what you'll see:
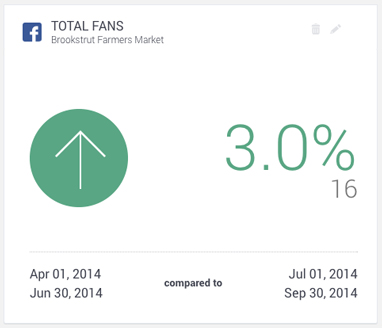
The arrow will point up or down depending on the type of change in the metric. You'll then see the percentage of change, and the total number of the change next to the arrow.
Below the images, you'll see the exact dates of the ranges you have chosen.
Some info on how KPIs are calculated
Our system calculates KPIs as the current time period minus the previous time period, then divided by the previous time period.
Now, what those values are depends on the metric you have selected. There are three types of metrics:
Metrics that use the last day in date range
Metrics that sum over the date range
- Facebook
- Impressions
- Paid Impressions
- Organic Impressions
- Viral Impressions
- Page Stories
- Engaged Users
- Consumptions
- Virality
- Post Count
- Post Likes
- Post Comments
- Post Shares
- Total Actions
- Twitter
- SRM Clicks
- Retweets
- Mentions
- Replies
- Favorites
- Engagement
- Unfollows
- New Followers
- Google+
- +1s
- Replies
- Reshares
- Youtube
- Views
- Unique Views
- Comments
- Likes
- Dislikes
- Shares
- Favorites Added
- Favorites Removed
- Subscribers Gained
- Subscribers Lost
- Estimated Minutes Watched
- LinkedIn
- Followers
- Organic Followers
- Paid Followers
- Likes
- Shares
- Comments
- LinkedIn Clicks
- Impressions
- SRM Clicks
- Instagram
- Post Comments
- Post Likes
- Post Count
Metrics that average over the date range
- Facebook
- Reach
- Paid Reach
- Organic Reach
- Viral Reach
- People Talking About This
- Youtube
- Average View Duration
- Average View Percentage
- Annotation Click Through Rate
- Annotation Close Rate
- LinkedIn
- Engagement
Key Performance Indicator for Engage
The Engage KPI (key performance indicator) module displays the percent change and quantity change for a particular metric for a chosen time period date range from a prior time period date range. This is similar to the KPI module, but these metrics are specifically for actions in Engage.
The Engage KPI module has the following options:
- Data Source - Choose whether you want to see metrics for a user or for a stream.
- Select Your User/Stream - Choose the stream or user you want to see metrics for, depending on your data source. Click on the box and a list of your social networks or users will appear for you to choose from. Click on a stream or user to add it. You can also search for a specific stream or user by typing the name into the box.
- Choose a Metric - Choose the metric you want to view. This list will change depending on which data source you choose.
- Choose a Time Period - Choose the time period you want to view. This time period will display with the same time period prior in the module. For example, if you choose Prior Week, when the module is saved you will see the the date range for the prior week, and the week before that.
You can choose from: Prior Week, Current Week to Date, Prior Month, Current Month to Date, Prior Quarter, Current Quarter to Date, Last Seven Days, Last Thirty Days, Custom.
- A few notes on these time ranges:
- Weeks start on Sunday.
- A day is a 24 hour period, not a whole day. (This figures in to the Last Seven Days and Last Thirty Days ranges.)
- Quarters are Jan 1 - March 31, April 1 - June 30, July 1 - Sept 30, and Oct 1 - Dec 31.
Notes on Engage KPIs
- The data in Engage KPIs will not match the data in the SEM Report. This is because the SEM reports and Engage KPIs collect data differently. For the SEM Reports, the time period selection is based off of the date of the post on the social network. For the Engage KPIs, the data is gathered in hourly rollups, so the time is based on when the specific event occurred.
- Some numbers can be negative, due to actions being taken on messages from previous hourly periods. For example, 3 new messages received, 5 replies, means -2 non-responded to messages.
- Data cannot be backfilled, since it is gathered at the time the events occur.
- The most recent data point available is always the one from 2 hours before. For example, at 4:05pm, the data from 2:00-2:59pm is the most recent available.
- Data is gathered hourly, which allows us to align your date selections to your timezone. This means that two users with different timezone settings in W&A will see differences in the KPIs, because the 24 hour time period used for their days will be different.
- All metrics definitions are listed in the Complete Metrics for Custom Analytics help article.
Single Metric for Engage
The Single Metric for Engage module shows your Engage metrics as line charts over time. Each data point represents the activity of that metric for a specific hour. A single metric module for Engage has the following options:
- Data Source - Choose whether you want to see metrics for a user or for a stream.
- Select Your User/Stream - Choose the stream or user you want to see metrics for, depending on your data source. Click on the box and a list of your social networks or users will appear for you to choose from. Click on a stream or user to add it. You can also search for a specific stream or user by typing the name into the box.
- Choose a Metric - Choose the metric you want to view. This list will change depending on which data source you choose.
- Select a Graph Type - Choose how you want your data to display. Your graph options will change depending on the metric you choose.
- Select a Module Size - Choose whether you want your module to display as half-width or full-width size.
- Date Range - Choose the time frame you want to display data for. You can choose from the current month, the previous month, or from a range.
Saving your Module
Once you have set all the options for your module, click Done and your module will begin pulling in and displaying the data for the metric options you have chosen. You can then add more modules or save your report and close it.
Module Icons
When you save your module, you’ll see several icons at the top of the module.
- Delete - Deletes the module from your report
- Edit - Opens the module in edit mode, allowing you to make changes
- Export - Lets you export the module chart as either an image, XLS, or a PDF
Metric Options and Definitions
Custom Analytics has access to metrics from Facebook, Twitter, Youtube, Google+, LinkedIn, Instagram, Tumblr, and Engage. A full list with definitions can be found in the Complete Metrics Definitions for Custom Analytics topic.
Drag and Drop
Once you have created some modules, you might need to move them around. If you want a module in a different place on your report, grab the top of the module and when your cursor turns into the drag & drop icon, you can move it to a different position. The other modules will rearrange around it automatically.
Custom Analytics Home Page
Once you have finished creating your report, click the arrow next to your report title to return to the Custom Analytics home page. There you can see all the reports you have created and create a new report.