5 Working with Explorations
This chapter explains about explorations in Oracle Stream Analytics.
This chapter contains the following sections:
5.1 Understanding Explorations
Explorations are Oracle Stream Analytics Event Processing applications that allow you to apply business logic to the event flows. Explorations are the visual representation of the data streamed from a source. The data in the exploration is represented visually in the form of:
-
Live Output Stream - Live Output Stream shows the streaming data shapes in a tabular form.
-
Line Charts - Line charts are the primary way of visualizing time-series data. The X-axis is used to represent the time movement and allows natural scrolling of the data as time moves forward. The Y-axis is used to see the change of the dependent variable, that is, variable of interest, as time moves.
-
Scatter Charts - When the time dimension is not important, then data may be better understood by looking at a scatter plot. In this case, the user can assign distinct event properties to both the X-axis and Y-axis. However, values on both axes need to be numeric variables. Remember that the X-axis represents the explanatory variable and the Y-axis the response variable. Hence, the properties that indicate response or calculated field are better candidates to automatically assign to the Y-axis.
In the case of time-series, it is obvious that new values enter in the right side of the graph and old values exit in the left side. However, this behavior does not translate to scatter plots, as the new point may show up anywhere.
Explorations allow you to:
-
Use one or more streams and references as sources of events and data
-
Correlate multiple event and data sources
-
Filter events and data
-
Group events and data
-
Specify the time/event -based windows for aggregation functions
-
Specify aggregation functions to be used in summaries
-
Review incoming events (before you apply the logic) and resulting events (after you apply the logic) in tabular and graph forms
-
Add targets
-
Define or apply functions to the data in the live output stream
-
Define Oracle Business Rules to the live data in the output stream
5.1.1 Metadata
Every exploration has the following set of metadata:
-
Name
-
Tags
-
Description
-
Created By
-
Created At
-
Updated By
-
Updated At
-
Is Favorite.
Tags, Description, and being Favorite are specified explicitly in the Exploration Editor. Creation and update information is persisted automatically.
5.1.2 Correlations
When an exploration has more than one data source associated with it, a logical relation must be established between the data sources. This logical relation is known as correlation.
Oracle Stream Analytics allows the data sources to be joined using correlation rules. When all the sources are correlated, they provide a single event stream that can be further sent to a Target. Only fields of compatible types from different non-correlated sources may be used as operands in the correlation.
If your streams and references are not correlated, the exploration is in an invalid state and will remain so until you correlate the sources. The exploration will not be updated on the server until you correlate.
5.1.3 Filters
The conditions with which the output can be filtered are known as Filters. When you apply filters to the output, only the events that match ALL or ANY of the filters are displayed. You can filter events by comparing a left operand with a right operand using the following operators:
-
equal to
-
not equal to
-
lower than
-
lower than or equal to
-
greater than
-
greater than or equal to
-
contains
-
not contains
-
is null
-
not null.
Left operand can be any one of the following:
-
a field of any source in the exploration
-
a summary that is defined in the Summaries area.
Right operand can be any one of the following:
-
a constant of a type that is compatible with the type of left operand
-
a field or a summary of a field from a source of the left operand.
Add a Condition
To add a condition:
-
Click the Filter Field and select any field from the data source.
-
Click the Filter Operator and select the appropriate operator.
-
Enter a suitable value in the input field.
-
Select an appropriate datatype if the populated datatype is not correct.
A condition id added to the business rule.
-
Select match All or Match Any based on you requirement to filter.
Add a Group
Groups can be added to add nested queries.The events that match "AND" and "OR" conditions can be displayed:
To add a group:
-
Click the Filter Field and select any field from the data source.
-
Click the Filter Operator and select the appropriate operator.
-
Enter a suitable value in the input field.
-
Select an appropriate datatype if the populated datatype is not correct.
A group id added to the business rule applying the logical operator OR to added the condition..
-
Select match All or Match Any based on you requirement to filter.
5.1.4 Summaries
You can aggregate functions (Summaries) to fields and apply grouping by any combination of fields. The only exception is that a field cannot have both summary and be included in a Group. When you define summaries and/or grouping, all other non-aggregate and non-grouping fields will be automatically excluded from the results shape.
When you define a summary or grouping, the only fields allowed in the output are fields from Summaries and Group By area. When you define a summary, it is automatically shown in the results table and filters area is provided with an option to filter by this newly created Summary. When you remove or change the summary, if it is used in the filters and/or in output, you must confirm this action as it will affect the filter and/or output.
5.1.5 Business Rules
Business rules build conditional logic into the applications.
You can add business rules to an exploration. However, adding business rules is optional.
Remember
Business Rules are not available when you select Spark as the runtime environment.To add a business rule:
-
Navigate to the Exploration Editor.
-
Click Add a Rule to add a business rule to the exploration.
-
Enter a suitable Rule Name. This is a mandatory field.
-
Enter a suitable Description for the business rule. This is an optional field.
-
Click Done.
-
-
Click IF block and select Match All or Match Any.
-
Match All — matches all the conditions in the business rule.
-
Match Any — matches any condition in the business rule.
-
-
Select a field from the Filter Field and select a suitable operator. The possible operators are:
-
equals
-
not equals
-
lower than
-
lower than or equals
-
greater than
-
greater than or equals
-
is null
-
is not null.
-
Enter a numerical value for a numerical filter. You can use the increment or decrement icons to increase or decrease the values. The datatype is automatically determined as
DoubleorIntegerbased on the type of the filter field you select. -
Enter a string for a text based filter. The datatype is automatically determined as
String. -
Select a date and time using the calendar and clock widgets for a timestamp based filter. The datatype is automatically determined as
Timestamp.
-
-
Click Add Action in the THEN block. This action further refines the data of the exploration based on the details you have added in the IF block.
You can also use expressions in this field when required.
A business rule is created with the data you have provided and is applied to the exploration.
Click the Edit Rule icon to edit/modify an existing business rule.
5.1.6 Expression Builder
You can define expressions using the pre-defined functions and operators available in the application using the Expression Builder.
To create expressions:
-
Click the Expression Builder icon.

The Expression Builder Toolbar opens.
Figure 5-6 Expression Builder Toolbar

-
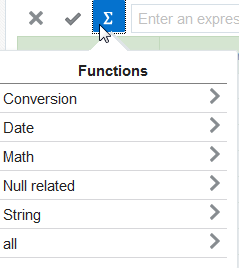
Click List of CQL Functions icon to see a list of functions that you can use in the expressions.
-
Select the required type of functions.
The selected function appears in the function input box.
Figure 5-7 Function Input Box

Start typing in the input parameters for the function within the braces.
-
Click the Apply icon to apply the expression.

-
Click the Cancel icon to abort the operation and quit out of the Expression Builder.

The applied expressions take affect on the live output stream immediately and you can see the changes you have made.
5.2 Creating an Exploration
This section explains how to create an exploration.
To create an exploration:
-
Navigate to Catalog.
-
Select Exploration in the Create New Item menu.
-
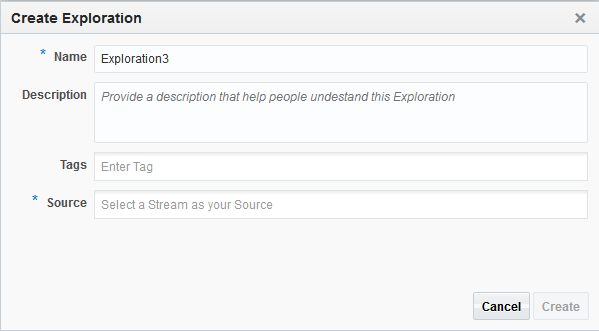
Enter information in the Create Exploration dialog. The Create Exploration screen is as shown below.
-
Enter a name for the exploration in the Name field. This is a mandatory field.
-
Provide a description that helps users understand about this exploration in the Description field. This is an optional field.
-
Enter a tag with which you want to tag the exploration in the Tags field. You can provide multiple tags. This is an optional field.
-
Select a stream as the source for the exploration in the Source field. This can be another exploration that is in published state. This is a mandatory field. You can select multiple streams.
Note:
You cannot create an exploration based only on a reference as the source. You must start with a stream and then add reference(s) as source later.
Attention
When you are using Spark as the runtime, you cannot select multiple streams for the exploration. Only a single stream is supported.
-
-
Click Create to complete the creation of an exploration. The new exploration opens in the Exploration Editor. The newly created exploration also appears in the Catalog.
You can continue to add further to the newly created exploration in this editor:-
Correlation — You must add correlations between sources if the exploration uses more than one source.
-
Summaries — You can add summary of the exploration data and then group the data accordingly. This is optional. See Summaries.
-
Filters — You can add filters to further filter the data based on the summaries you have added to the exploration. This is optional. See Filters.
-
Business Rules — You can add business rules to the data of your exploration. Business rules build conditional logic into the applications. This is optional.
-
Expressions — You can add expressions to the streaming exploration data. The expressions help you in populating new data fields in the stream by performing calculations on the existing data. Adding expressions is optional
-
-
You can perform the actions on the columns in the Live Output Stream.
-
Hide — hide any selected column
-
Remove — remove any selected column
-
Rename — rename any selected column
-
Function — add an expression to any selected columns
-
Restore — restore any removed columns. This option appears only when you have removed any column.
Figure 5-9 Actions You Can perform on the Individual Columns in the Live Output Stream
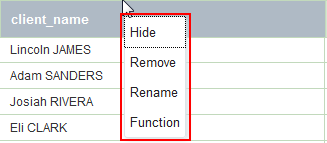
Description of "Figure 5-9 Actions You Can perform on the Individual Columns in the Live Output Stream"
-
-
Click Cancel at any point of time to abort the operation.
5.3 Editing an Exploration
When you create an exploration, the exploration opens up in the Exploration Editor. You have the option to edit the parameters of the exploration. You can edit or update existing explorations. You can add or modify the data sources for the exploration.
To edit an exploration:
-
Navigate to the Catalog.
-
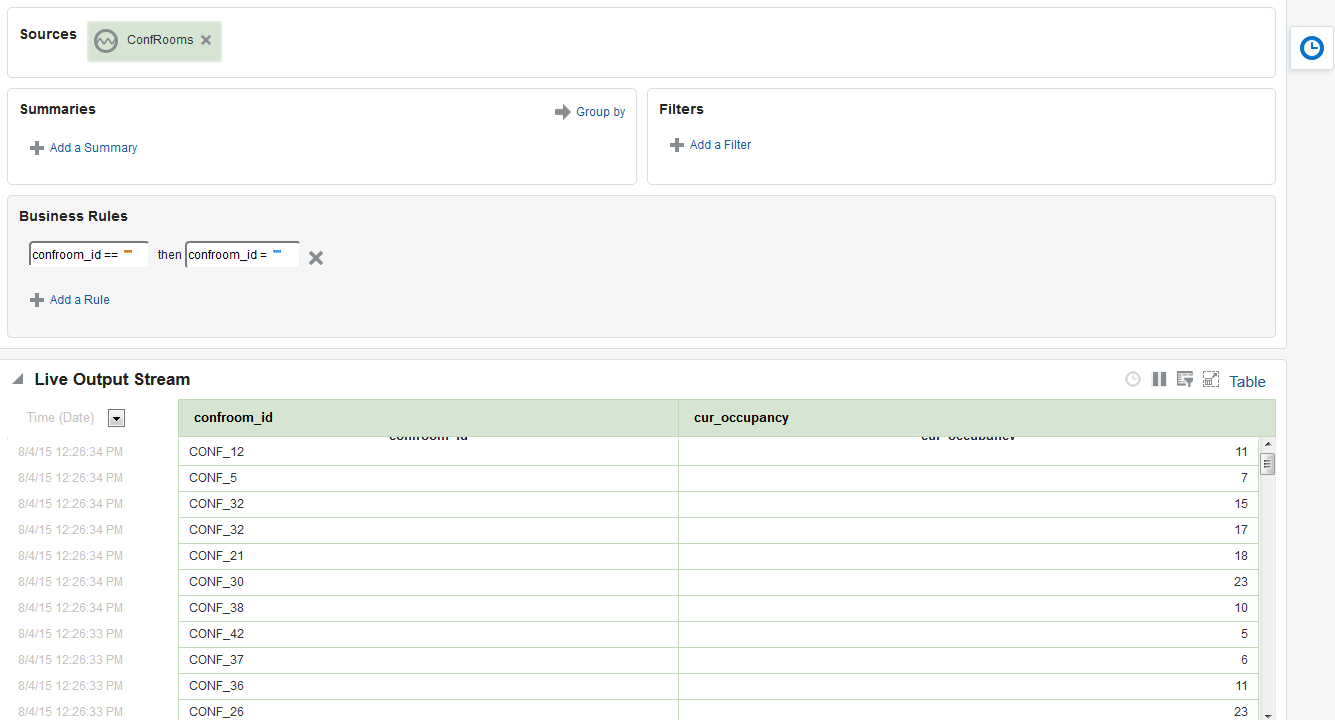
Identify the exploration that you want to edit or update. Click the name string of the exploration or the exploration icon to open it for editing. The Exploration Editor is as shown below.
-
Click anywhere in the Sources field to add or remove data sources. If you have more than one data source, the sources must be correlated.
Important
You cannot have more than one stream when you are using the Spark runtime.Remember
If you see an error similar to-ERROR: ../sxservices/webresources/v0.1/exploration/41 Empty exploration, check that you have at least one source in the exploration. When you remove all the data sources from the exploration, you see this kind of error message. -
Define the Correlations if the exploration has more than one data source.
Note:
Your changes to the exploration are not applied until the sources are correlated. An error message is generated when you try to save the changes without correlating the sources. -
Click Add Summary in the Summaries area to add a summary to the exploration.
Note:
You cannot use calculated fields in Group By feature. -
Click Add a Filter in the Filters area to add filters to the output. The filters further filter the streaming data based on the summaries you have added.
-
Click Add Rule in the Business Rules area to add business rules to the exploration. Business rules build conditional logic into your applications.
-
Click Timestamp to display the timestamp in the Live Output Stream. The timestamp at which the streaming data was captured appears against each row of live output stream. This is a toggle button and you can use it to switch ON or OFF the timestamp in the live data.
-
You can pause the live data that is streaming using the Pause icon and resume the stream using the Resume icon.
-
Click Restore Columns to restore any of the columns that you have hidden earlier.
-
Click Detach to detach the Live Output Stream into a separate window. You can attach it later again.
-
You can click the header of any column and rename the columns. And also you can click and drag any of the columns in the live output stream to reorder the columns. You can resize the columns using the mouse. You can also hide or unhide the columns.
-
You can add expressions or functions to the live output stream to calculate certain data based on the data that is streaming. Use the Expression Editor to add a function or expression. Click the expression editor and enter = followed by the required function in the Enter your expression field. Click the Done icon to finish adding the expressions and save the added expressions or functions. Click Cancel icon to abort the operation at any time.
-
Configure the number of graphs you want to be displayed for the output stream in the Charts area.
-
Click Window Drawer icon, available to the right of the screen, to specify time and event based windows used in processing your stream.
-
Select a value in the Range drop-down list and specify a numerical value. This value specifies the range of time period for the stream of data. The range is defined in units like now, nanoseconds, microseconds, milliseconds, seconds, minutes, hours, or events.
Now indicates that the range is as narrow as 1 nanosecond and unbounded indicates a range since the server has started. When the range is anything other than Now, another field, Evaluation frequency appears.
-
Select a value in the Evaluation frequency drop-down list and specify a numerical value. This value defines how often the system produces the result events.
Note:
Evaluation frequency cannot be greater than Range.
-
- Click the Show Topology icon to view the topology. For more information, see Topology Viewer.
-
Click the pencil icon at the top-right corner to view the information of the exploration.
-
Click Edit Info to update Name, Description, or Tags of the exploration.
Figure 5-11 Update Information of Exploration

Description of "Figure 5-11 Update Information of Exploration" -
Click Done after updating the information.
-
-
Click Undo Changes icon at the top-right corner to undo the changes you have made. Click Redo Changes icon at the top-right corner to re-apply the changes you have made. The Undo/Redo is applicable only on the following changes:
-
add/edit/delete summary
-
group by
-
add/edit/delete filter
-
specifying range
-
renaming the property in Live Output Stream
-
changes/updates in the Expression Editor.
Note:
Undo operation is not available for publish action. To undo a publish, you must un-publish the exploration.
Note:
Clicking Undo once, reverses only the last made change.
Note:
Clicking Redo once, re-applies only the last made change.
-
-
Click the User Assistant icon at the top-right corner to view explanation about the Exploration Editor. This icon acts as a toggle button.
-
Click Configure a Target to configure a target for the exploration. See Configuring a Target.
Note:
Only the fields that appear in the live output stream can be sent to the target.
Note:
When you edit an exploration, you must publish it again for the changes to be implemented.
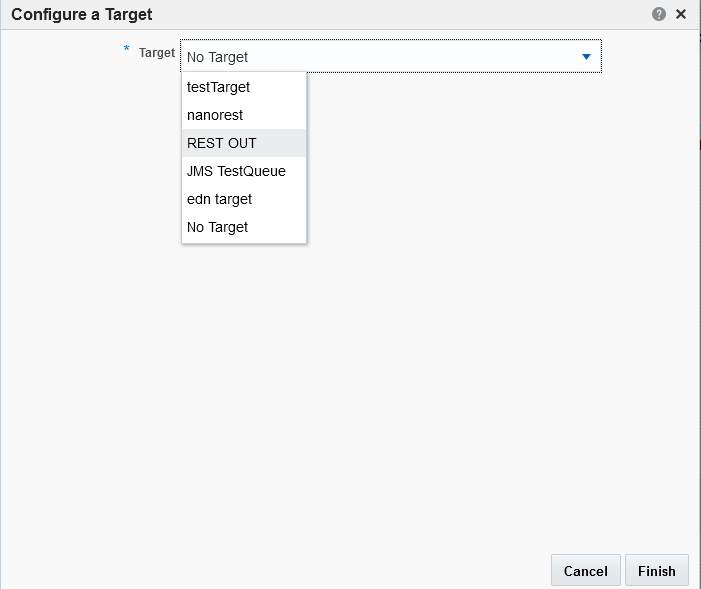
5.4 Configuring a Target
Every exploration must be configured with a target to send the details downstream. Unless the exploration is published, you cannot send the events downstream to the configured target.
To configure a target:
5.5 Understanding a Draft Exploration
When you create an exploration, it is in draft state by default. The draft exploration is not available to other users of the application. An exploration moves to a published state when it is published.
When a published exploration is deleted or unpublished, the exploration moves to a draft state.
A draft exploration has the following distinctive features:
-
it gets undeployed from the runtime once the Exploration Editor is closed
-
it is not sending events into the target even if there is a target. You have to publish the exploration before events appear in the target.
5.6 Publishing an Exploration
You must publish an exploration to make the exploration available for all the users of Oracle Stream Analytics. A published exploration:
-
can be used as a source for another exploration
-
will be visible to other users of the application
-
is in running state until another user unpublishes or deletes the exploration
-
can have targets applied.
To publish an exploration:
-
Navigate to the Catalog.
-
Identify the exploration you want to publish and click its name or icon.
-
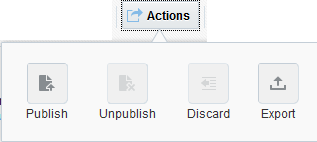
Select Publish from the Actions menu.
The exploration gets published and you can see a confirmation message. When the exploration is published, it is indicated in the Catalog as shown in the figure below.
You can publish/re-publish an exploration when no consumers are using it, in the following scenarios:
-
Re-publish a published exploration with no changes
-
Publish a published exploration after modifying its details (a published exploration moves to Draft status when it is modified). After publishing, the draft status changes to published status.
-
Re-publish an exploration that has a target configured.
When more than one user tries to publish the exploration after modifications, a conflict arises. The following conflict resolution actions help you in resolving the conflict:
-
Click Overwrite to overwrite the published version with the changes you have made.
-
Click Discard to discard your changes and go to the latest published version of the exploration.
-
Click Clone to publish the exploration under a different name, retaining changes from multiple users.
-
Note:
If there are any users using a published exploration, you cannot re-publish that exploration until you clear the dependencies.5.7 Unpublishing an Exploration
You can unpublish an exploration that has already been published.
Note:
If there are users using a published exploration, you cannot un-publish that exploration until you clear all the dependencies.To unpublish an exploration:
Note:
You cannot un-publish a published exploration when it is being used by any user.
5.8 Exporting an Exploration
Oracle Stream Analytics allows you to export an exploration as a JAR file and download it for reuse. If you try to export an exploration that is not published, you get an error message.
You can import the exported exploration into JDeveloper and develop the application. However, you cannot import an application or exploration into Oracle Stream Analytics.
Remember
You cannot export an exploration when you are using Spark as the runtime environment.To export an exploration:
-
Navigate to the Catalog.
-
Identify the published exploration you want to export and click it.
-
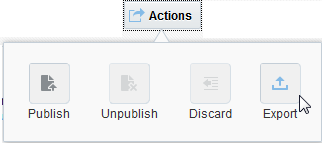
Select Export from the Actions menu.
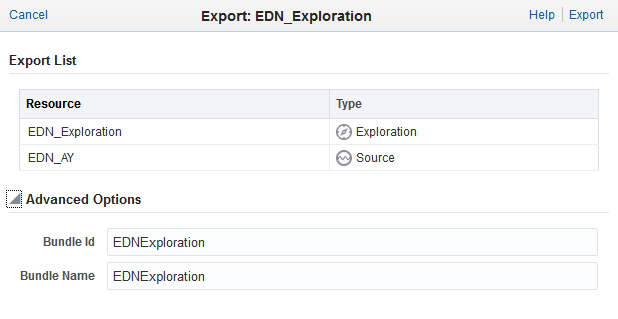
The Export Exploration dialog is as shown below:
-
Review the details of the exploration under Export List. Resource is the name of the exploration and its dependencies to be exported. Type is the type of the resource (exploration/source).
-
Edit/update the exploration bundle details under Advanced Options if required.
-
Enter a value in the Bundle ID field. This is an
OSGI Bundle-SymbolicNameparameter which is unique OSGI Bundle and will be the name of the exported JAR file. -
Enter a value in the Bundle Name field. This is the name with which the exploration will be exported.
-
-
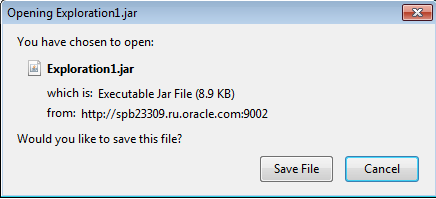
Click Export to complete exporting the exploration. The exploration is saved as a jar file. You can save the JAR file to any location.
-
Click Cancel at any point of time to abort the operation.
If an exploration uses any target or sources with specified user credentials (EDN, JMS, HTTP pubsub), then the exported exploration contains the credentials with encrypted passwords. Passwords are encrypted with the server encryption key. Usually, different servers use different encryption keys. As a result, you must update the encrypted passwords or convert them to plain text passwords before deploying the exploration to a server. If you do not do this, an encryption error appears.
5.9 Reusing an Exploration
You can re-use an existing exploration as a source for another exploration.
Remember
You cannot export an exploration when you are using Spark as the runtime environment.5.10 Marking an Exploration as Favorite
You can mark an exploration as Favorite. Marking an exploration as Favorite allows you to locate and navigate such explorations easily even if you have numerous items on the catalog.
To mark an exploration as favorite:
5.11 Deleting an Exploration
You can delete an exploration if you are sure you do not require the exploration anymore. When you delete a published exploration, it moves into a draft state. When an exploration is available in both draft and published state, the delete operation first deletes the draft exploration. When you invoke delete operation for the second time on the same exploration, the exploration gets deleted.
To delete an exploration:
5.12 Restoring an Exploration
An exploration goes to an invalid state in any of the following scenarios:
-
if the deployment was removed from the Visualizer
-
the EDN source could not start because of a network issue
-
a CSV source could not start because of the file absence
-
the corresponding Event Processing application was undeployed or paused on the Event Processing Server
The above stated scenarios are a few amongst the reasons why an exploration can go into an invalid state.
Invalid state indicates that there is no deployment for the object, either a source or a published exploration.
You can restore an exploration. The restore operation tries to deploy an object in invalid state with the information available in Oracle Stream Analytics. For example, there is an exploration E1 that uses the source S1, and both of them are in invalid state. When you invoke a restore operation on the exploration, the Oracle Stream Analytics tries to deploy both the stream and exploration in sequence.
To restore an exploration:


