5 Monitor an Oracle Fusion Applications Environment
Cloud Control monitoring functionality is built on the concept of “monitoring by exception". A variety of metric thresholds and compliance standards are delivered with Oracle Fusion Applications, which can be adjusted by administrators as needed. Cloud Control then monitors and raises events (or “incidents") when exception conditions occur in the IT environment, and notifications (or “alerts") can be triggered to appropriate administrators.
The Cloud Control interface also gives a range of graphical and textual information about the status, performance, configuration, and incidence history of targets.
Monitoring vs. Troubleshooting: Where's the Dividing Line?
Any administrator in charge of a complex enterprise system knows there is no clear dividing line between monitoring and troubleshooting. We monitor systems to check for trouble and forestall incidents; when trouble appears, we review configurations, performance histories, and alerts to find solutions. The division is fluid and sometimes arbitrary.
Nevertheless, Cloud Control provides a wealth of data and tools that the administrator will want to use, and “troubleshooting" is not always the place to describe them. This section (and the associated Cloud Control online help and user guides) provide an introduction to those tools. This section includes the following topics:
Other Cloud Control features are discussed in more depth in different areas of this Administrator's Guide.
5.1 Access Fusion Applications Home Pages in Cloud Control
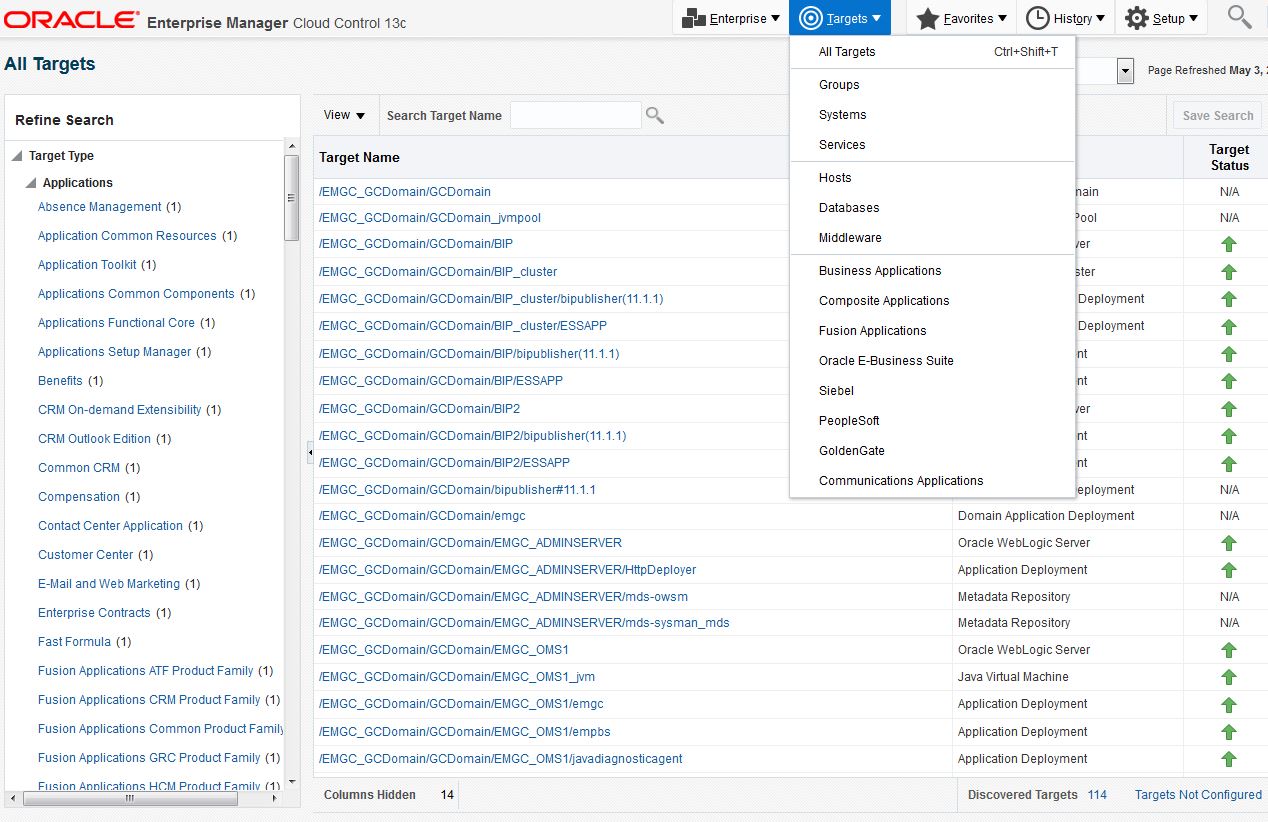
When the Discovery process has been completed and added the Fusion Applications targets to Cloud Control, log in to Cloud Control (see Log In to Cloud Control). Access Fusion Applications targets from the Targets menu, as described in the following sections.
Use the Home Pages in Cloud Control
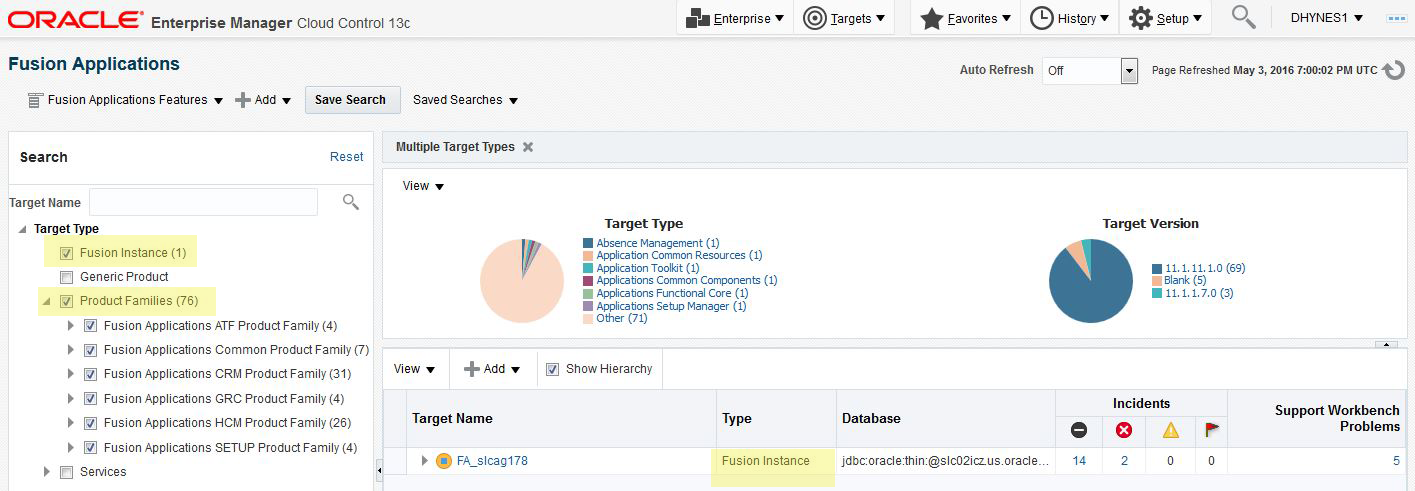
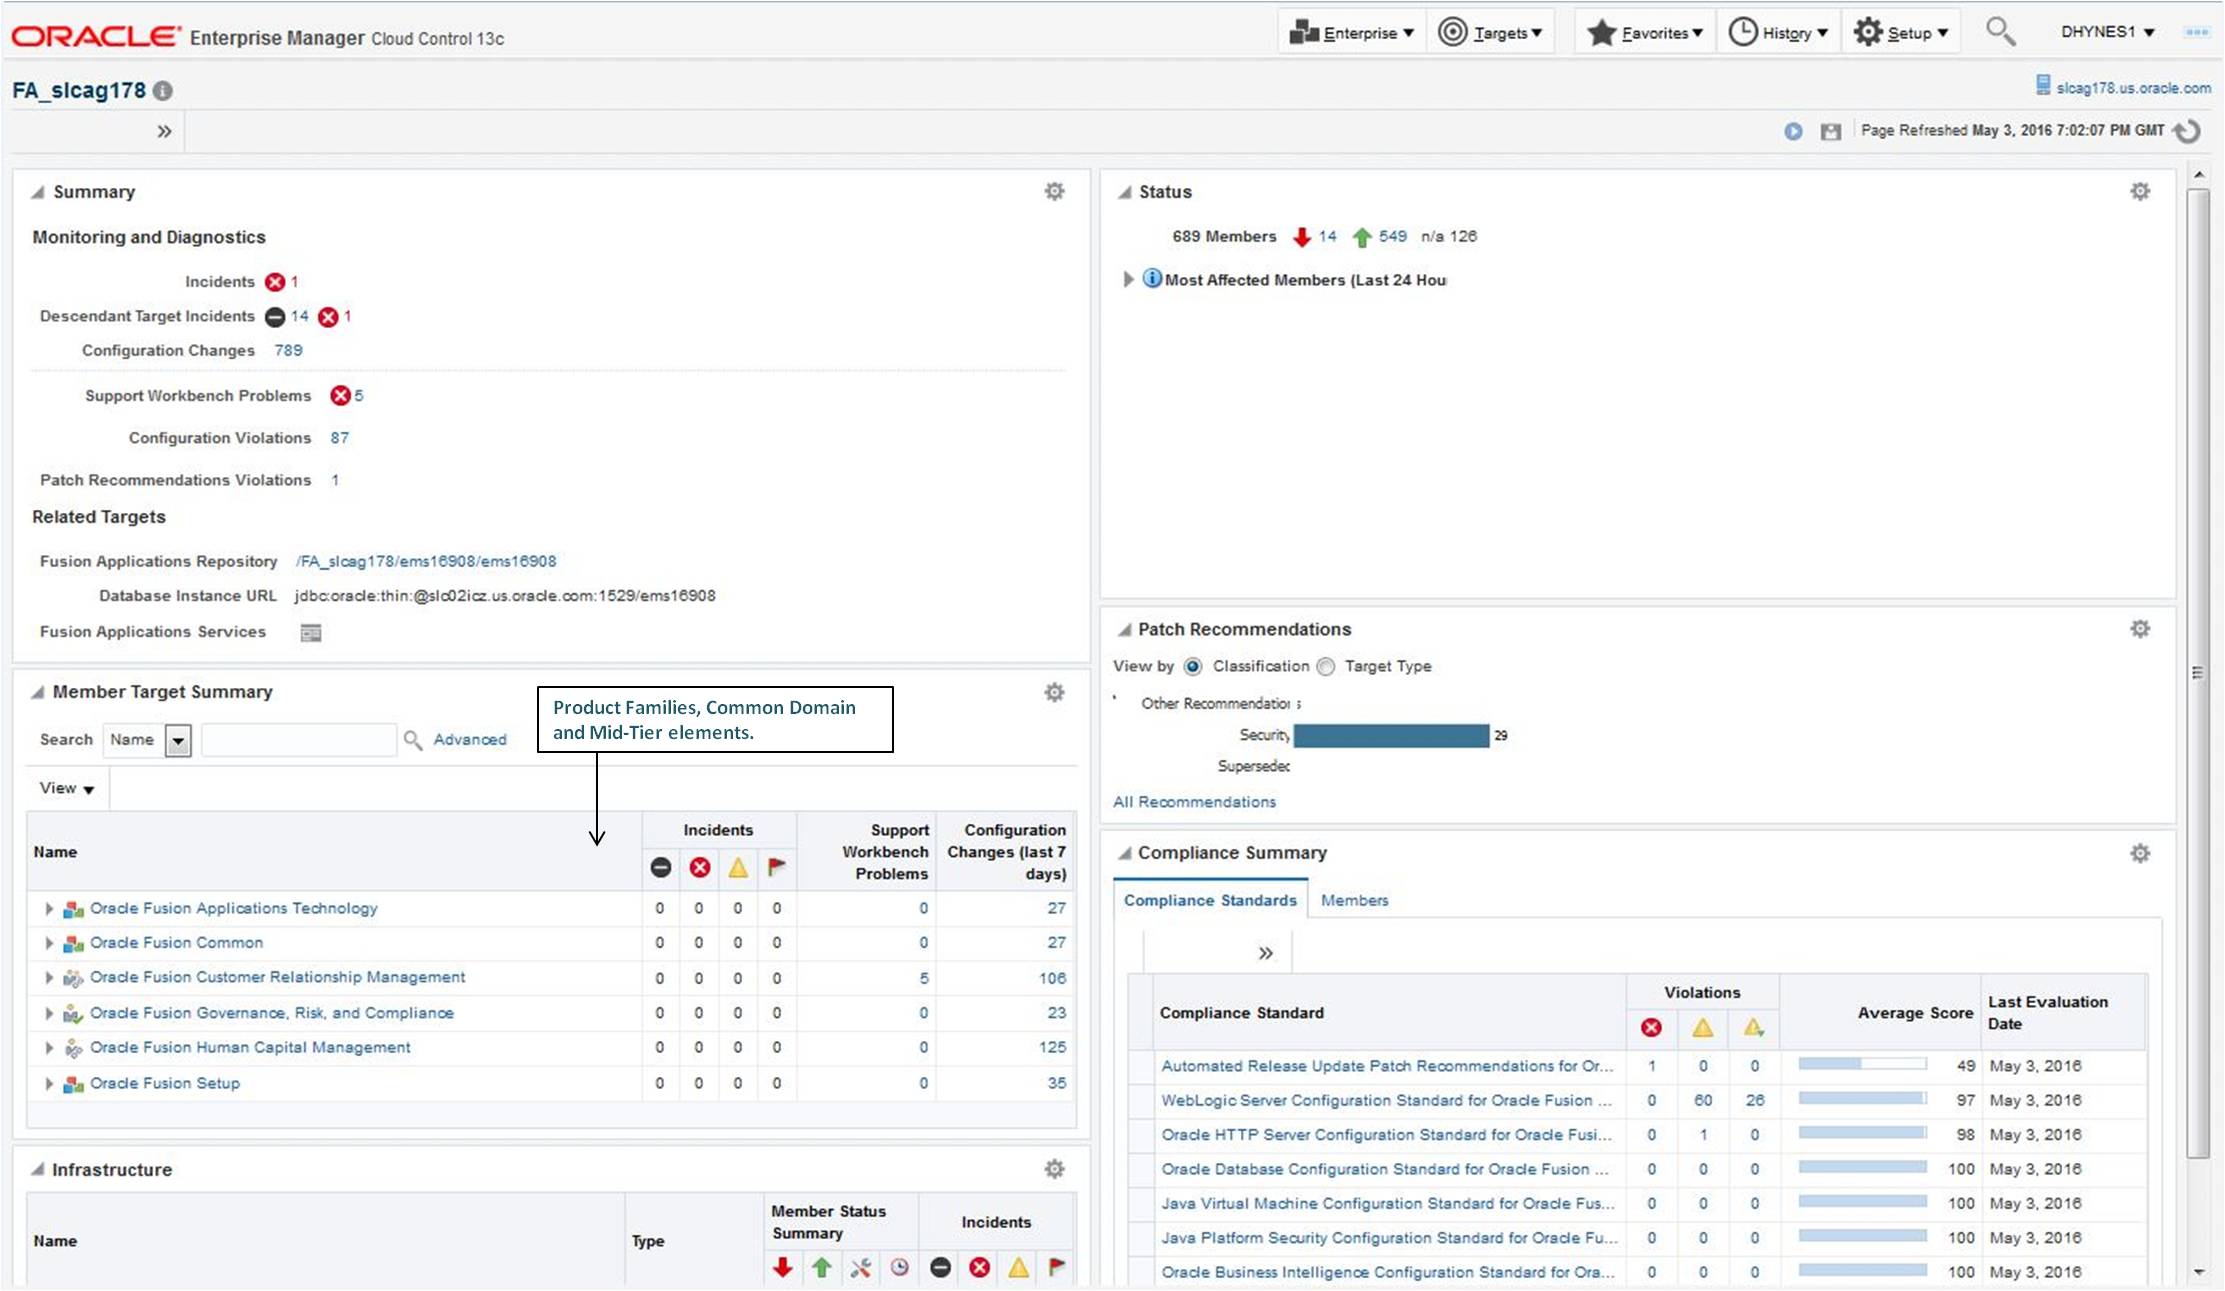
Because Oracle Fusion Applications is a large and interconnected system, and Enterprise Manager Cloud Control has the capacity to manage and monitor an enormous number and type of targets, there are multiple points of entry for most actions in the Cloud Control interface. The Home pages offer summaries that can be expanded at each level. For Oracle Fusion Applications environments, the primary levels are:
-
The Fusion Instance
-
The Fusion Applications Product Families
-
The Fusion Applications Products
-
The mid-tier and infrastructure elements (Common Domain, WebLogic server, SOA server, Business Intelligence (BI) components, Identity Management, and so on)
-
Clusters, with their Admin Servers and multiple Managed Servers
All the levels above are accessed by choosing Fusion Applications from the Targets drop-down menu.
To view the Fusion Applications Database information in Cloud Control, the access point is different. Normally Database is chosen from the Targets drop-down menu, instead of Fusion Applications. For details, see Manage Oracle Database for Oracle Fusion Applications. (On some other Home pages, there are also links to relevant databases, but selecting Targets and then Database drop-down yields the most comprehensive approach.)
Things to notice:
-
The various panels on Cloud Control pages can be rearranged on the screen.
-
The Instance Home page gives link-access to Product Families, Products (if the Family tab is expanded), Business Intelligence and Identity Management components, and Common Domain and other mid-tier elements.
5.1.2 Access the Product Family and Product Home Pages
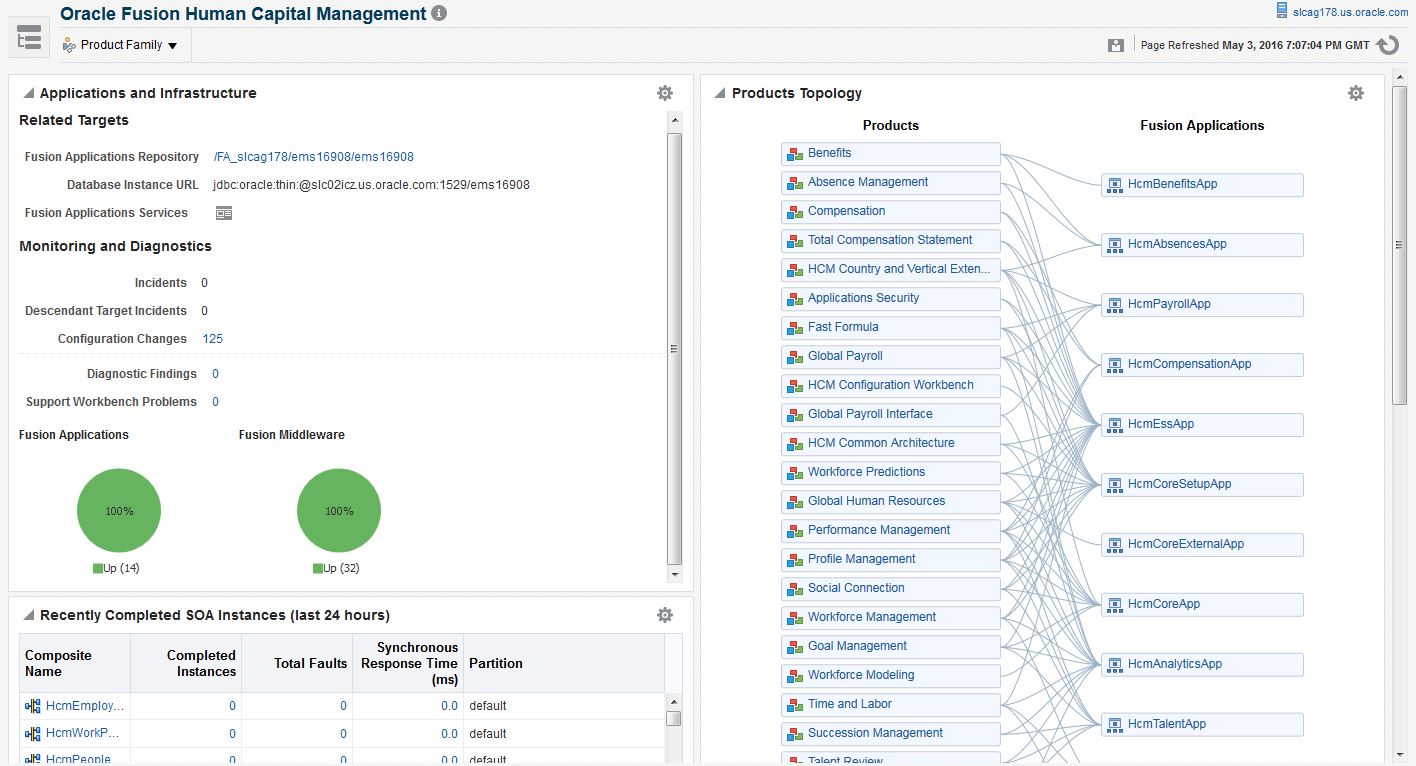
To get to the Product Family level, various points of entry can be chosen. It is possible to access the Instance Home and click on a Product Family link, or choose “Product Families" from the Target Types panel on the left side of the Overview page, and select from that list. An Instance link can be expanded and then, click directly on a Product Family. Cloud Control is a flexible and multi-accessible interface.
Figure 5-5 The Product Family Home Page in Cloud Control
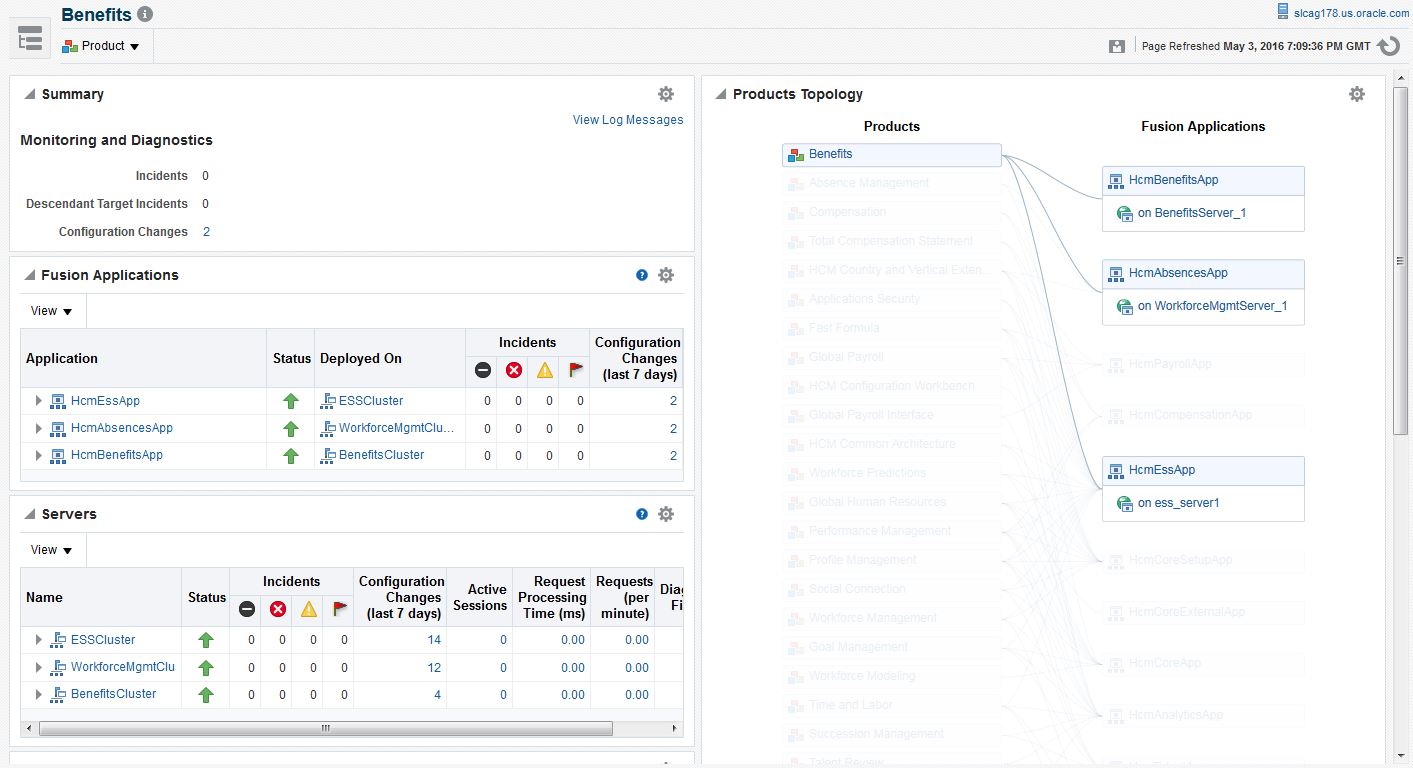
A particular product can be clicked to display the Product Home page.
Figure 5-6 The Product Home Page in Cloud Control
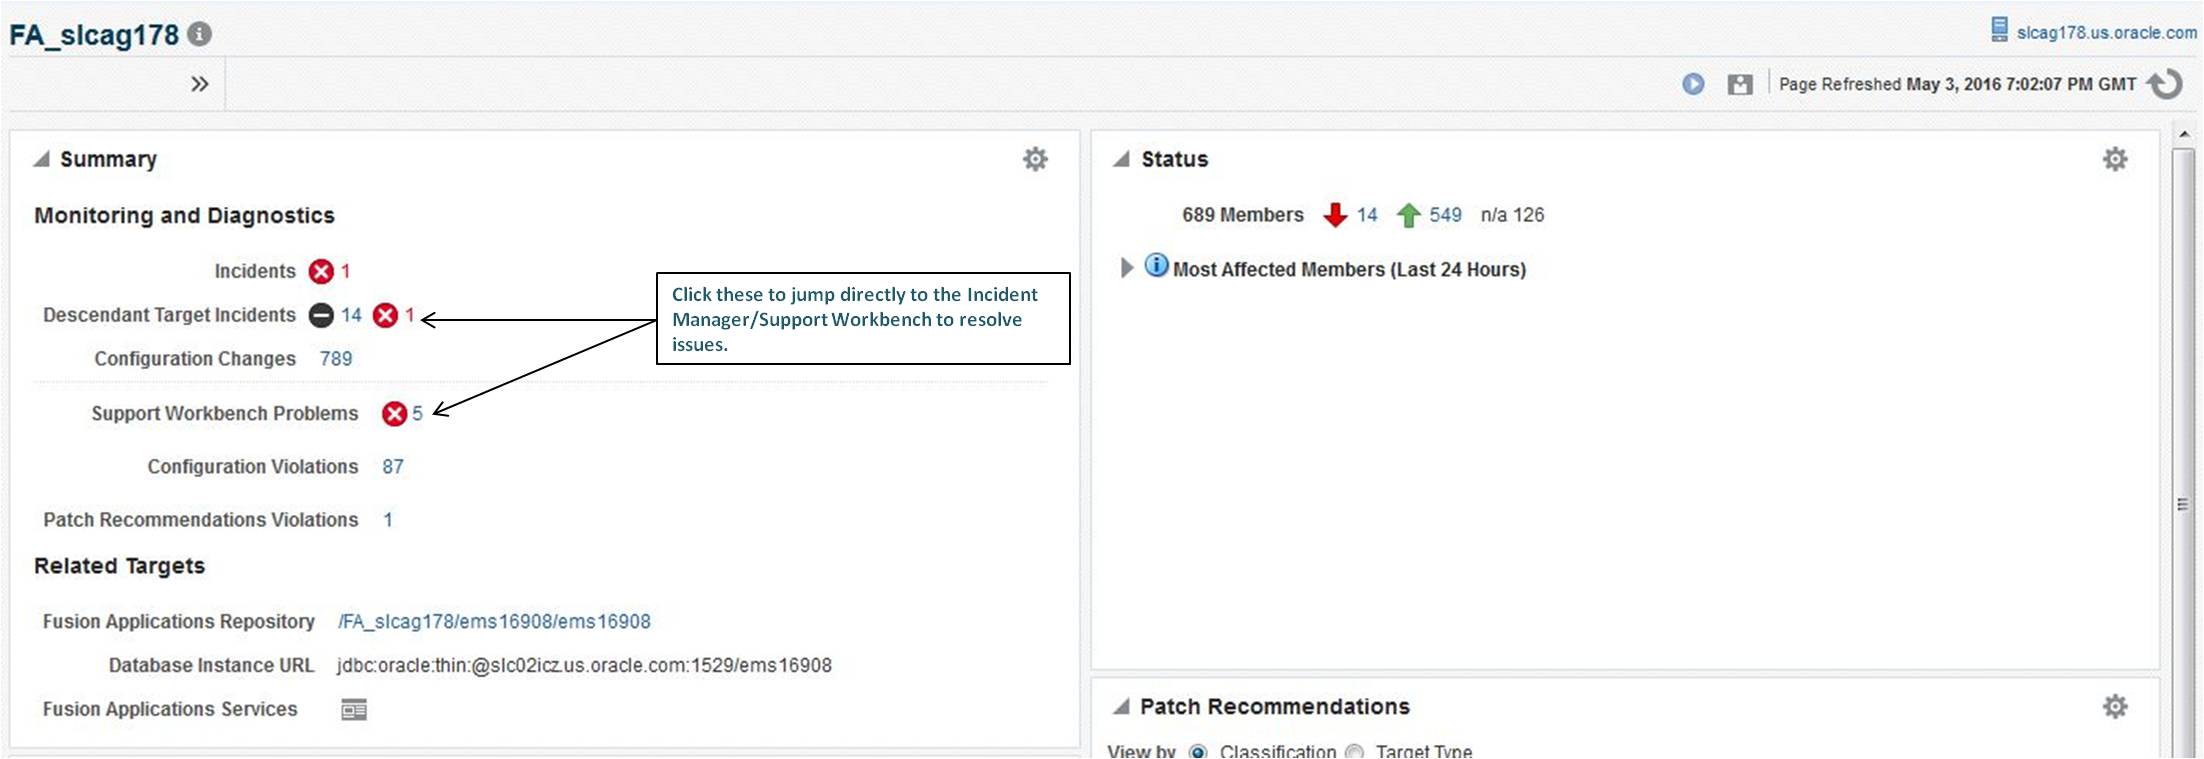
As the screenshots show, Home pages present similar kinds of information. The following sections describe in more detail how to use the Monitoring and Diagnostics panels, the Key Performance Indicators, the Topologies, and the various menu items such as Monitoring Templates, Compliance Standards, Alerts, and Blackouts that will be used to manage Oracle Fusion Applications.
5.1.3 Access the Fusion Applications-Related Cloud Control Menu
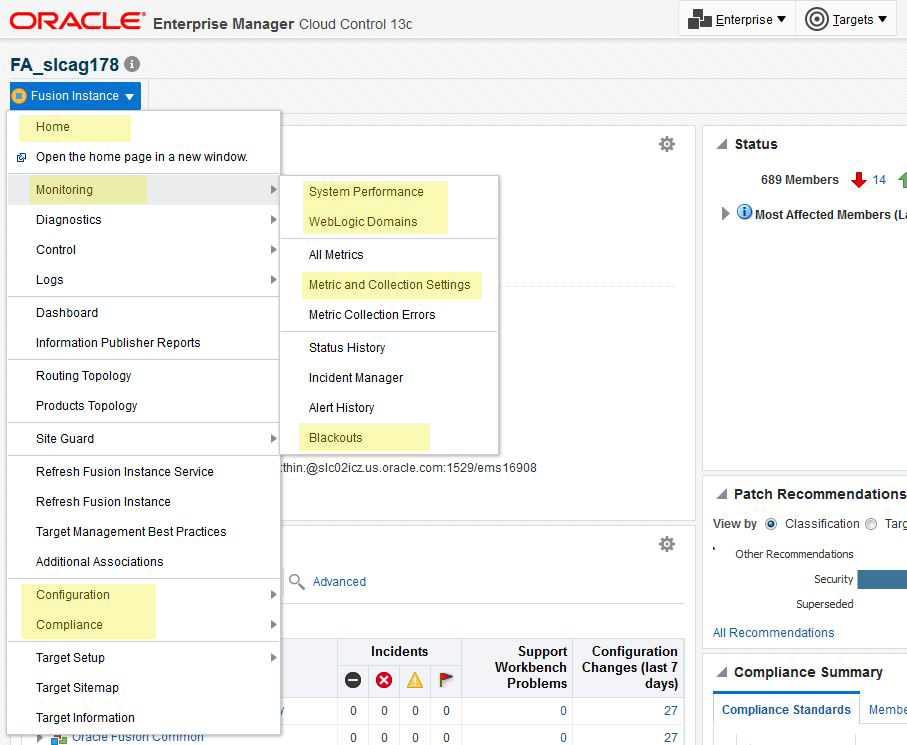
Whatever target type is chosen, whether Instance, Product Family, Product, or other, the drop-down menu at that level will have some similar items. These are the actions that are particularly relevant to a Fusion Applications administrator.
Figure 5-7 Cloud Control Menu for Fusion Applications Targets
Even within the menu, there may be multiple points of entry for a single destination. For example, opening the drop-down menu and choosing Monitoring then, Blackouts and then Create will result in the same functionality as opening the drop-down menu and choosing Control , and then Create Blackout.
5.2 Access and Use the Topology Views
There are three types of interactive topology charts provided in Cloud Control: Routing Topology, Product Topology, and Configuration Topology. Each one provides a birds-eye view of the Oracle Fusion Applications installation, based on the discovered targets.
5.2.1 View Options
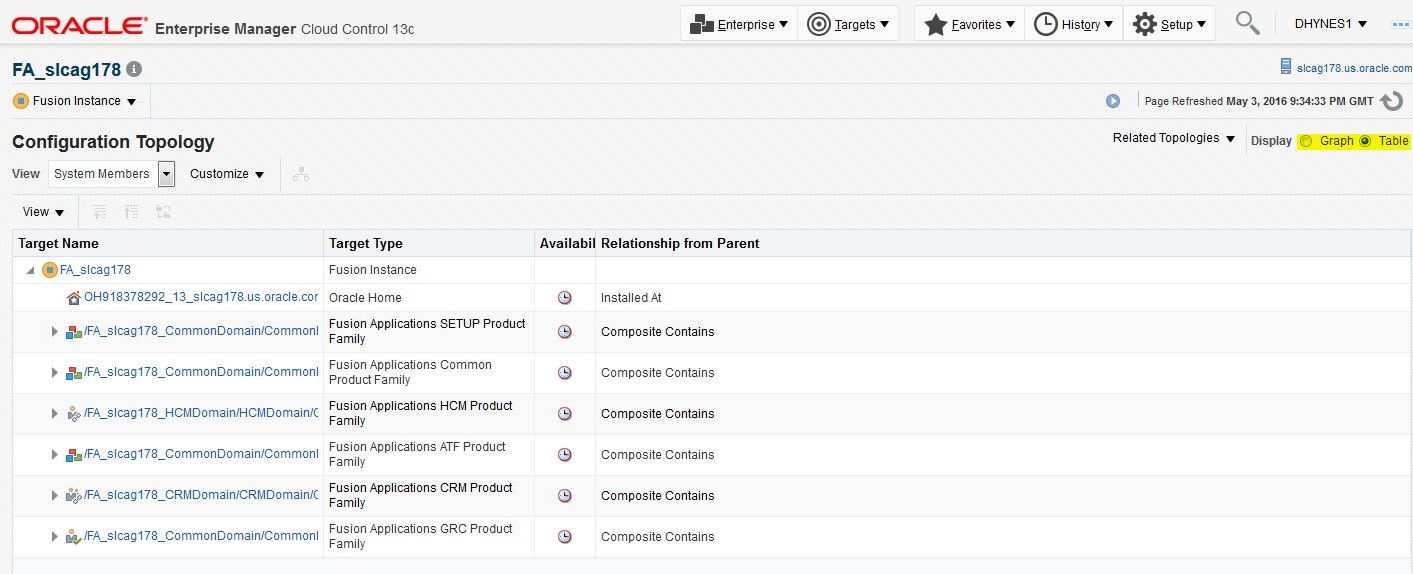
All three topologies can be viewed as graphs. The Configuration topology can also be viewed as tables. Hover over graphical items to get additional tool tip information. It is possible to pan and zoom a graph, and click on a node to highlight interrelationships. Also print topologies or save them to a .png file. Search for targets can be done and then, filter them to show certain nodes, or a certain status (up, down, fatal incidents, etc.).
On any Topology page, the Options menu makes possible to choose which annotations to display, change the layout, print, and reload the topology. (Figure 5-9)
Topology views are automatically displayed on some Home Pages, and they can always be selected from the drop-down menus. The view seen will depend on the level at which Topology view was chosen. Choosing at the Instance level gives a different picture than choosing at the Product Family level, for example.
It is also possible to create a custom Topology view. See section Creating a Custom Topology View in the Cloud Control online help for details.
For more information on how to use topology interfaces, see section Interactive Gestures in the Cloud Control online help.
5.2.2 Access Options
As usual, there are multiple inroads to the Topology views. The following are the main ones:
-
From a Home Page (see Figure 5-6 for example)
-
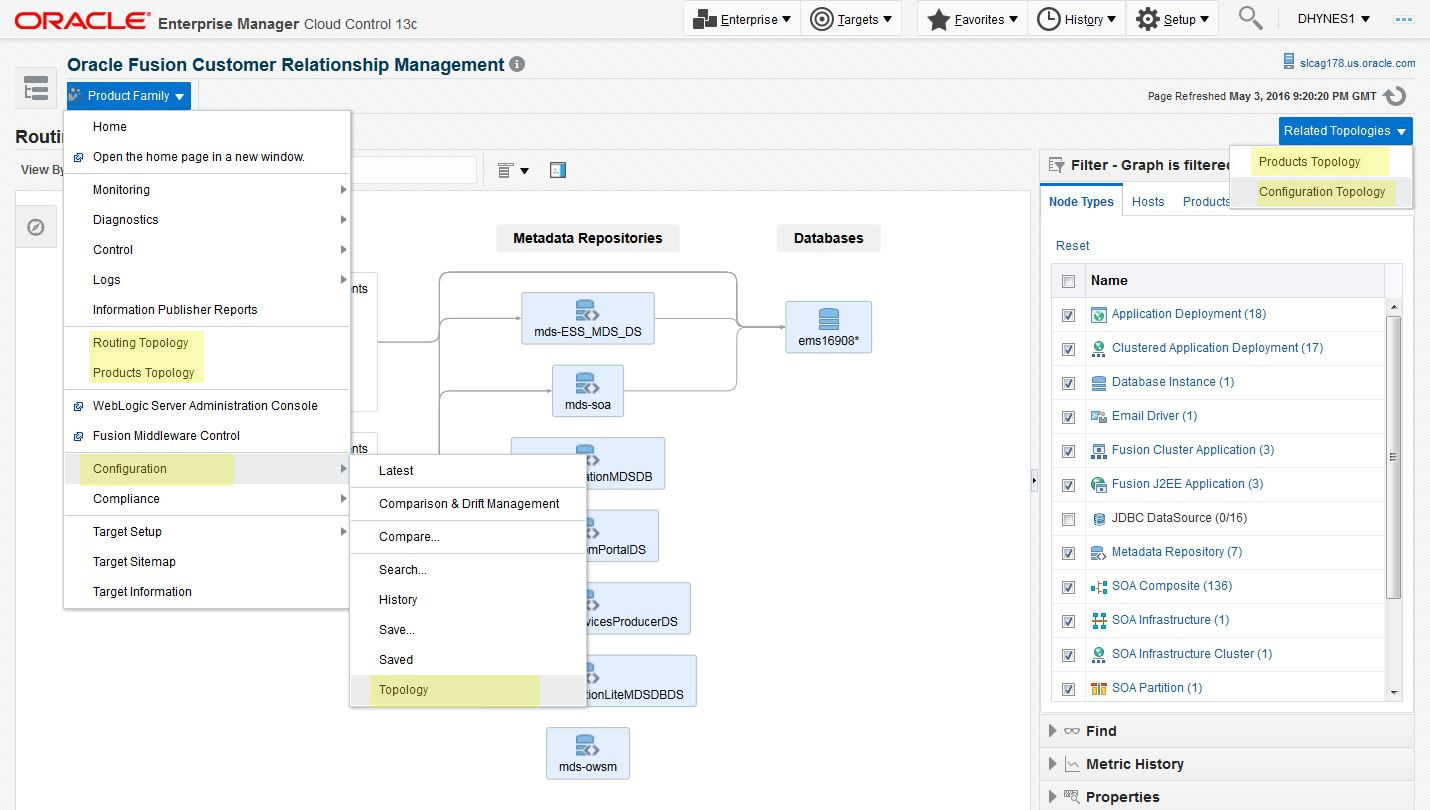
From the Instance expand Product Family, then Products Drop-Down Menu: The Routing and Products Topologies are listed directly on this menu. The Configuration Topology is under Configuration then, Topology (Figure 5-9)
-
From the Related Topologies link within any Topology view (Figure 5-9)
Figure 5-9 Access Options for Topology Views
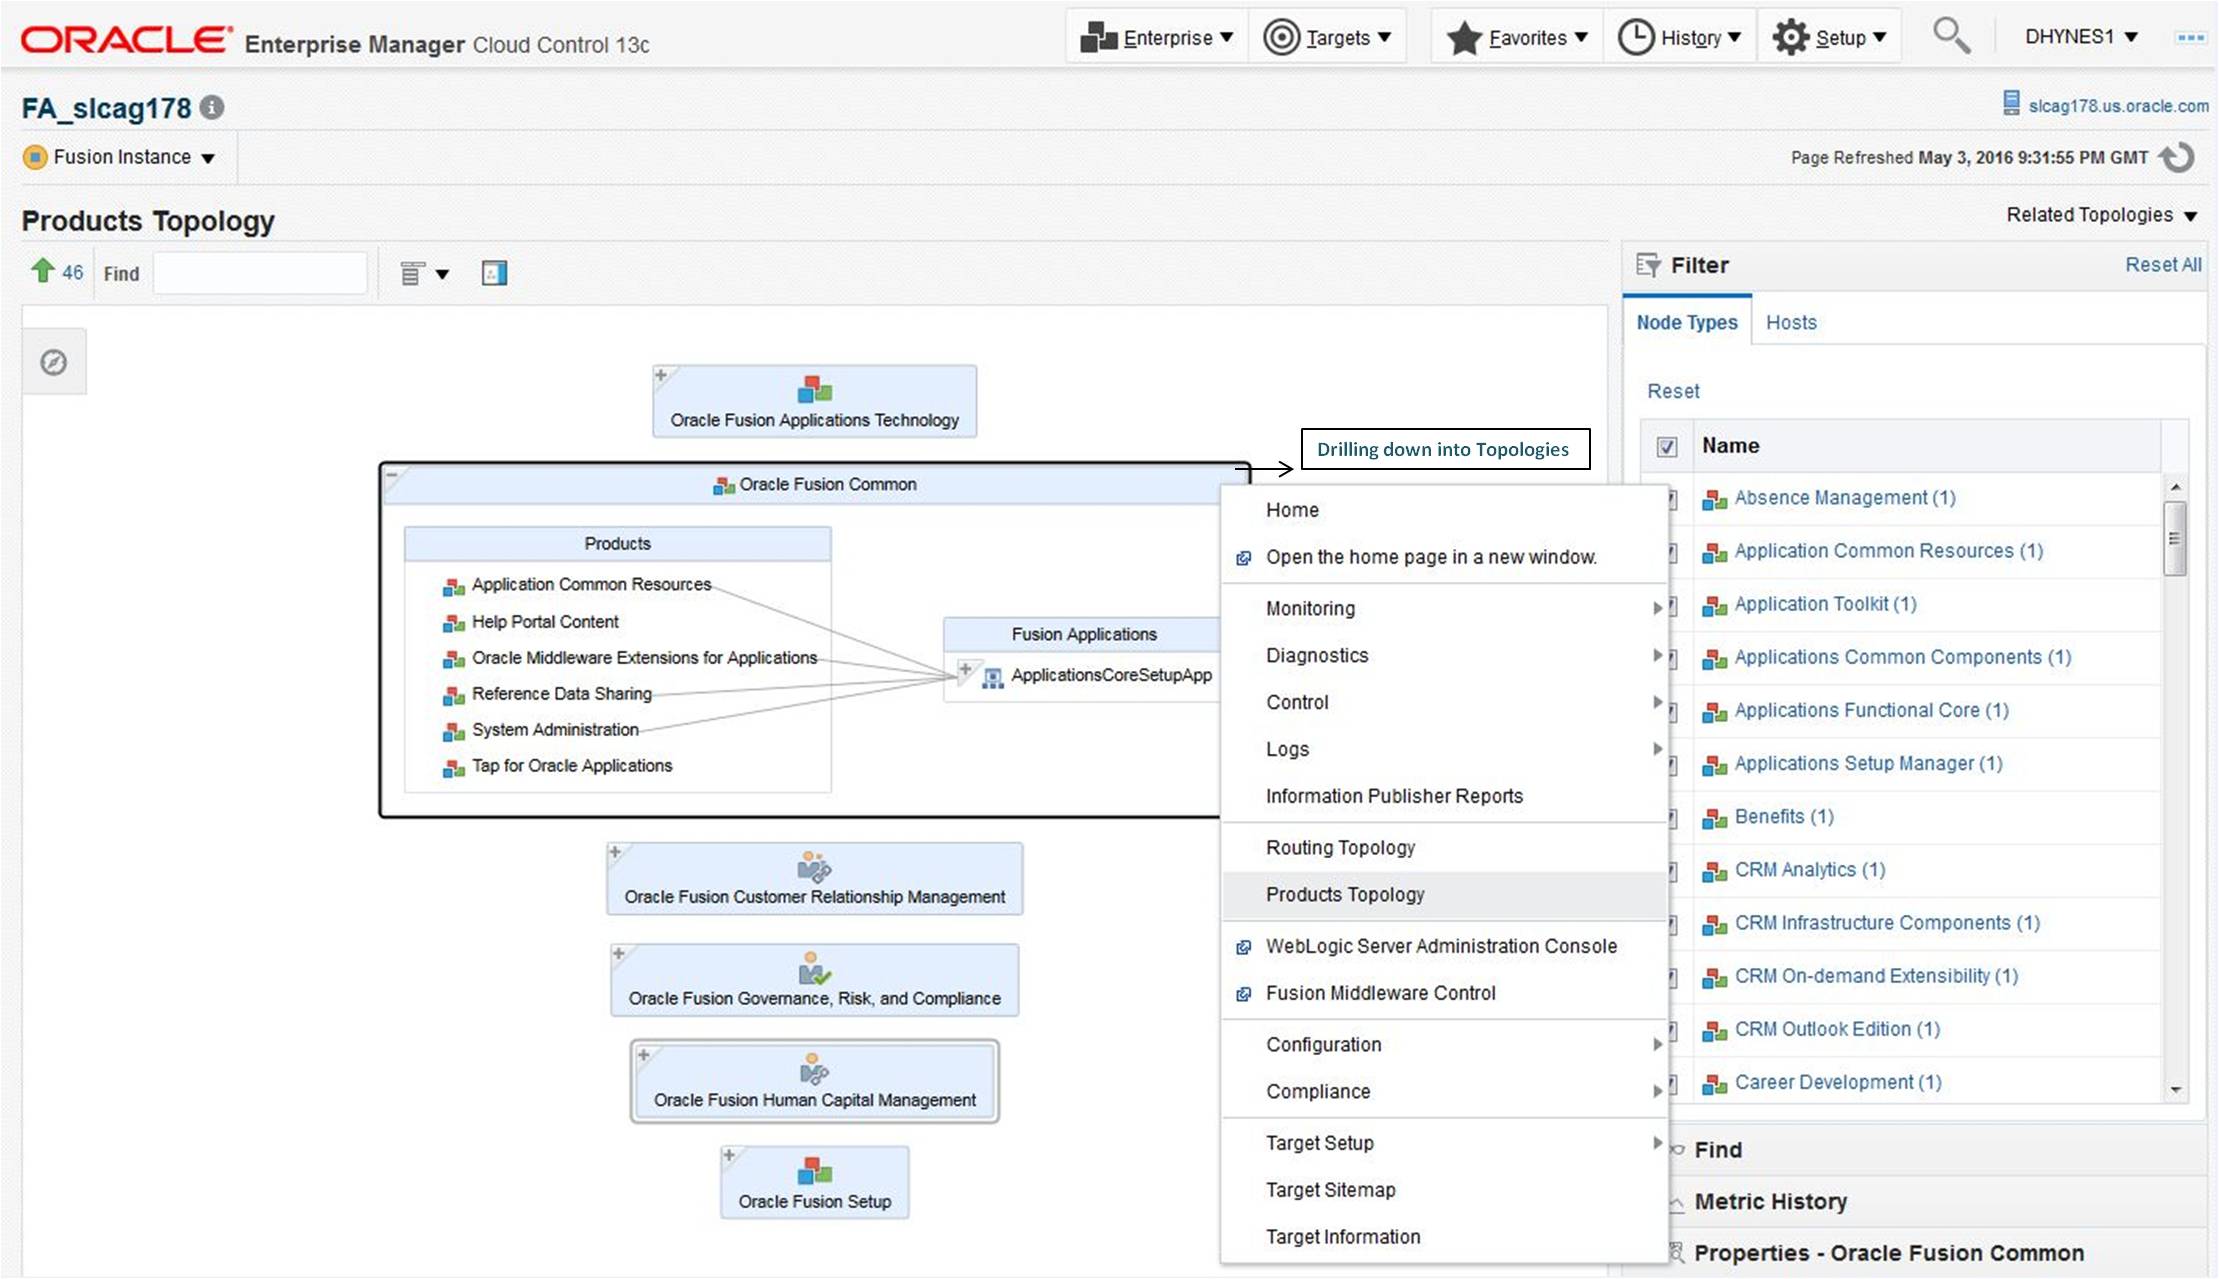
Right-clicking a node within a topology view: For example, if Product Topology is chosen at the Instance level, and then right-click a resulting Product Family node, Product Topology can again be selected from the resulting menu. Then the topology will be seen at the Product Family, rather than Instance level, with more detailed information.
5.2.3 Use the Routing Topology
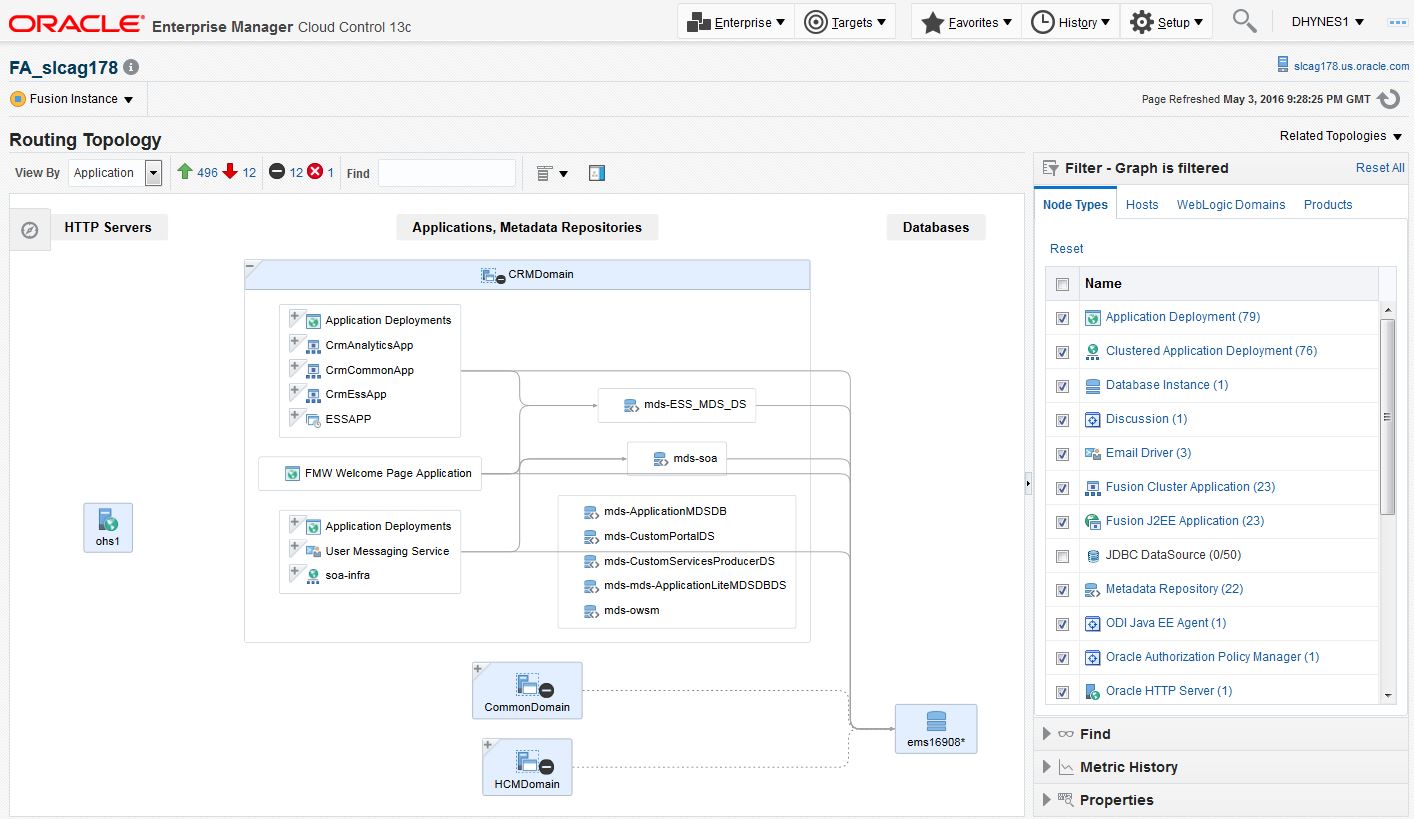
The Routing Topology shows relationships between the HTTP server, the middleware and application servers, and the various databases of an Oracle Fusion Applications instance, product family, or product.
To view the Routing Topology after logging in to Cloud Control:
5.2.4 Use the Products Topology
Products Topology views give increasingly more detail about the products, their product families, and their position in the environment, as drilling down from Instance level.
5.2.5 Use the Configuration Topology
The configuration topology shows the inter-relationships between targets and is used to answer questions such as the following:
-
On what targets does this target rely?
-
What targets will be affected if this target goes down?
-
How are the members of my system related?
A Configuration Topology can be viewed as either a graph or a table Use the Configuration Topology.
Figure 5-12 Configuration Topology Page
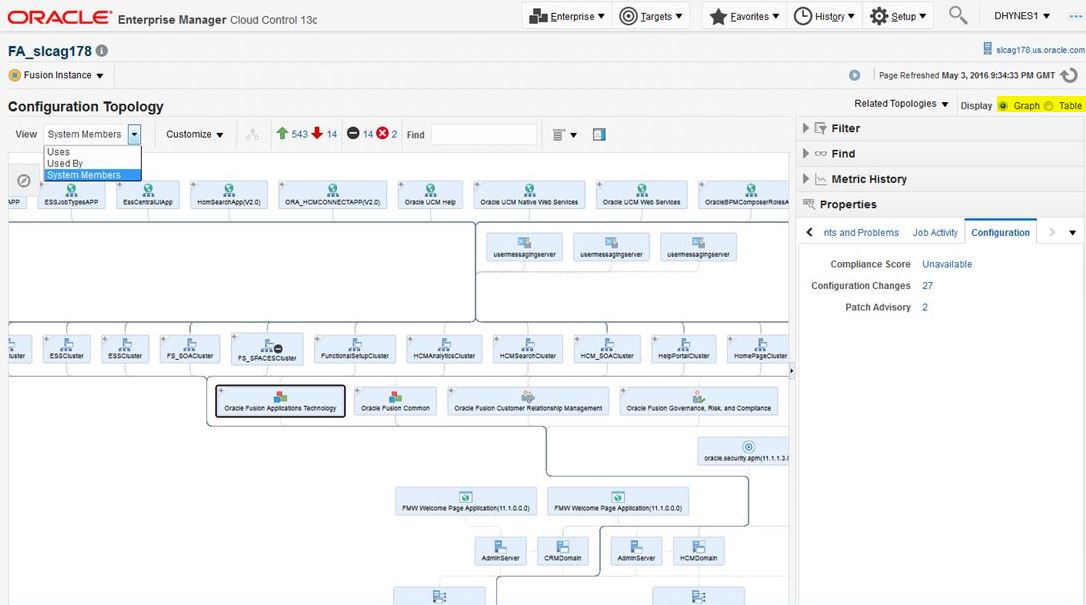
Figure 5-13 Configuration Topology with Table Option Page
5.3 Monitor System and Key Performance Indicators
5.3.1 Check System Performance Pages
This section contains the following topic:
5.3.1.1 Monitor the System Performance of Oracle Fusion Applications Deployed to a Cluster
During installation, Oracle Fusion Applications automatically deploys each application to a Managed Server in a cluster. For each Managed Server in the cluster, there is an instance of the application on each Oracle WebLogic Server.
There are times when monitoring the system performance of the application on an individual server is needed, and times when monitoring the overall performance of the application across all the servers in the cluster is required.
For example, normally, managing the overall performance of the application would be done to determine if there are any performance issues affecting all users of the application, regardless of which instance users access. If a performance problem is noticed, it is possible to drill down to a specific instance of the application to determine if the problem is affecting one or all of the application instances in the cluster. Cloud Control provides monitoring pages for both of these scenarios.
5.3.1.1.1 Monitor the Performance of Oracle Fusion Applications Cluster Applications
To monitor the overall performance of the Oracle Fusion Applications cluster applications with Cloud Control:
-
Navigate to a product family home page:
-
From the Targets menu, choose Fusion Applications.
The Fusion Applications List page displays.
-
In the table on the Fusion Applications page, click the appropriate Product Family target.
-
-
From the navigation pane, expand Fusion Applications.
Cloud Control lists the applications deployed in the current domain.
-
Monitor the overall performance of the applications on a cluster by clicking the cluster application name, for example, PayablesApp.
The Fusion Cluster Application page displays.
-
View performance metrics. From the Fusion Cluster Application menu, choose Monitoring, and then Performance Summary.
The Performance Summary page displays. For more information about using this page, see the topic Using Performance Summary in the Cloud Control online help.
-
From the Performance Summary page, a metric name can optionally be selected.
The Additional Information dialog displays. From this dialog, more details about the metric can be viewed with the following links:
-
Problem Analysis
Directs to the Problem Analysis page. This page makes possible to see a metric with other related metrics, which are affecting the metrics being analyzed. It also shows the related targets and the related targets topology. The Problem Analysis is only available for request-related metrics, such as the Request Processing Time (ms) and Request (per minute).
-
Analyze Logs
Displays a message that shows the logs for a target on which the metric is viewed.
-
Metric Details
Shows historical metric data.
-
Target Home
Directs to the home page.
When used together, Problem Analysis and Analyze Logs can help with metrics inspection, target status information, and logs during troubleshooting. These links are not available for all metrics.
-
5.3.1.1.2 Monitor the Performance of Oracle Fusion Application Instances
To monitor a specific instance of the application with Cloud Control:
-
Navigate to a product family home page:
-
From the Targets menu, choose Fusion Applications.
The Fusion Applications List page displays.
-
In the table on the Fusion Applications List page, click the appropriate Product Family target.
-
-
From the navigation pane, expand the product family, then Fusion Applications.
-
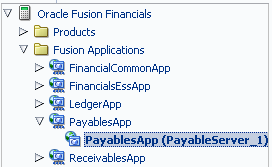
Expand the cluster application that needs to be monitored to show each instance of the application, as shown in the following figure:
Figure 5-14 Expansion of Fusion Applications Family
-
Monitor the overall performance of an application instance in cluster by clicking one of the application deployment instances, for example, PayablesApp (PayablesSever_1).
The Fusion J2EE Application page displays.
-
View performance metrics. From the Fusion J2EE Application menu, choose Performance Summary.
The Performance Summary page displays. For more information about using this page, see the topic Using Performance Summary in the Cloud Control online help.
-
From the Performance Summary page, a metric name can optionally be selected.
The Additional Information dialog displays. From this dialog, more details about the metric can be shown with the following links:
-
Problem Analysis
Directs to the Problem Analysis page. This page makes possible to see a metric with other related metrics, which are affecting the metrics being analyzed. It also shows the related targets and the related targets topology. The Problem Analysis is only available for request-related metrics, such as the Request Processing Time (ms) and Request (per minute).
-
Analyze Logs
Displays a message that shows the logs for a target on which the metric is viewed.
-
Metric Details
Shows historical metric data.
-
Target Home
Directs to the home page.
When used together, Problem Analysis and Analyze Logs can help with metrics inspection, target status information, and logs during troubleshooting. These links are not available for all metrics.
-
5.3.2 Check Key Performance Indicators
The Key Performance Indicators page displays an overview of the performance metrics of a given product family. Typically, several default metrics display on the page in the form of graphs. Multiple metrics are tracked, and these can be added to the Key Performance Indicators page. Each product belonging to a given product family has its own set of metrics.
It is possible to modify the Key Performance Indicators page as follows:
-
Add or remove metrics from the page.
-
Display performance data in tabular format.
-
Save or delete a set of performance charts.
-
Re-organize the display of charts, for example move charts up or down.
-
Display the performance metrics of another instance of the product on top of the current chart sets, or display earlier metrics of the same product instance on top of current metrics.
-
Toggle on or off the grid display on the performance chart set.
-
Modify the performance time period.
5.3.3 Monitor Mid-Tier Elements
This section describes how to monitor an Oracle WebLogic Server, discussing how to view the status of the following:
-
Oracle WebLogic Server domains
-
Oracle WebLogic Server Administration or Managed Servers
-
Clusters
5.3.3.1 Monitor an Oracle WebLogic Server Domain
It is possible to view the status of a domain, including the servers, clusters, and deployments in the domain from the domain home page of Fusion Middleware Control:
-
From the navigation pane, expand the farm, and then WebLogic Domain.
-
Select the domain.
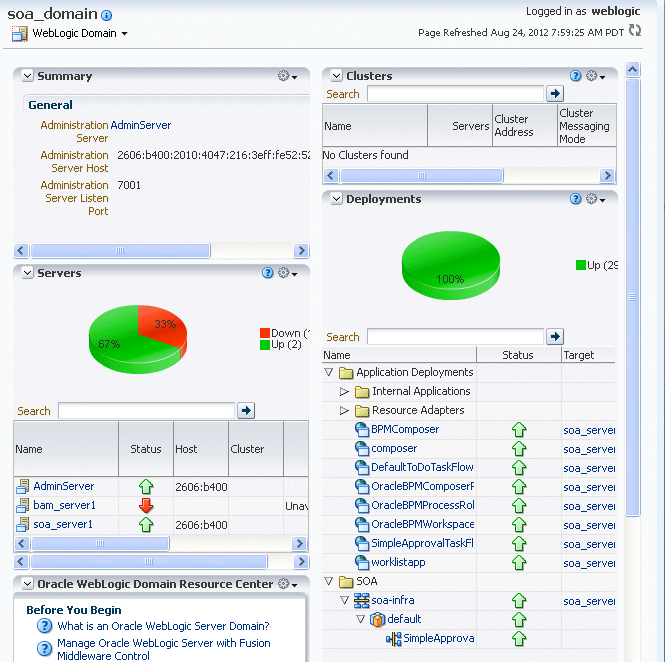
The domain home page is displayed, as shown in the following figure:
This page shows the following information:
-
A general summary of the domain, along with a link to the Oracle WebLogic Server Administration Console
-
Information about the servers, both the Administration Server and the Managed Servers, in the domain
-
Information about the clusters in the domain
-
Information about the deployments in the domain
-
A Resource Center, which provides links to more information
5.3.3.2 Monitor an Oracle WebLogic Server Administration or Managed Server
It is possible to view the status of a WebLogic Server Administration Server or Managed Server in Fusion Middleware Control:
-
From the navigation pane, expand the farm, the WebLogic Domain, and then the domain.
-
Select the server.
The server home page is displayed.
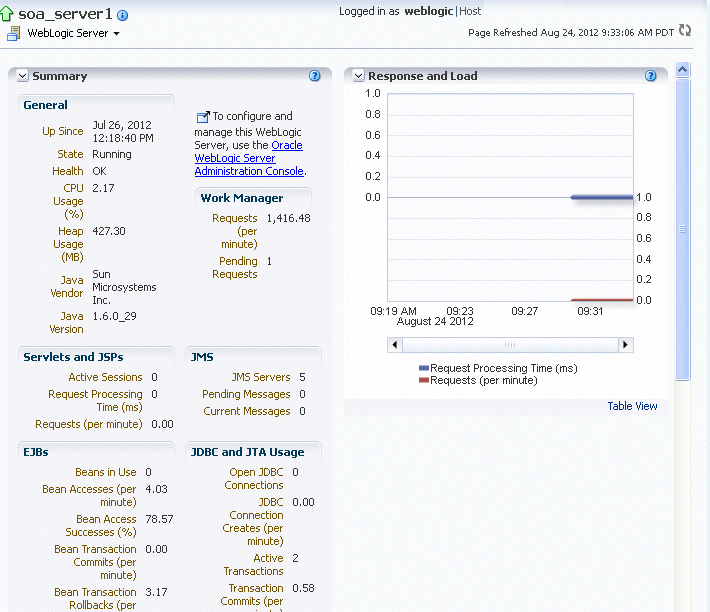
The following figure shows the home page for a Managed Server:
Figure 5-16 Home Page for a Managed Server
This page shows the following:
-
A general summary of the server, including its state, and information about the servlets, JSPs, and EJBs running in the server
-
Response and load
-
Information about the applications deployed to the server
5.3.3.3 Monitor a Cluster
It is possible to view the status of a cluster, including the servers and deployments in the cluster using Fusion Middleware Control:
-
From the navigation pane, expand the farm, then WebLogic Domain, and then the domain.
-
Select the cluster.
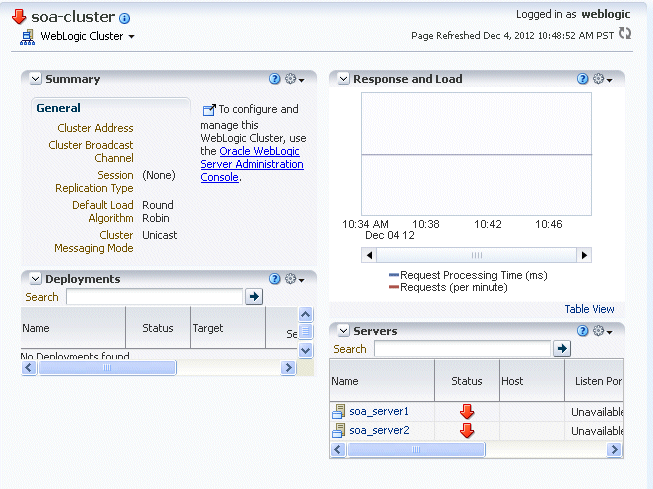
The cluster page is displayed, as shown in the following figure:
This page shows the following information:
-
A general summary of the cluster, including the broadcast channel, if appropriate, the load algorithm, and the messaging mode
-
A response and load section, which shows the requests per minute and the request processing time
-
A deployments section with information about the applications deployed to the cluster
-
A server section, with a table listing the servers that are part of the cluster
-
5.3.4 View Activity, Historical Reports, Metrics, and Chart Sets
It is possible to monitor the performance of an instance, specifically current and historical performance data, as well as a summary of all performance data. Performance data displays in a chart set, which is saved, deleted and reordered. Additionally, the time period for which performance data displays can be modified.
5.3.4.1 View a Summary of Activity
The Oracle Enterprise Scheduler Performance Summary page displays current charts of job requests such as requests completed per hour, running requests, requests by processing time and requests by status.
To view a summary of Oracle Enterprise Scheduler activity:
-
From the Scheduling Service menu, choose Performance and then, Service Summary.
By default, this page displays job requests running during a selected time period in the following categories:
-
Requests completed per hour
-
Processing times, average, minimum and maximum
-
Running requests and maximum running requests
-
Requests over the past hour with the status
SUCCESS,WARNING,ERRORorCANCEL.
The metrics displayed can be changed on the Service Summary performance page. Click the Show Metric Palette button to display the metric palette for Oracle Enterprise Scheduler.
-
-
The duration for which performance data display can be changed: topicid:ess_selectperformanceperiod_proc
-
Optionally, it is possible to change the display format of performance data on the page.
-
Choose View then, Grid to remove the grid display format from the charts.
-
Click the Table View link to display the performance data in table format.
-
-
It is possible to overlay an additional scheduler service over the current service performance metrics.
-
Choose Overlay and then Another Scheduler Service.
In the Search and Select: Targets window, enter the name of the target and host server and click Go to search for the relevant service.
-
From the search results table, select the relevant service and click Select to choose the scheduler service to overlay.
-
-
Additionally, any of the following actions can be taken.
-
Save the chart set, as described in Save a Chart Set.
-
Reorder the chart set, as described in Reorder Charts.
-
Revert to an old chart set, as described in Revert to an Old Chart Set.
-
Delete a chart set, as described in Delete a Chart Set.
-
5.3.4.2 View Current Activity
The Oracle Enterprise Scheduler Current Activity page displays pending and running requests by user and application.
To view current Oracle Enterprise Scheduler activity:
-
From the Scheduling Service menu, choose Performance, and then Current Activity.
-
It is possible to view pending and running requests by user or application, or workload by work assignment.
-
To view pending and running requests by user, choose View, and then Requests By User.
-
To view pending and running requests by application, choose View, and then Requests By Application.
-
To view workloads by work assignment, choose View, and then Workload By Work Assignment.
-
5.3.4.3 View Historical Reports
The Oracle Enterprise Scheduler Historical Reports page displays completed job requests by user, application and work assignment.
To view historical Oracle Enterprise Scheduler reports:
-
From the Scheduling Service menu, choose Performance, and then Historical Reports.
-
From the View list, choose one of the following report views:
-
Completed Request Statistics By Job Name
-
Completed Request Statistics By User
-
Request Metrics By Work Assignment
-
Completed Request Statistics
-
-
Adjust the filter criteria as required. The filter criteria vary depending on the report view chosen.
Table 5-1 Completed Request Statistics by Job Name
Filter Criterion What to Do... Application
From the list, choose the application whose statistics need to be viewed.
Minimum Run Time
Enter the shortest run time period for jobs whose statistics need to be viewed. Use the text field to enter a number, and select a unit of time from the list: Seconds, Minutes, Hours or Days.
Completed between
Use the calendar icons on either side of the text fields to select a start and end date and time.
Table 5-2 Completed Request Statistics by User
Filter Criterion What to Do... Application
From the list, choose the application whose statistics need to be viewed.
Minimum Total Run Time
Enter the shortest total time period for jobs whose statistics need to be viewed. Use the text field to enter a number, and select a unit of time from the list: Seconds, Minutes, Hours or Days.
Completed between
Use the calendar icons on either side of the text fields to select a start and end date and time.
Table 5-3 Request Metrics By Work Assignment
Filter Criterion What to Do... Application
From the list, choose the application whose statistics need to be viewed.
Completed after
Use the calendar icon to choose the date and time after which the work assignment has completed.
Table 5-4 Completed Request Statistics
Filter Criterion What to Do... Application
From the list, choose the application whose statistics need to be viewed.
Completed between
Use the calendar icons on either side of the text fields to choose a start and end date and time.
-
Click Go to search for and display the historical data.
5.3.4.4 View Metrics
It is possible to view performance metrics for specific components of Oracle Enterprise Scheduler. Each set of metrics displays performance data that is relevant to the component.
To view Oracle Enterprise Scheduler performance metrics:
-
From the Scheduling Service menu, choose Performance, and then Service Summary.
-
Click Key Performance Indicators.
-
Click Show Metric Palette and select the metrics that need to be displayed for each component.
5.3.4.5 Manage Chart Sets
The chart set displayed can be saved or deleted in the Oracle Enterprise Scheduler Performance Summary page. It is also possible to re-organize the order of a chart and revert to an old chart set.
This section contains the following topics:
5.3.4.5.1 Save a Chart Set
The chart set displayed can be saved in the Oracle Enterprise Scheduler Performance Summary page. Saving a chart set allows preserving a specific set of metrics selected for display, as opposed to the default metrics.
To save a chart set complete the following steps:
-
Display the Oracle Enterprise Scheduler Performance Summary page.
-
Choose View, and then Save Chart Set.
-
In the Save Chart Set dialog box, enter a name for the chart set and click OK.
-
When the chart set have been saved, it is possible to display it by choosing Chart Set, and then My Chart Set.
5.3.4.5.2 Delete a Chart Set
Saved chart set files created in the Oracle Enterprise Scheduler Performance Summary page can be deleted.
To delete a chart set complete the following steps:
-
Display the Oracle Enterprise Scheduler Performance Summary page.
-
Choose View, and then Delete Chart Sets.
-
In the Delete Chart Sets dialog box, select the name of the chart set to be deleted and click OK.
5.3.4.5.3 Reorder Charts
The display of performance charts can be organized in the Oracle Enterprise Scheduler Performance Summary page. Charts can be moved up or down, or removed entirely.
To reorder chart sets complete the following steps:
-
Display the Oracle Enterprise Scheduler Performance Summary page.
-
Choose View, and then Reorder Charts.
-
In the Reorder Charts popup window, select the chart to be moved and click Move Up or Move Down, respectively.
To delete a chart from the Performance Summary page, select the chart and click Delete.
-
Click OK.
5.3.4.5.4 Revert to an Old Chart Set
If the chart sets have been re-organized, it is possible to revert to the chart set as it was originally saved.
To revert chart sets complete the following steps:
-
Display the Oracle Enterprise Scheduler Performance Summary page.
-
From the Chart Set list, choose the chart to be reverted to its original display.
-
Choose View, and then Revert Chart Set.
5.3.4.6 Select the Performance Time Period
In the Oracle Enterprise Scheduler Performance Summary page, the time period for which the performance summary displays can be changed.
To select the performance time period complete the following steps:
-
Display the Oracle Enterprise Scheduler Performance Summary page.
-
Change the duration for which job requests display.
-
All: Click to display all job requests within a specified, finite period.
-
2 hours: Click to display all job requests within the past two hours.
-
15 minutes: Click to display all job requests within the past fifteen minutes.
-
Slider: Click to display a slider that enables scrolling horizontally to show job requests from a specified period. The slider defaults to whichever time segment is selected, all, 2 hours, or 15 minutes.
-
Calendar: Click the calendar icon to select a time period for which job requests want to be displayed.
-
5.4 Check Metrics and Change Metric Thresholds
When Oracle Fusion Applications are installed and provisioned, a variety of pre-configured monitoring templates are installed as well. These templates simplify the task of monitoring large numbers of targets, as metric thresholds are defined once and applied as needed. The pre-configured metrics can be accessed at the mid-tier level, or at the instance/family/product levels. It is also possible to create custom monitoring templates if needed.
5.4.1 Use Metrics at the Mid-Tier Level with Monitoring Templates
The metric-collection settings that were pre-defined can be reviewed, those settings can be edited, or new templates can be created as desired.
5.4.1.1 Access Mid-Tier Metrics
The mid-tier templates (for SOA, WebLogic Server, and so on) are accessed from the Middleware Targets menu, not the Fusion Applications Targets menu.
To access the mid-tier templates, complete the following steps:
-
From the Targets menu, select Middleware.
-
From the Enterprise drop-down in the left corner, select Monitor, and then Monitoring Templates.
-
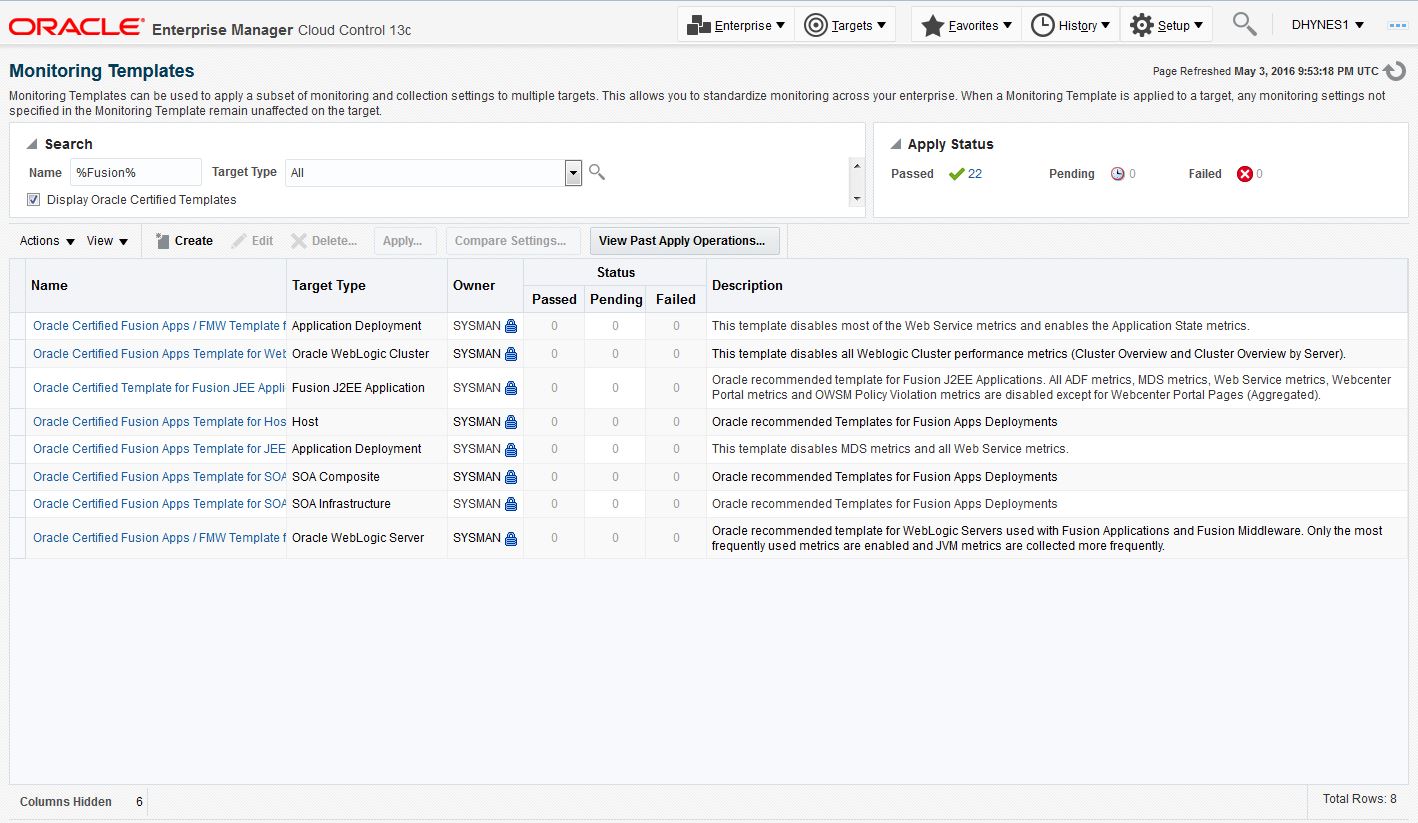
In the resulting search pane, type %Fusion% and check the Display Oracle Certified Templates box. Click the magnifying glass to launch the search. The resulting templates will be listed below the search pane.
Figure 5-18 Mid-tier Monitoring Templates
5.4.1.2 Edit Metrics Manually
After accessing the list of mid-tier monitoring templates (Access Mid-Tier Metrics), the settings can be reviewed and/or edited by performing the following steps:
-
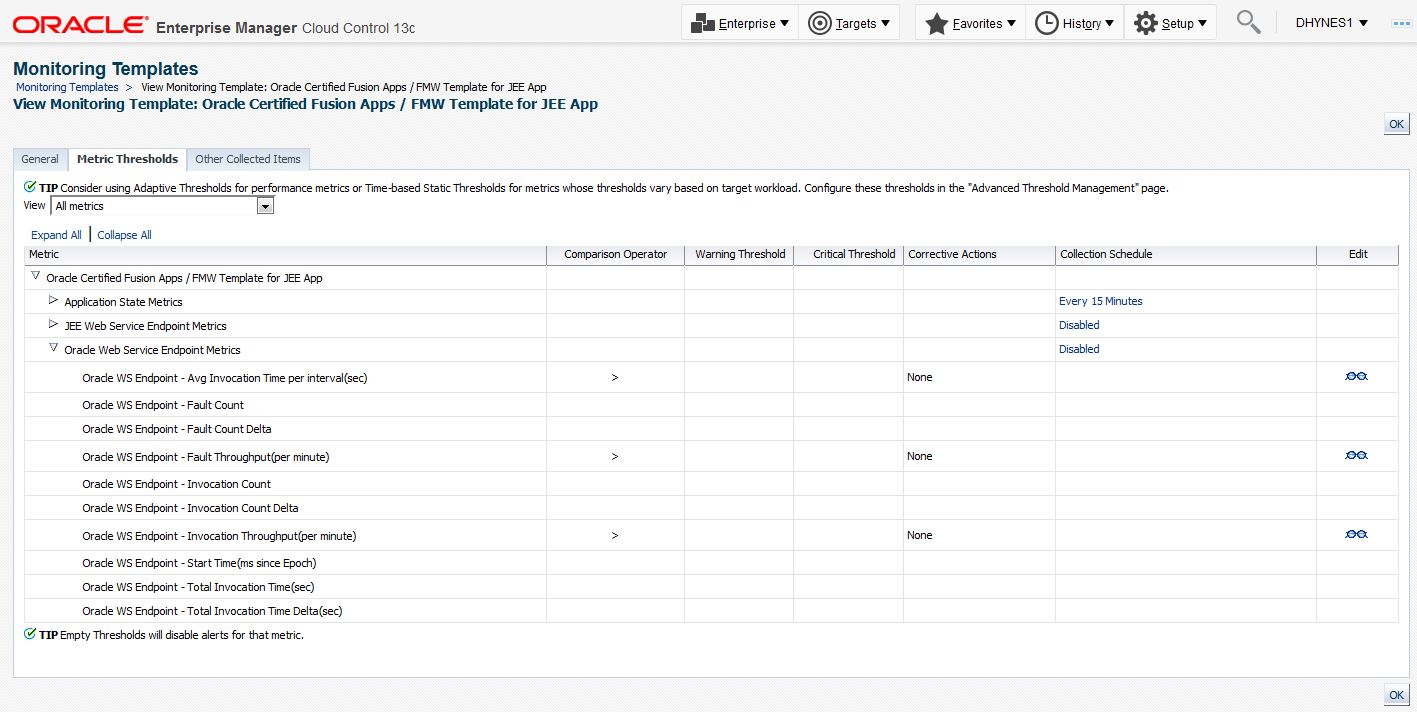
Select a template name from the list (for example: the Oracle Certified Fusion Apps / FMW Template for WebLogic Server).
-
Select the Metrics Thresholds tab at the top of the page. Notice that only a few of the many metrics have been enabled with time limits and/or thresholds.
-
Optionally: Click Edit to change thresholds, enable or disable options, and click OK.
Figure 5-19 View Monitoring Template Page
5.4.1.3 Create Mid-Tier Monitoring Templates
To create a monitoring template from Cloud Control complete the following steps:
-
Search for existing templates as described in Access Mid-Tier Metrics.
-
Click Create.
-
In the Metric Threshold tab, select the metrics to add to the template.
Use the tables in Troubleshoot the Oracle Fusion Applications Tier Performance for reference:
5.4.2 Use Metrics at the Instance, Product Family, and Product Levels
The metrics pages can be accessed at the Instance, Product Family, or Product levels from within those drop-down menus, rather than from the Enterprise drop-down menu. This example uses the Product Family level.
-
Access a Product Family, such as the Oracle Fusion Financials and Supply Chain Management, as described in Access the Product Family and Product Home Pages.
-
From the Product Family drop-down menu, select Monitoring, and then Metric and Collection Settings.
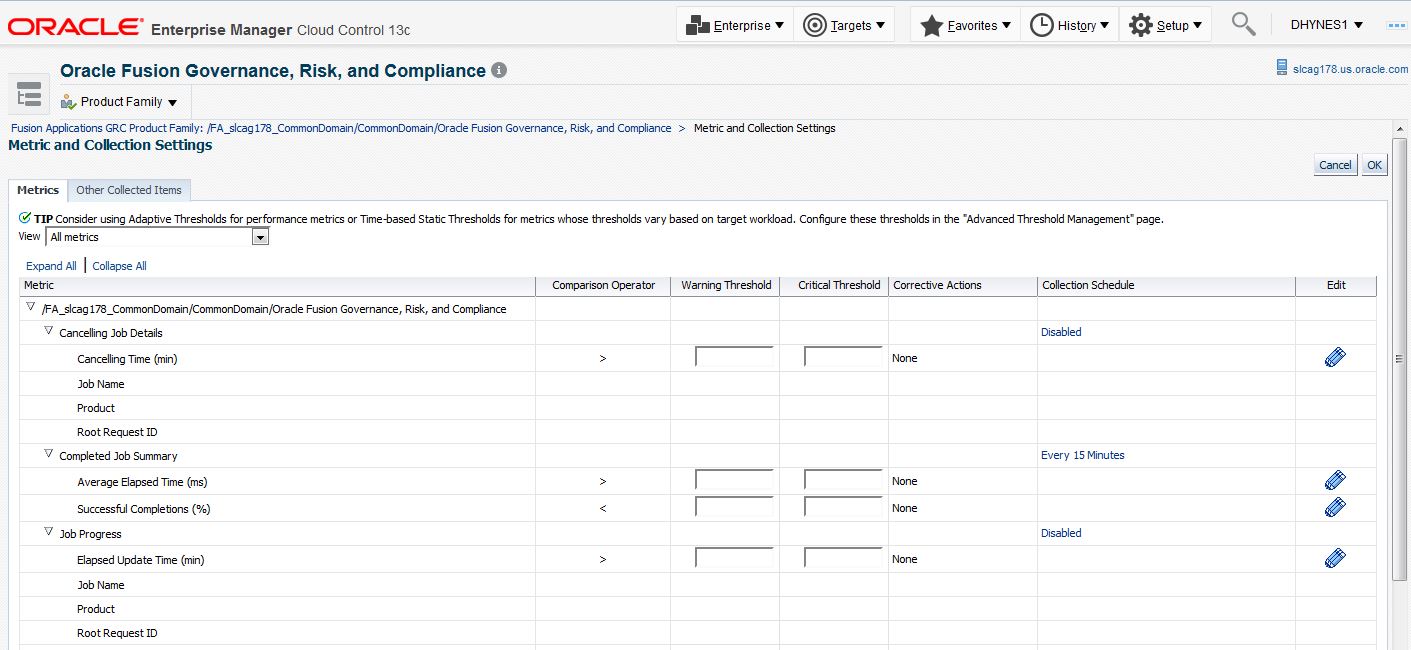
Figure 5-20 Metric and Collection Settings Page
-
Review the Collection Schedule and Thresholds.
-
If desired, change the settings:
-
Enter Threshold levels in the relevant boxes and click OK to enter new values.
-
Select a Collection Settings link to edit the timing, use of metric data, and to enable/disable Data Collection.
-
Click the Edit symbol beside a setting to edit the Alert message.
-
Click OK when complete.
-
5.5 Set Up Notifications and Incident Rules
Cloud Control generates a range of alerts.
See section Using Notifications in the Oracle Enterprise Manager Cloud Control Administrator's Guide to complete the configuration.
5.6 Start and Stop Components
This section describes starting and stopping cluster components. Note that for Fusion Applications, it is often advisable simply to use the fastartstop utility to bring components up and down. See Start and Stop an Oracle Fusion Applications Environment.
5.6.1 Start and Stop an Individual Application Instance for a Cluster Using Cloud Control
To start or stop an application using Cloud Control:
-
Navigate to a product family home page:
-
From the Targets menu, choose Fusion Applications.
The Fusion Applications target home page displays.
-
In the table on the Fusion Applications target home page, click the appropriate Product Family target.
-
-
From the navigation pane, expand the product family and Fusion Applications, and then the cluster application.
-
Select the application instance you want to start or stop.
-
From the Fusion J2EE Application menu, choose Control, and then Start Up or Shut Down.
If preferred, the WebLogic Server Administration Console can be used, see sections Start applications and modules and Stop applications and modules in the Oracle WebLogic Server Administration Console Online Help.
5.6.2 Start and Stop all Application Instances for a Cluster Using Cloud Control
To start or stop all the application instances in a cluster using Cloud Control:
-
Navigate to a product family home page:
-
From the Targets menu, choose Fusion Applications.
The Fusion Applications target home page displays.
-
In the table on the Fusion Applications target home page, click the appropriate Product Family target.
-
-
From the navigation pane, expand the product family and Fusion Applications, and then the cluster application.
-
From the Fusion Cluster Application menu, choose Control, and then Start Up or Shut Down.
5.7 Use Blackouts
-
Blackouts make possible to suspend collection of metrics on a target when performing scheduled maintenance on the target
-
Blacking out a target suspends monitoring on the target for the duration of the blackout
-
Blackouts are named entities that mainly consist of a list of targets that participate in the blackout and the schedule that defines when the blackout is in effect
-
Blackouts may be defined on a single target or on aggregate targets such as groups, hosts, systems, or web applications
To create a blackout from Cloud Control:
-
From the Enterprise menu, choose Monitoring, and then Blackouts to access the Blackouts main page.
-
From the table, click Create.
Cloud Control displays a wizard page that goes through the steps required to create a blackout. Click Help from any wizard page for more information on specific steps, or see the Using Blackouts and Notification Blackouts section in the Enterprise Manager Cloud Control Administrator's Guide.
5.8 Implement Compliance Rules
Oracle has established an array of configuration details that optimize the performance and handling of Oracle Fusion Applications, and now delivers seeded compliance rules with Cloud Control 13c. “Compliance" means having a system adhere to, or comply with, such performance standards. This section explains how compliance Rules are defined, and how they are organized (into Standards and Frameworks). It explains how to associate the Standards to theOracle Fusion Applications instance, how to create, edit, or delete configurations if desired, and how subsequently to monitor and respond to the results in Cloud Control.
5.8.1 Understand Rules, Standards, and Frameworks
Compliance is implemented as a hierarchy, wherein configuration details—such as cache sizes, connection time-outs, and more—are codified into individual Rules. The Rules are collected into logical groups called Standards, which are further organized into a Framework.
Out of the box, the predefined compliance Standards can be associated to the own installation. Each of these components—Rules, Standards, and Frameworks—can also be created, edited, or deleted by an Oracle Fusion Applications administrator who has the appropriate privileges. It is possible to freely mix-and-match custom Rules or Standards with predefined ones.
5.8.1.1 Real-Time Monitoring Facets
It is also possible to create “real-time monitoring facets" if security warnings associated with particular files on the system need to be created. Facets, which can be associated with multiple Rules, define particular entities that should be monitored on an ongoing basis. Only critical files should be chosen, to avoid excess CPU load and data generation.
5.8.2 Prerequisites and Related Documentation
It is necessary to have the Oracle Fusion Applications plug-in for Oracle Enterprise Manager Cloud Control 12c, version 12.1.0.5 or above, installed and configured.
There are two additional guides that contain how-to steps on using the Compliance interface. This guide gives specific cross-references to them when needed. These guides are:
-
Configuration, Compliance, and Change Management sections in the Oracle Enterprise Manager Lifecycle Management Administrator’s Guide
-
All of the Oracle Enterprise Manager Cloud Control Oracle Database Compliance Standards Guide
5.8.3 Implement Compliance
This section explains how to access and implement the Compliance components for Oracle Fusion Applications.
5.8.3.1 Understand the Rules, Standards, and Framework in the Compliance Library
The Compliance components are created, edited, and stored in the Compliance Library.
5.8.3.1.1 Access the Compliance Library
To access the Compliance Library, perform the following steps:
-
Log in to the Cloud Control Console.
-
Select Enterprise, Compliance and then Library.
Figure 5-21 Expansion of Enterprise Tab
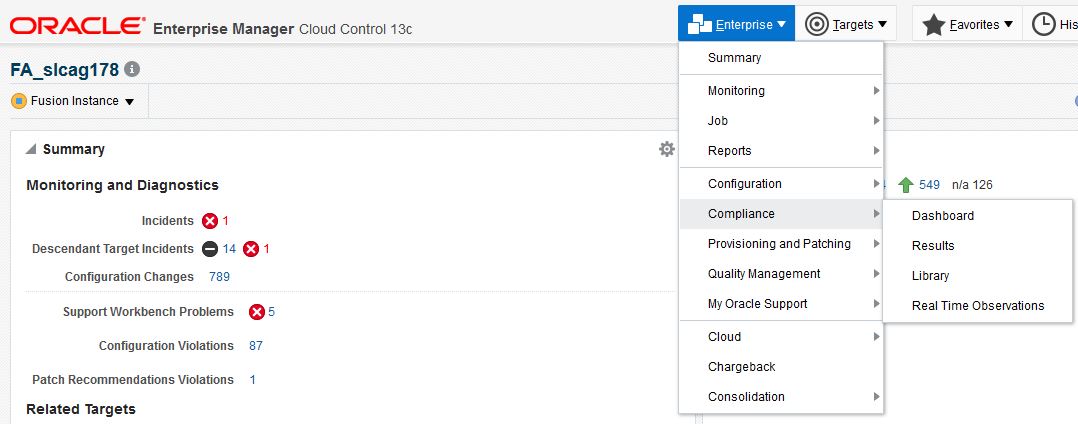
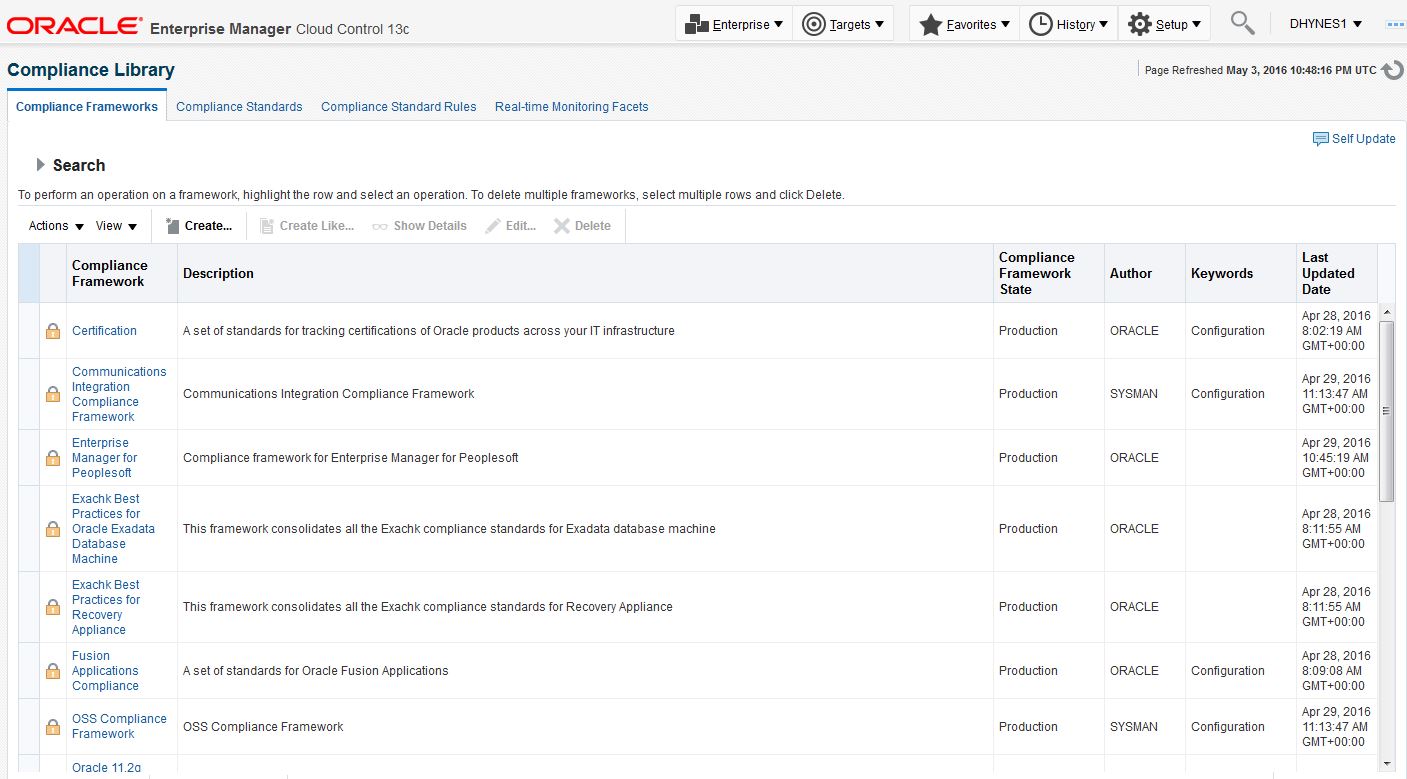
The Compliance Library home page is displayed.
Figure 5-22 Compliance Library Home Page
-
Select the relevant tab for the Compliance component to be used.
5.8.3.1.2 View the System Defined Rules for Oracle Fusion Applications
To find the Rules delivered for Oracle Fusion Applications, complete the following steps:
-
Access the Compliance Library.
-
Select the Compliance Standard Rules tab.
-
Set the System-Defined dropdown to YES.
-
Expand the Search item at the top left of the page, and select Applicable To: Fusion Instance in the Search drop-down.
The defined Rules for Oracle Fusion Applications are listed in the table.
-
To adjust the columns seen, click View, and then Columns. It is possible to select/deselect items to include in the overview. Selecting Manage Columns has the same effect.
-
Follow the same steps to search for the Oracle Fusion Applications-specific Standards or Frameworks.
The 42 defined Rules are organized in four separate Standards. This section describes the primary details of the Rules delivered in:
All the compliance Rules for Oracle Fusion Applications currently share the following attributes:
Type: Repository Rule
Compliance Rule State: Production
Severity: Minor warning
Description: Fusion Applications Configuration Rule for <Rule name>.
Rationale: <Rule name>
Table 5-5 Java Platform Security Compliance Standard
| Compliance Standard Rule Name | Recommended Value |
|---|---|
|
JPS_jps.authz |
ACC |
|
JPS_jps.combiner.lazyeval |
TRUE |
|
JPS_jps.combiner.optimize |
TRUE |
|
Java Platform Security permission cache size |
1000 |
|
Java Platform Security permission cache strategy |
PERMISSION_FIFO |
|
Java Platform Security Enable Policy Lazy Load Property |
TRUE |
|
JPS_jps.policystore.hybrid.mode |
FALSE |
|
Java Platform Security rolemember cache size |
1000 |
|
Java Platform Security rolemember cache strategy |
FIFO |
|
Java Platform Security rolemember cache type |
'STATIC |
|
Java Platform Security Refresh Purge Time Out |
1296000000 |
Table 5-6 Oracle HTTP Server Configuration Standard
| Compliance Standard Rule Name | Recommended Value |
|---|---|
|
Oracle HTTP Server keep alive timeout |
61 |
|
Oracle HTTP Server maximum clients |
1000 |
|
Oracle HTTP Server maximum keep alive requests |
0 |
|
Oracle HTTP Server server limit |
20 |
|
Fusion Applications Configuration rule for Oracle HTTP Server StartServers |
10 |
|
Oracle HTTP Server threads per child |
50 |
|
Oracle HTTP Server WLIOTimeoutSecs |
900 |
|
Oracle HTTP Server Conn Retry Seconds |
1 |
|
Oracle HTTP Server Custom Log |
Enabled |
|
Oracle HTTP Server File caching |
OFF |
|
Oracle HTTP Server Max Spare Threads |
800 |
|
Oracle HTTP Server Min Spare Threads |
200 |
|
Oracle HTTP Server Thread Limit |
250 |
|
Oracle HTTP Server Browser caching |
Enabled |
|
OHS Set Env If No Case |
'Request_URI \.swf$ no-gzip don't-vary' |
|
Oracle HTTP Server Lock File |
http_lock |
|
Oracle HTTP Server StartServers |
10 |
Table 5-7 WebLogic Server Configuration Standard
| Compliance Standard Rule Name | Recommended Value |
|---|---|
|
WebLogic Domain Log Severity |
Error |
|
WebLogic Log File Severity |
Warning |
|
WebLogic Memory Buffer Severity |
Error |
|
WebLogic stdout Severity |
Error |
|
WebLogic Keep Alive Enabled |
TRUE |
|
WebLogic Domain Cache Size |
102400 |
|
WebLogic Domain Capacity Increment |
1 |
|
WebLogic Domain Cache TTL |
600 |
|
WebLogic Domain Conn. Creation Retry Frequency Seconds |
60 |
|
WebLogic Domain Elf Fields |
'date time time-taken bytes cs-method cs-uri sc-status sc(X-ORACLE-DMS-ECID) cs(ECID-Context) cs(Proxy-Remote-User) cs(Proxy-Client-IP)' |
|
WebLogic Domain File Name |
'logs/access.log.%yyyyMMdd%' |
|
WebLogic Domain Highest Num Waiters |
2147483647 |
|
WebLogic Domain Ignore In Use Connections Enabled |
TRUE |
|
WebLogic Domain Max Group Hierarchies In Cache |
15000 |
|
WebLogic Domain Log File Format |
Extended |
|
WebLogic Domain Login Delay Seconds |
0 |
|
WebLogic Domain Pinned To Thread |
FALSE |
|
WebLogic Domain Statement Cache Size |
5 |
|
WebLogic Domain Statement Timeout |
-1 |
|
WebLogic Domain Test Table Name |
SQL SELECT 1 FROM DUAL |
|
WebLogic Domain Test Frequency Seconds |
300 |
|
WebLogic Domain Test Connections On Reserve |
TRUE |
|
WebLogic Domain Enable Group Membership Lookup Hierarchy Caching |
TRUE |
|
WebLogic Domain Second To Trust An Idle Conn. |
0 |
|
WebLogic Domain Initial Capacity |
0' |
|
WebLogic Domain Min Capacity |
0' |
|
WebLogic Domain Max Capacity |
100 |
|
WebLogic Domain Inactive Conn. Timeout Seconds |
0 |
|
WebLogic Domain Init SQL |
SQL SELECT 1 FROM DUAL' |
|
WebLogic Domain State Check Interval |
1000 |
Table 5-8 Java Virtual Machine Configuration Standard
| Compliance Standard Rule Name | Recommended Value |
|---|---|
|
JVM_HTTPClient.socket.connectionTimeout |
300000 |
|
JVM_HTTPClient.socket.readTimeout |
300000 |
|
JVM_HeapDumpOnOutOfMemoryError |
+HeapDumpOnOutOfMemoryError |
|
JVM_VOMaxFetchSize |
N/A |
|
JVM_Xgc |
genpar |
|
JVM_Xmanagement |
1 |
|
JVM_Xverbose |
gc |
|
JVM_jbo.ampool.minavailablesize |
1 |
|
JVM_jbo.ampool.timetolive |
-1 |
|
JVM_jbo.doconnectionpooling |
TRUE |
|
JVM_jbo.load.components.lazily |
TRUE |
|
JVM_jbo.max.cursors |
5 |
|
JVM_jbo.recyclethreshold |
75 |
|
JVM_jbo.txn.disconnect_level |
1 |
|
JVM_jps.auth.debug |
FALSE |
|
JVM_jrockit |
jrockit |
|
JVM_weblogic.ProductionModeEnabled |
TRUE |
|
JVM_weblogic.SocketReaders |
3 |
|
JVM_weblogic.http.client.weblogic.http.client.defaultConnectTimeout |
300000 |
|
JVM_weblogic.http.client.defaultReadTimeout |
300000 |
|
JVM_weblogic.security.providers.authentication.LDAPDelegatePoolSize |
20 |
Table 5-9 Oracle Business Intelligence Configuration Standard
| Compliance Standard Rule Name | Recommended Value |
|---|---|
|
BI Presentation Service Client Session Expire Minutes |
210 |
|
BI Server DB Gateway Thread Range |
40-200 |
|
BI Server DB Gateway Thread Stack Size |
0 |
|
BI Server Enable |
YES |
|
BI Server Init Block Cache Entries |
20 |
|
BI Server Max Cache Entries |
1000 |
|
BI Server Max cache Entry Size |
20 MB |
|
BI Server Max Drilldown Query Cache Entries |
1024 |
|
BI Server Max Expanded Subquery Predicates |
8192 |
|
BI Server Max Query Plan Cache Entries |
1024 |
|
BI Server Max Request Per Session Limit |
5000 |
|
BI Server Max Session Limit |
2000 |
|
BI Presentation Service New Sync Logon Wait Seconds |
60 |
|
BI Server Read Only Mode |
NO |
|
BI Server Thread Range |
40-1000 |
|
BI Server Thread Stack Size |
0 |
|
BI Presentation Service Path Job Log |
'saw.mktgsqlsubsystem.joblog' |
|
BI Presentation Service Path Saw |
saw |
|
BI Server FMW Sec.Max No. Of Connections |
2000 |
|
BI Presentation Service Max Queue |
N/A |
|
BI Presentation Service Max Queue |
N/A |
5.8.3.2 Apply Standards to Targets in the Fusion Instance
To associate the compliance Rules on the Oracle Fusion Applications instance, it is necessary to apply the relevant Standards to the relevant targets.
To associate predefined Standards to targets, complete the following steps:
-
Navigate to Enterprise select Compliance, then choose Library and then select the Compliance Standards tab.
-
Expand the Search item at the top of the page and select Applicable To: Fusion Instance. Click Search.
The predefined Standards are listed.
-
Select a Standard and click Associate Targets.
-
On the Target Association page, click Add. A search page is displayed.
-
Select the relevant target name(s) from the list and click Select.
The host(s) appear in the Target Association page.
-
Select the host(s) and click Enable.
-
Click OK.
-
On the Save Association window that appears, click YES.
After a Compliance Standard is associated to a specific target, the results can be seen almost immediately in the Compliance Results page.
5.8.3.2.1 Create, Edit, or Delete Compliance Details
Rules, Standards, and Frameworks can all be created, edited, or deleted as desired. To do so requires having the correct user permissions. Thereafter, it is a simple matter to click the appropriate button (such as Create) and fill out the subsequent page.
For information on compliance user permissions and how to create, edit, or delete, see the following topics in the Oracle Enterprise Manager Lifecycle Management Administrator's Guide:
-
Privileges and Roles Needed to Use the Compliance Features
-
Operations on Compliance Frameworks
-
Operations on Compliance Standards
-
Operations on Compliance Standards Rules
5.8.3.2.2 Create Real-Time Monitoring Facets
Real-time monitoring facets allow an administrator to receive warnings that are generated on-the-fly, should certain sensitive files be accessed or changed. This is especially useful as a security alert in case of any potential unauthorized activity to important parts of the system.
There are no real-time monitoring facets delivered with Cloud Control 12c, version 12.1.0.5, for Oracle Fusion Applications. To create customized monitoring facets and apply them to the system, see section Real-Time Monitoring Facets in Managing Compliance of Oracle Enterprise Manager Lifecycle Management Administrator's Guide.
5.9 Monitor Product Families and Products
The product family and product home pages make possible to monitor various aspects of the servers and applications.
The main steps in monitoring product families and products are as follows:
-
Verify component status.
-
View and modify performance metrics.
-
Monitor the status of any scheduled jobs.
To monitor a product family or product in Fusion Applications Control or Cloud Control:
-
Navigate to the product family home page or alternatively, navigate to the product home page:
-
Open Cloud Control:
-
From the Targets menu, choose Fusion Applications.
The Fusion Applications list page is displayed.
-
In the table on the Fusion Applications page, click the Fusion Instance whose overview page needs to be displayed.
The Fusion Instance page is displayed.
-
In the Fusion Instance overview page, expand the Fusion instance and click the name of the product family.
But if this process started from the product home page,
-
In the Fusion Instance overview page, expand the Fusion instance and the product family. Click the name of the product whose home page needs to be displayed.
-
-
-
Use the following sections on the main product family or product page to verify the status of various components.
-
Applications and Infrastructure: Verify the availability of Fusion Applications and Oracle Fusion Middleware.
-
Topology: View the complete topology of the product or product family. Click a node to view the home page of the selected component.
-
Fusion Applications: Verify the status of Fusion cluster applications, Fusion applications and the relationship between domain and server.
-
Servers: Verify the status of Fusion cluster applications and all related servers.
-
-
In the Key Performance Indicators section, view the product or product family main performance metrics. Click the View Actions menu to perform any of the following tasks.
-
Modifying performance metrics: The performance metrics can be viewed and modified in this section by clicking the View Actions menu in the section and selecting Select Metrics.
The Select Metrics popup window is displayed.
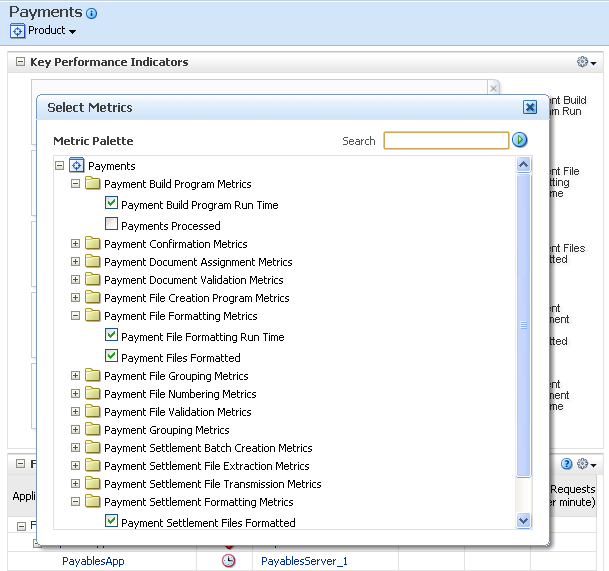
In the Select Metrics dialog, a particular metric can be searched for in the Search field and select or remove the desired metrics to be displayed or hide in the Key Performance Indicators section.
For more information about monitoring and modifying performance metrics, see Monitor Business Performance Metrics for a Product Family.
-
Saving charts: metric charts can be saved to a file by selecting View Actions, and then Save charts.
-
Restoring default charts: it is possible to restore the metric charts to their defaults such that only the default metrics display, by selecting View Actions, and then Restore default charts.
-
-
Monitor the status of any scheduled jobs by using the Oracle Enterprise Scheduler sections described. More scheduled jobs displayed can be viewed in these sections by clicking Show All at the bottom of each section.
Clicking Show All displays the Oracle Enterprise Scheduler section in a larger pane such that a larger number of relevant jobs display.
5.10 Monitor Business Performance Metrics for a Product Family
The Key Performance Indicators page displays an overview of the performance metrics of a given product family. Typically, several default metrics display on the page in the form of graphs. Multiple metrics are tracked, and these can be added to the Key Performance Indicators page. Each product belonging to a given product family has its own set of metrics.
The Key Performance Indicators page can be modified as follows:
-
Add or remove metrics from the page.
-
Display performance data in tabular format.
-
Save or delete a set of performance charts.
-
Reorganize the display of charts, for example move charts up or down.
-
Display the performance metrics of another instance of the product on top of the current chart sets, or display earlier metrics of the same product instance on top of current metrics.
-
Toggle on or off the grid display on the performance chart set.
-
Modify the performance time period.
To view and modify a product family's business performance summary page in Fusion Applications Control or Cloud Control:
-
Navigate to the product family home page.
-
Open Cloud Control:
-
From the Targets menu, choose Fusion Applications.
The Fusion Applications list page is displayed.
-
In the table on the Fusion Applications list page, click the product family.
-
-
-
Display the Key Performance Indicators page.
-
In Cloud Control: From the Product Family menu, select Monitoring and then select Key Performance Indicators.
The product family home page is displayed. The key metrics can be viewed for the product family in the Key Performance Indicators page.
-
-
Display the metrics pane by clicking Show Metric Palette.
The metrics that display on the Key Performance Indicators pane can be modified.
In the Metrics Palette, select the desired metrics to be displayed in the Key Performance Indicators pane.
-
In the Metrics Palette Search field, is possible to search for a particular metric by entering the name of the metric that is being searched for and clicking the Search button.
-
To change the order in which metrics display on the Key Performance Indicators pane, or delete a metric from the display.
-
Click the bar to the left of the metric name and drag the metric up or down.
-
Click the Close button on the upper right corner of the metric to delete it from the display.
-
-
To display more information about a metric, click on the metric name.
The Additional Information dialog is displayed. From this dialog, more details about the metric can be viewed using the following links:
-
Problem Analysis: Directs to the Problem Analysis page. This page makes possible to to see a metric with other related metrics, which are affecting the metrics being analyzed. It also shows the related targets and the related targets topology. The Problem Analysis is only available for request-related metrics, such as the Request Processing Time (ms) and Request (per minute).
-
Analyze Logs: Displays a message that makes possible to to view the logs for a target on which the metric is viewed.
-
Metric Details: Makes possible to view historical metric data.
-
Target Home: Goes to the home page.
When used together, Problem Analysis and Analyze Logs can help to inspect metrics, target status information, and logs during troubleshooting. These links are not available for all metrics.
-
5.11 Monitor Business Performance Metrics for a Product
The Performance Summary page displays an overview of the performance metrics for a given product. Typically, several default metrics display on the page in the form of graphs. Multiple metrics are tracked, and these can be added to the Performance Summary page. Each product belonging to a given product family has its own set of metrics.
The performance page can be modified as follows:
-
Add or remove metrics from the page.
-
Display performance data in tabular format.
-
Save or delete a set of performance charts.
-
Reorganize the display of charts, for example move charts up or down.
-
Display the performance metrics of another product family on top of the current chart sets, or display earlier metrics of the same product family on top of current metrics.
-
Toggle on or off the grid display on the performance chart set.
-
Modify the performance time period.
To view and modify a product's business performance summary page in Cloud Control:
-
Navigate to the product home page.
-
Open Cloud Control:
-
From the Targets menu, choose Fusion Applications.
The Fusion Applications list page is displayed.
-
In the table on the Fusion Applications list page, expand a product family and click an individual product.
-
-
-
Display the Key Performance Indicators page.
-
In Cloud Control: From the Product menu, choose Monitoring and then select Key Performance Indicators.
The product family home page is displayed. The key metrics for the product family can be viewed in the Key Performance Indicators page.
-
-
Display the metrics pane by clicking Show Metric Palette.
The metrics that display on the Key Performance Indicators pane can be modified.
In the Metrics Palette, select the desired metrics to be displayed in the Key Performance Indicators pane.
-
In the Metrics Palette Search field, is possible to search for a particular metric by entering the name of the metric that is being searched for and clicking the Search button.
-
To change the order in which metrics display on the Key Performance Indicators pane, or delete a metric from the display.
-
Click the bar to the left of the metric name and drag the metric up or down.
-
Click the Close button on the upper right corner of the metric to delete it from the display.
-
-
To display more information about a metric, click on the metric name.
The Additional Information dialog is displayed. From this dialog, more details about the metric can be viewed using the following links:
-
Problem Analysis: Directs to the Problem Analysis page. This page makes possible to to see a metric with other related metrics, which are affecting the metrics being analyzed. It also shows the related targets and the related targets topology. The Problem Analysis is only available for request-related metrics, such as the Request Processing Time (ms) and Request (per minute).
-
Analyze Logs: Displays a message that makes possible to to view the logs for a target on which the metric is viewed.
-
Metric Details: Makes possible to view historical metric data.
-
Target Home: Goes to the home page.
When used together, Problem Analysis and Analyze Logs can help to inspect metrics, target status information, and logs during troubleshooting. These links are not available for all metrics.
-
5.12 Manage Disk Usage for Log Files and Diagnostic Test Results
In busy computing environments, the amount of disk space used by log files can become a concern. Large log files can also affect system performance. To manage log file sizes and disk space
5.12.1 Manage Incidents and Flood Control for Fusion Applications:
If a problem recurs frequently without being resolved, multiple incidents and large numbers of log messages may be created, without providing significant new information. The feature that governs whether multiple incidents can be created for the same problem within a particular time period (and, if so, how many) is known as flood control. For information about the default profile option configuration settings for Oracle Fusion Applications incident creation, including settings for flood control, see Table 23-1.
5.12.2 Manage Incidents and Flood Control for Middleware Components
As part of the infrastructure for creating and handling incidents, the Oracle Fusion Middleware Diagnostics Framework includes settings that can be configured to affect functionality areas such as the following:
-
Whether multiple incidents that originate from Java or PL/SQL code can be created for the same problem within a particular time period, and, if so, how many (flood control).
-
The total amount of space allocated for storage of information about incidents that originate from Java or PL/SQL code. (Older incidents are purged automatically when the allocated space limit is reached.)
For more information about these Oracle Fusion Middleware Diagnostic Framework settings, see the Configuring the Diagnostic Framework section in the Administering Oracle Fusion Middleware.
5.12.3 Purge the Results of Selected Diagnostic Tests
From time to time, it would be necessary to remove diagnostic test run results from the database, to keep the Run Status table from becoming too large. For information about deleting diagnostic test results, see Purge the Results of Selected Diagnostic Test Runs.
