Release 9.0
Part Number A92101-01
Home |
Solution Area |
Contents |
Index |
| Oracle9i Reports Building Reports Release 9.0 Part Number A92101-01 |
|
Reports Builder enables you to use any data source you wish. In this chapter, you will learn how to use the XML pluggable data source that is provided with Oracle9i Reports.
The information you must publish is often derived from data in various corporate data sources. These data sources may be SQL-based (relational databases) or non-SQL-based, such as XML, OLAP, and the like. Often, you must combine data from one or more of these data sources to publish meaningful information. For example, you may need to combine data that exists in a relational database with data from a multi-dimensional database to compare trends and performance.
Oracle9i Reports enables you to leverage capabilities, such as aggregation, summarization, formatting, and scheduling, on data from any data source. You can leverage the PDS (pluggable data source) architecture to connect to your own data source, as well as to the data sources available with Oracle9i Reports (XML, JDBC, text, and Express).
For more information on pluggable data sources, refer to the Reports Builder online help and the Javadoc documentation for the PDS APIs.
Suppose you have an international business with warehouses in the United States and overseas. These warehouses are running a de-centralized management system that stores the operational data locally at each site. The inventory of the warehouses are managed by the local managers. However, for planning purposes, a team at corporate headquarters needs to access the inventory data (in SQL), including the most recent data, of every warehouse. The warehouse data is only available as an XML stream. In this example, you will learn how to combine data from a local database (i.e., the warehouse data) and data from an XML feed to create a Web report.
In this example, you will use static XML files that we've provided for you. The report will access the XML feed online using the business-to-business interface of your order entry system.
| Feature | Location |
|---|---|
|
Manually create a SQL query. |
|
|
Use the Data Wizard to create an XML query. |
Section 4.2.2, "Create an XML query to access your XML data source" |
|
Create a data link between a SQL query and an XML query. |
|
|
Use the Report Wizard to create a layout for your report. |
Section 4.2.4, "Create a layout for your report using the Report Wizard" |
|
Use format triggers and procedures to apply alternating row colors. |
Section 4.2.5, "Apply alternating row colors to your report" |
|
Use a group filter to sort your XML data. |
To build the examples in this manual, you must have the example files we've provided and access to the sample schema that comes with the Oracle9i database.
If you haven't already done so, you can download the files you'll need to complete this example from the Oracle Technology network (http://otn.oracle.com/products/reports/) and install them on your machine.
d:\orawin90\examples).
This zip file contains the following files:
If you don't know if you have access to the sample schema provided with the Oracle9i database, contact your database administrator. You should have access to the "Order Entry" portion of the schema to complete this example. Typically, you can log into this schema by using the user ID and password "oe/oe", then enter the name of the database.
When you create a report, you can either use the Report Wizard to assist you or create the report yourself. To build this report, you'll need to create two queries: a SQL query and an XML query.
When creating the SQL query, you'll need access to the Order Entry part of the sample schema provided with the Oracle9i database. If you don't have access, contact your database administrator. Typically, you can log in using the connection string "oe/oe@<database name>".
Your new report displays in the Object Navigator as something like "MODULE 2." You will also see the Data Model view of your new report.
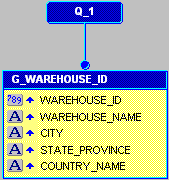
select   W.WAREHOUSE_ID,
         W. WAREHOUSE_NAME,
         L.CITY,
         L.STATE_PROVINCE,
         C.COUNTRY_NAME
from     WAREHOUSES W
         HR.LOCATIONS L
         HR.COUNTRIES C
where    ( W.LOCATION_ID = L.LOCATION_ID(+) )
  and    ( L.COUNTRY_ID = C.COUNTRY_ID(+) )
order by C.COUNTRY_NAME, W.WAREHOUSE_NAME
The data model displays in the Data Model view, and should look something like this
inventoryreport_xml_<your initials>.rdf.
You have created a SQL query to retrieve the data for your report.
In this section, you will create a query to access the XML data source. You can view the resulting report we've provided to make sure your query is correct. Please note, though, that you must update the paths to the Data Definition files with the location of the example files we provided to you.
warehouse_inventory.xsd.
warehouse_inventory.xml.
If you want to compare your data definition to the one we provided, make sure that you replace the data definition locations with the locations of your files.
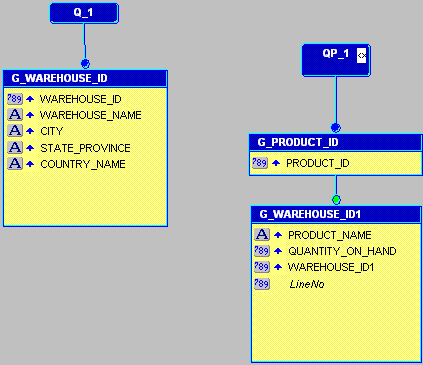
The Data Model view displays your two queries, and should look something like this:
inventoryreport_xml_<your initials>.rdf.
You have created an XML query to access the XML data source we've provided.
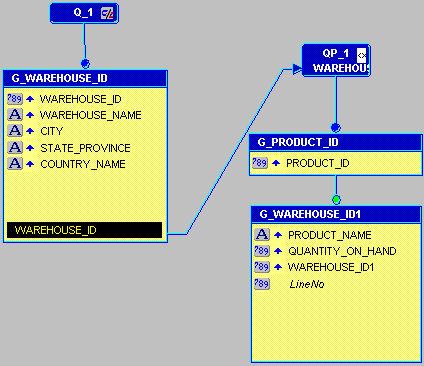
You will now need to link the SQL query and the XML query so that you can access your corporate data as well as the data for each of the local warehouses.
Your data model should now look something like this:
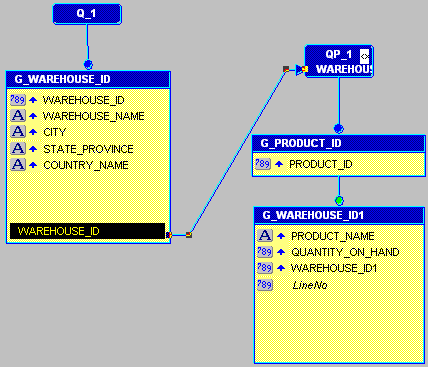
You'll notice that the WAREHOUSE_ID column is now highlighted at the bottom of Q_1, with a line pointing to the WAREHOUSE_ID1 column. You can close the Property Inspector for the link.
inventoryreport_xml_<your initials>.rdf.
You have created a data link between the WAREHOUSE_ID columns in the two queries.
Before you can run any report, you must define a layout. The easiest way to do this is to use the Report Wizard.
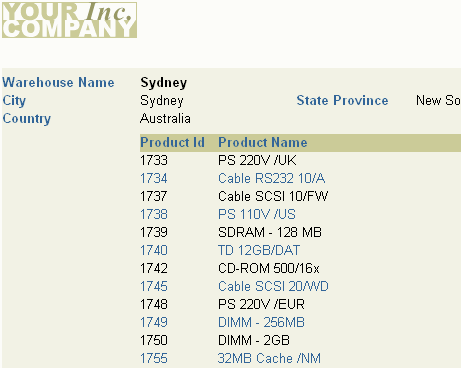
Your report displays in the Paper Design view, and should look something like this:
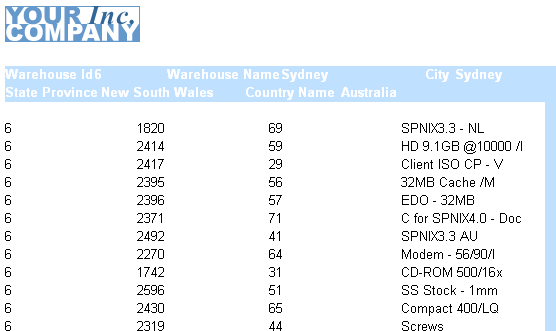
You have created the layout for your paper report.
Now that you've created the report, you can make it more user-friendly by using a summary column to apply alternating row colors.
If you are still in the Paper Design view, you can click the Data Model icon in the tool palette to display the Data Model view.
linecolors.
PROCEDURE LineColors IS
BEGIN
if (:LineNo mod 2 = 0)
then
   srw.set_text_color('TextColor');
else srw.set_text_color('black');
end if;
END;
If any errors display, make sure the code is correct, and that you created the summary column in Section 4.2.5.1, "Create a summary column to count the rows".
function F_PRODUCT_IDformatTrigger return Boolean is
begin
LineColors;
return (TRUE);
end;
You have now applied alternating row colors to your report.
If you have a lot of data in your XML file, you might want to consider sorting and filtering it. You can do so by creating a group filter and a hierarchy.
The PL/SQL Filter property displays.
function G_WAREHOUSE_IDGroupFilter return boolean is
begin
if (:LineNo mod 2 = 0)
  then
    srw.set_background_fill_color('TableCell');
  end if;
  if (:LineNo mod 2 = 1)
  then     srw.set_background_fill_color('Totals');
  end if;
return (TRUE);
end;
Your new data model should look something like this:
You can also run the RDF we've provided (Examples\XML_PDS\source\inventoryreport.rdf) to view the results in Reports Builder.
inventoryreport_xml_<your initials>.rdf.
You have now created a group filter that sorts your XML data.
inventoryreport_xml_<your initials>.rdf) is selected.
Congratulations! You have successfully used an XML data source for a paper report. You now know how to:
For more information on using XML as a data source, refer to Getting Started with Oracle9i Reports or the Reports Builder online help.
|
|
 Copyright © 2002 Oracle Corporation. All Rights Reserved. |
|