| Oracle® Enterprise Service Bus Developer's Guide 10g (10.1.3.3.0) Part Number E10295-01 |
|
|
View PDF |
| Oracle® Enterprise Service Bus Developer's Guide 10g (10.1.3.3.0) Part Number E10295-01 |
|
|
View PDF |
This chapter describes how to use the Oracle ESB Control Instances view to track message instances across the enterprise service bus.
This chapter contains the following topics:
The Instances view enables you to view details about instance processing across an ESB system. It enables you to filter message instances based on any of the following properties:
The service that processed them
The status of the messages (Any, Error, Faulted, Resubmittable)
Tracking name and tracking value (trackable fields)
Instance IDs
The time frame during which the message was processed
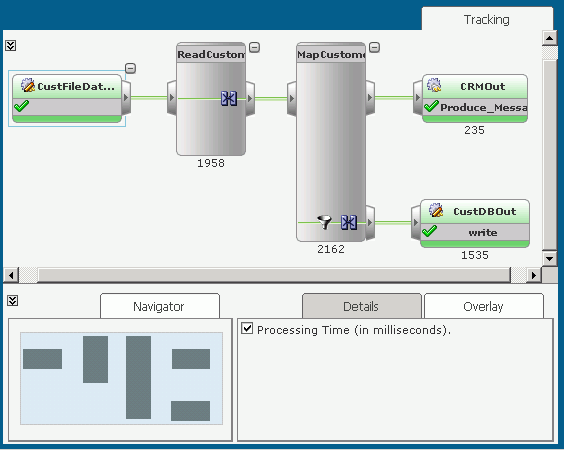
When you select a message instance from the Instances panel (shown in the lower left of Figure 10-1), the message instance's path through the enterprise service bus is presented in the Tracking tab diagram. Within the diagram, services that successfully processed the message instance are represented in green, services where an error occurred are represented in red, and services that were not invoked (or have not yet been invoked) in the processing of the message are represented in gray. If the transaction is rolled back, the service is represented in yellow. You can select a service in the Tracking tab diagram and view the processing details in the Details subtab, shown in the lower right of Figure 10-1.
Figure 10-1 shows that the CRM adapter service (CRMOut) was successfully invoked and that the database adapter service (CustDBOut) was not invoked because a filter expression excluded the message from delivery to the database adapter service.
Figure 10-1 Instances View – Tracking Tab and Details Subtab
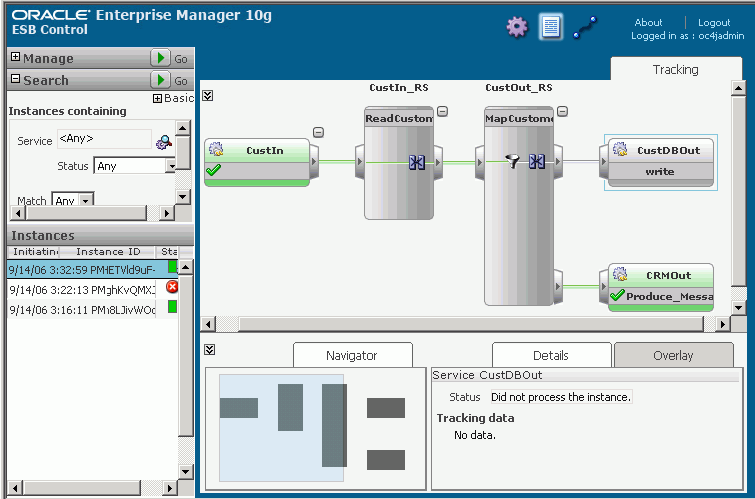
The Instances view of the Oracle ESB Control, as shown in Figure 10-1 is divided into four main regions, as follows:
Manage panel
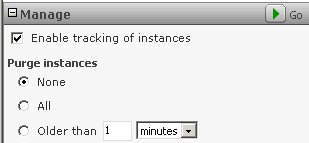
This panel, shown in Figure 10-2, enables you to enable and disable message instance tracking as well as purge the message instances. Note that when instances that are purged, they are lost forever.
The control to the left of the Manage title enables you to open or close this panel; the green arrow icon to the right of the Manage title applies changes you make in this panel.
Figure 10-2 Instances View – Manage Panel
Search panel
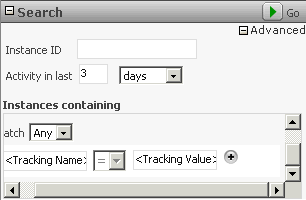
Because the volume of messages processed during that time can be quite large, the Search panel, shown in Figure 10-3, enables you to limit the messages displayed using a variety of filter criterion.
The control to the left of the Search title enables you to open or close this panel; the green arrow icon to the right of the Search title applies changes you make in this panel. The Advanced control toggles to Basic and back; it enables you to show or hide the Instances containing region of this panel.
By default, the Instances panel displays all the messages processed during the past day. If you want to view messages processed prior to the past day, then you need to increase the number of days in the Activity in last field in the Advanced options before searching for messages.
Only the first 100 instances are returned after any search filtering.
Figure 10-3 Instances View – Search Panel
Instances panel
The Instances panel lists the message instances processed or being processed by the ESB services, optionally filtered by search options you select. The maximum number of displayed is 100.
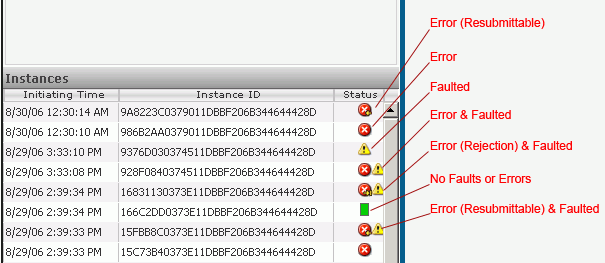
For each message, the time at which each message instance entered the enterprise service bus, instance ID for the message, and the status of that processing is provided. The status is represented by the following color-coded icon(s) in the Status column (shown in Figure 10-4):
Green rectangle - No faults or errors during message processing
Solid red circle overlaid with an X - Error occurred
Yellow triangle overlaid with an exclamation point - Faulted message (the target service returned an application fault)
An error icon plus a faulted icon - Error and faulted
An error icon overlaid with a small yellow left arrow – Error is resubmittable (for asynchronous processing)
An error icon overlaid with a small yellow left arrow plus a faulted icon – Error (resubmittable) and faulted
An error icon overlaid with a small yellow right arrow plus a faulted icon – Error (rejection by inbound adapter) and faulted
Figure 10-4 Instances Panel Showing Status Codes
Tracking Tab (with associated subtabs)
The Tracking tab has a diagram region that provides a schematic of the message processing, as well as Navigator, Details, and Overlay subtabs, as described in the following list:
Schematic
The Tracking tab schematic shows the path the message selected from the Instances panel has taken (or is taking) across the enterprise service bus. If you select a particular service within the Instances panel, that service is enclosed in a dotted grey box, as shown for the service labeled CustOut_RS in Figure 10-1.
If a service has successfully processed the message, that service appears in green, as shown for the service labeled CRMOut in Figure 10-1.
If any service has not processed the selected message because processing is incomplete or due to filter criterion, that service appears in grey, as shown for the service labeled CustDBOut in Figure 10-2.
If an error occurred during processing, the service at which the error occurred is red, as shown in Figure 10-5. A yellow service icon indicates a non-transactional endpoint.
Figure 10-5 Oracle ESB Control – Instances View with Error
Navigator subtab
For complex ESB configurations, the schematic can be quite large and you may not be able to view it in its entirety all at once. The Navigator subtab provides a birds-eye view of the entire schematic. The purple region of the Navigator tab highlights the area of the schematic currently in showing.
Use the scroll bars around the schematic to view areas currently outside the purple shaded region. Click the down-arrow button to the left of the Navigator tab to hide the contents of the subtabs (and thereby increase the available viewing area for the schematic.)
Details subtab
The details subtab provides information about the status of a message with respect to a selected service. Note that a pencil icon on the service designates that the service has been updated since the message instance was processed.
Overlay subtab
The Overlay subtab enables you to view statistics on the messages processed by each service.
Error tab
The Error tab is presented only when you select a service in the Instances panel where an error occurred, as shown in Figure 10-6. The Errors tab contains an error table that lists the time, service:operation, and message associated with each error. Click the Error Details icon in the Message column to view the error message and the stack trace. See Chapter 11, "Error Handling" for information about handling error conditions.
You can view details and statistics of, search for, and delete message instances. You can also enable and disable message instance tracking.
This section discusses the following topics:
Instance tracking is enabled by default. However, for maximum throughput at high volumes, it is recommended that instance tracking is disabled.
Follow these steps to enable or disable message tracking:
At the top of the Oracle ESB Control, click the Instances button if the Instances view is not currently displaying.
Open the Manage panel if it is not already open.
Select or deselect Enable tracking of instances to enable or disable instance tracking, respectively.
In the Manage panel title bar, click the Apply icon (green arrow).
The Details tab, below the schematic in the Oracle ESB Control Instances view, shows the following details about a message instance, as follows:
If you select a service in the Instances panel or the schematic:
Status
This field specifies the status of the message, which can be successful or failed. If a message was processed successfully, but the transaction was rolled back due to some other error, that information is included in the Status field. For example, the status might be: Successful; however, the transaction was rolled back due to an error in CRMOUT:Write.
Activity Time
This field specifies the time at which the message was processed by the service selected in the Instances panel.
Tracking data
If you click the connection between two services in the schematic:
Source
Specifies the service and operation from which the message instance is being sent, in the format source_service::operation.
Target
Specifies the service and operation to which the message instance is being sent, in the format target_service::operation.
Status
Specifies the status of the target service. For example, the status might be one of the following:
Did not process the message.
Not executed as part of the message flow.
Not successful because there was an error during the invocation of the target.
The Overlay tab, below the schematic in the Oracle ESB Control Instances view, enables you to view statistics as overlays on the schematic.
If you enable Processing Time, the schematic shows the time in milliseconds it took for each service within the enterprise service bus to process the message instance, as shown in Figure 10-7.
Figure 10-7 Sample Overlay Statistics in Instances View
If the Instances panel contains too many message instances for you to find the message instances of interest quickly, you can search the messages, as follows:
At the top of the Oracle ESB Control, click the Instances button if the Instances view is not currently displaying.
Open the Search panel, if it is not already open.
Specify the desired search criteria, as described in Table 10-1.
In the Search panel title bar, click the Apply icon (green arrow).
Table 10-1 Specifying Message Instance Search Criteria
| Search Criteria | Description |
|---|---|
|
Instance ID |
To limit the messages to those with a specific instance ID:
Multiple Instance IDs cannot be specified. If an Instance ID is provided as search criteria, other filter conditions are ignored. |
|
Activity in last <time frame> |
To limit the messages to processed in a specific time frame:
|
|
Service |
To limit the messages to those processed by a particular service:
|
|
Status |
To limit the messages to those in a particular status, in the Status field, select one of the following:
|
|
Match |
Specify whether to match Any or All of the criteria in the Tracking Name and Value fields. |
|
Tracking Name and Tracking Value (trackable fields) |
To limit the messages to those which have a particular value in a trackable field or fields:
If you want to delete a trackable field/tracking value pair, click the minus (-) button that appears next to that row. |
By default, no message instances are purged. As a result the list of message instances in the Instances panel can become unwieldy. You can direct the ESB Server to purge all messages or all message instances that occurred outside a specified time range. Instances that are purged are lost forever.
To purge messages:
At the top of the Oracle ESB Control, click the Instances button if the Instances view is not currently displaying.
Open the Manage panel if it is not already open.
Select the frequency with which you want messages purged:
To purge all message instances, under Purge instances, select All.
To purge all message instances that occurred outside a time range, under Purge instances, select Older than and indicate the time range.
In the Manage title bar, click the Apply icon (green arrow).