| Oracle® Retail Demand Forecasting User Guide for the RPAS Fusion Client Release 16.0 E91109-03 |
|

 Previous |
 Next |
| Oracle® Retail Demand Forecasting User Guide for the RPAS Fusion Client Release 16.0 E91109-03 |
|
Previous |
Next |
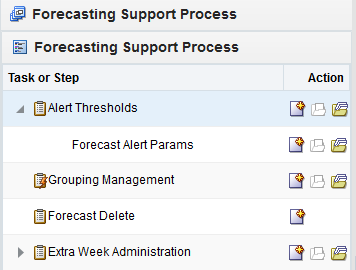
The Alert Thresholds task allows you to manage the thresholds used in the batch and workbook alerts included in RDF. The thresholds can be set at three levels:
Domain level
Intermediate level (lower than all Product in the merchandise hierarchy)
Item/store level (allows threshold values to be overwritten)
The following sections provide the complete list of alerts defined for RDF. Most of the alerts have thresholds that can be adjusted in the Alert Threshold Task. The alerts that do not have any adjustable thresholds defined are still listed, and their calculation expressions are mentioned.
The alert thresholds are available for the baseline as well as causal levels. However, based on the measures in the calculation expressions we specify for which level each alert is most relevant.All alerts are batch alerts, and can be specified in the Forecast Administration workbook as forecast approval alerts. Some of the batch alerts go along with real time alerts, which have similar calculation expressions. The calculations can't be identical, because the batch alerts are at the production/location intersection, while the real time alerts also have the time dimension.
The way the batch and the real time alerts can be used together, is detailed in the following steps. For example purposes, we will use the Current Forecast versus Last Approved Forecast alert, for both batch and real time. However, once we describe each alert, we specify if it has a real time counterpart and the levels for which it is relevant.
First the user selects a batch alert, for instance Forecast versus Last Approved Forecast, to be the choice for the Approval method.
Then the batch is run. After the forecast is generated, it is compared to the last approved forecast. For item/stores for which the two forecasts are different with respect to attached thresholds, the alert is triggered, and the time series is not approved.
Then the batch is run. After the forecast is generated, it is compared to the last approved forecast. For item/stores for which the two forecasts are different with respect to attached thresholds, the alert is triggered, and the time series is not approved.
Once in the workbook, the user can use the batch alert to navigate from time series to time series, or she can use the real time alert to navigate to alerted time periods.
For additional information, refer to the Forecast Administration Workbook.
Usually it is not expected that demand values differ very much from period to period. This also implies that the forecast magnitude generally is in line with the magnitude of the most recent sales. There are exceptions to this case. For instance, when an item enters a season, the forecast is probably higher than the sales in periods leading to the season. Or when an item is towards the end of the season, the forecast will be lower than sales in peak periods. For these exceptions, you can be alerted to review the forecast, rather than automatically approving it.
This alert a batch alert, and can be used for forecast approval.
Alert Expression
Where length, threshold1, and threshold2 are adjustable parameters.
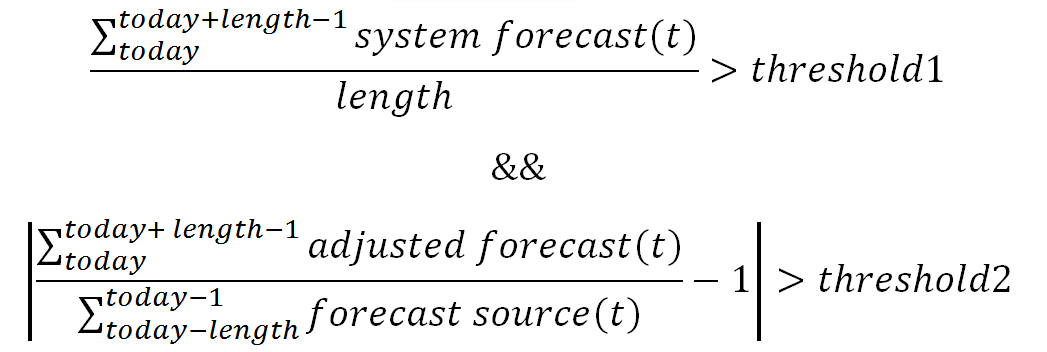
The calculation expression for this alert involves thresholds which can be adjusted in the Alert Thresholds task.Threshold1 allows filtering out time series by rate of sales. For instance, if it is set to 1, the alert expression is only run for time series that sell at least one item per week. The reason is that we don't want the user to be overwhelmed by reviewing item/store/week information for low sellers. Threshold2 defines how different the forecast and the recent sales may be before they get alerted. For instance, if threshold2=0.1, a difference of 10% is considered acceptable, but everything above will trigger the alert, and the time series is not approved.
The alert is mostly relevant for the baseline level. The reason is that there can be large differences in recent sales versus forecast due additional demand coming from past or upcoming promotions.
|
Note: The calculations are not performed for the entire forecast horizon, but rather by the number of periods determined by the length parameter. The reason is that the forecast horizon can sometimes be very long (52 weeks) and average demand over such a long time period can not be used as in-season versus out of season rate of sales. |
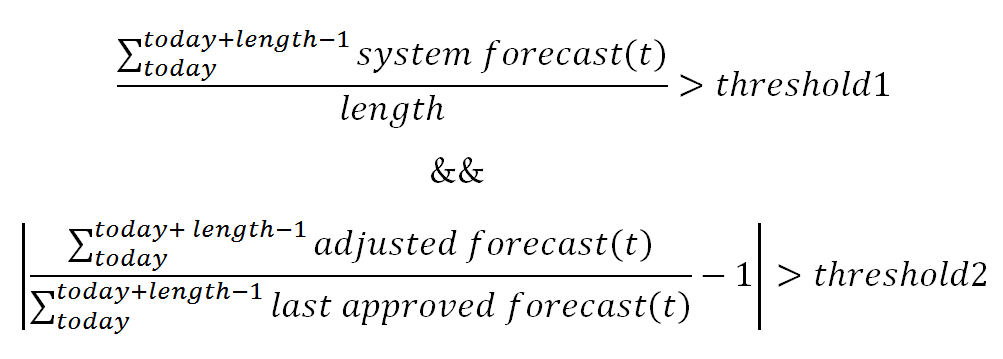
Typically RDF Cloud Service generates forecasts weekly. Every week, new sales data is loaded and the forecast is regenerated. While the latest data points are expected to make the forecast more accurate, it is not expected that the difference in forecasts generated in two consecutive weeks to vary too much. If the forecasts differ, you are alerted to review the forecasts.
This alert is both a batch and a workbook alert.
Alert Expression
Where length, threshold1, and threshold2 are adjustable parameters.
For the batch alert
For the real time alert:
|
Note: The batch alert does not have a time component, while the real time alert is time-phased. |
The calculation expression for this alert involves thresholds which can be adjusted in the Alert Thresholds task.Threshold1 allows filtering out time series by rate of sales. For instance, if it is set to 1, the alert expression is only run for time series that sell at least one item per week. The reason is that we do not want the user to be overwhelmed by reviewing item/store/week information for low sellers. Threshold2 defines how different the two forecasts may be before they get alerted. For instance, if threshold1=0.1, a difference of 10% is considered acceptable, but everything above will trigger the alert, and the time series is not approved.The values of Threshold1, and Threshold2 are the same for both batch and real time alerts.
This alert is relevant for both baseline and causal forecasts.
|
Note: Summation of forecasts are not performed over the entire forecast length. If the forecast horizon is very long, the user may only be interested in periods closer to the forecast generation date, and not want to check periods far out. This can be controlled by the length parameter |
The following steps implement the accuracy and alert calculations:
Calculate rate of sales (ROS) per item/store. There are several places where average sales are calculated. If available, reuse an available measure that stores the desired rate of sales.
Define thresholds for buckets of ROS. For example:
Define error values by low/medium/high ROS. For example:
Define the alert thresholds per rate of sales at the item/store intersection. For example, an item/store that has average sales of half a unit per week, is not worth the effort to be reviewed even if the forecast error is more than 100%. The logic for calculating the threshold is:
If ROS < Low ROS error value
Alert threshold = Low error value
Else if ROS < High ROS value
Alert threshold = Medium ROS error value
Else
Alert threshold = High ROS error value
Calculate the forecast error:
If ROS is less or equal to Low ROS error value for error calculation
Forecast error = (abs(sum of forecast)-abs(sum of sales))/sum of sales * 100
Else
Forecast error = (sum(abs(forecast-sales))/sum of sales * 100
|
Note: The second formula yields a higher error. This formula is applied to medium and high ROS items.The calculation of the forecast error should happen on a window starting the period prior to today and going back an adjustable number of periods. |
Trigger the alert if the error is larger than the threshold (calculated in Step 4).
If Forecast error > Alert threshold
Trigger alert
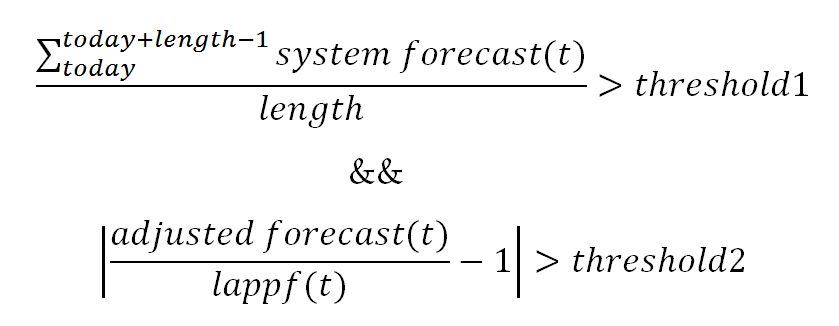
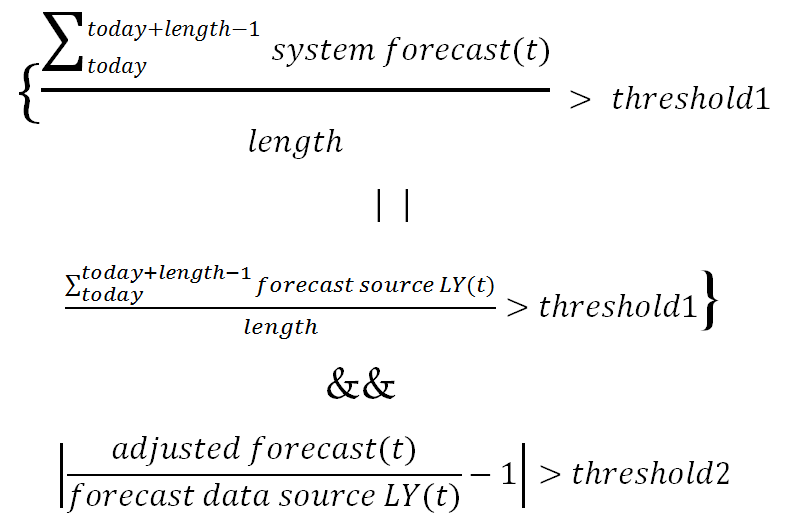
The most reliable forecasts are generated from data that has a repeatable pattern year over year. However, this is not always the case. A change in business strategy, merchandise reclassifications, new items can all lead to changing selling patterns over time.
To detect possible changes in selling patterns, the following alert will compare the last year's sales volume with the forecasted sales volume. If they are different by an adjustable percent, the alert is triggered.
Alert Expression
Where length,threshold1, and threshold2 are adjustable parameters.
For the batch alert:
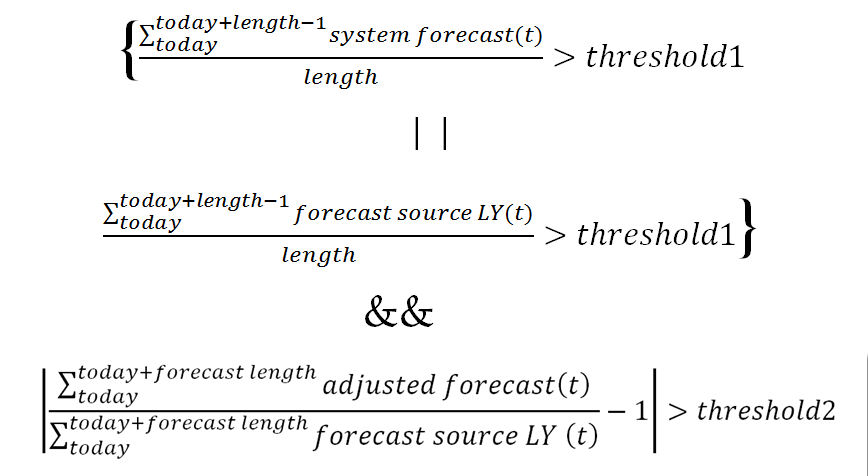
For the real time alert:
|
Note: The batch alert does not have a time component, while the real time alert is time-phased. |
The calculation expression for this alert involves thresholds which can be adjusted in the Alert Thresholds task.First, we compare the average forecast and average sales last year to Threshold1. If Threshold1= 1, we make sure to run the alert only for item/stores that sell on average at least one per week. If the average is not too low, we proceed comparing the current adjusted forecast to the sales last year. If they are very different (defined by Threshold2), the user is alerted to review the forecast.
The alert is mostly relevant for the baseline level. The reason is that there can be large differences in last year sales versus forecast due additional demand coming from past or upcoming promotions.
|
Note: Summation of forecasts are not performed over the entire forecast length. If the forecast horizon is very long, the user may only be interested in periods closer to the forecast generation date, and not want to check periods far out. This can be controlled by the length parameter. |
When a new item for any store is introduced into the assortment, forecasts need to be generated such that it is correctly replenished. Since no historical demand is available, RDF Cloud Service has a few mechanisms to create the forecasts. To do that, it first needs to be aware that new items have entered the system.
Alert Expression
If forecast startdate override is in the future
and POS length < TS duration
and substitution method is blank
and no like item is assigned
then item is considered new
The calculation expression for this alert does not involve thresholds which can be adjusted in the Alert Thresholds task.
The alert is not designed specifically for a forecast level, but rather to trigger the new item functionality available in RDF Cloud Service.
The purpose of this alert is to check how large the forecast peaks are compared to historical demand. The peaks can come from various effects like promotions, price discount, demand transference due to assortment changes, and so on. The most common, though, are due to price changes and promotions.
There is a batch and a workbook alert, with similar calculations, but different intersections;
Batch Alert Expression
The batch alert has the following calculation:
Calculate the maximum historical causal data source:
- Max_hist_dmnd = maximum of source data for causal forecasting (item/store)
Calculate the adjusted peaks in forecast region:
- adj frcst_pks = causal forecast –baseline forecast (item/store/week)
Calculate alert:
- If max(fadjrcst_pks) > Max_hist_dmnd then trigger alert (item/store)
The business case this addresses is to alert you when the peaks in the forecast region are larger than any observed sales in the past. There may be valid justification for this, for instance, several events are active in the same time period, thus creating a huge spike in demand. You can review the alert and take action.
Real Time Alert Expression
The workbook alert condition, based on the information already calculated in the batch version, is:
Adj frcst_pks(t) > Max_hist_dmnd
The target measure for the alert should be the system forecast.
The advantage of the workbook alert is that you can immediately spot the values where the business rule is violated, instead of checking the values for the entire forecast region.
The calculation expression for this alert does not involve thresholds which can be adjusted in the Alert Thresholds task.
If the peaks only come from promotions and/or price discounts, then the alert should be enabled only for the causal level.
|
Note: The batch alert does not have a time component, while the real time alert is time-phased. |
To build the Alert Thresholds workbook, perform these steps:
Click the New Workbook icon in the Alert Thresholds task in the Forecasting Support Process activity.
The Workbook wizard opens. Select the final levels you want to work with and click Next.
Select the products you want to work with and click Next.
Select the locations you want to work with and click Finish.
The Alert Thresholds workbook is built.
The Forecast Alert Default Parameters view allows you to adjust the default values for alert thresholds.
|
Note: All information in this view can be edited and represent domain level values. |
The Forecast Alert Default Parameters view contains the following measures:
Default Forecast Length for Forecast Accuracy
This parameter defines the time frame over which the calculations are performed for the forecast accuracy alert.
Default Forecast vs Last Approved Forecast - Average Sales Threshold
This parameter defines the minimum rate of sales a product/location must have in order to be considered in the alert calculation. If the rate of sales condition is met and the forecast error is higher than allowed, the alert is triggered for the product/location.
Default Forecast vs Last Approved Forecast Length
This parameter defines the time frame over which the alert calculations are performed. The value should not exceed the forecast length. The calculation is still performed but will likely not be accurate.
Default Forecast vs Last Approved Forecast Threshold
This parameter defines the allowable relative error between system forecast and last approved fore-cast. If the error is higher than the threshold and the condition on the average rate of sales is met, the alert is triggered for the product/location.
Default Forecast vs Recent Sales - Average Sales Threshold
This parameter defines the minimum rate of sales a product/location must have in order to be considered in the alert calculation. If the rate of sales condition is met and the forecast error is higher than allowed, the alert is triggered for the product/location.
Default Forecast vs Recent Sales - Forecast Length
This parameter defines the time frame over which the alert calculations are performed. The value should not exceed the forecast length. The calculation is still performed but will likely not be accurate.
Default Forecast vs Recent Sales Threshold
This parameter defines the allowable relative error between system forecast and forecast data source. If the error is higher than the threshold and the condition on the average rate of sales is met, the alert is triggered for the product/location.
Default High Forecast Error Value
Forecast accuracy for items with high rate of sales, as defined by the Default Medium Rate of Sales Value, is tested against this parameter to determine if an alert is triggered.
Default Low Forecast Error Value
Forecast accuracy for items with low rate of sales, as defined by the Default Medium Rate of Sales Value, is tested against this parameter to determine if an alert is triggered.
Default Low Rate of Sales Value
If the rate of sales is less than this value, the item is considered to have a low rate of sale. Its forecast accuracy is tested against the Default Low Forecast Error Value, to determine if an alert is triggered.
Default Medium Forecast Error Value
Forecast accuracy for items with medium rate of sales, as defined by the Default Medium Rate of Sales Value, is tested against this parameter to determine if an alert is triggered.
Default Medium Rate of Sales Value
If the rate of sales is less than this value, the item is considered to have a medium rate of sale. Its forecast accuracy is tested against the Default Medium Forecast Error Value, to determine if an alert is triggered. If the rate of sales is more than this value, the item is considered to have a high rate of sale. Its forecast accuracy is tested against the Default High Forecast Error Value, to determine if an alert is triggered.
The Forecast Alert Final Level Intersection Parameters view allows you to adjust the values for alert thresholds at the final level intersection.
|
Note: All information in this view can be edited. All are defined for measures at the final level intersection. and are meant to serve as an override of the default and intermediate intersection values. |
The Forecast Alert Final Level Intersection Parameters view contains the following measures:
Forecast Length for Forecast Accuracy - override
This parameter defines the time frame over which the calculations are performed for the forecast accuracy alert.
Forecast vs Last Approved Forecast Average Sales Threshold - override
This parameter defines the minimum rate of sales a product/location must have in order to be considered in the alert calculation. If the rate of sales condition is met and the forecast error is higher than allowed, the alert is triggered for the product/location.
Forecast vs Last Approved Forecast Length - override
This parameter defines the time frame over which the alert calculations are performed. The value should not exceed the forecast length. The calculation is still performed but will likely not be accurate.
Forecast vs Last Approved Forecast Threshold - override
This parameter defines the allowable relative error between system forecast and last approved fore-cast. If the error is higher than the threshold and the condition on the average rate of sales is met, the alert is triggered for the product/location.
Forecast vs Recent Sales Average Sales Threshold - override
This parameter defines the minimum rate of sales a product/location must have in order to be considered in the alert calculation. If the rate of sales condition is met and the forecast error is higher than allowed, the alert is triggered for the product/location.
Forecast vs Recent Sales Forecast Length - override
This parameter defines the time frame over which the alert calculations are performed. The value should not exceed the forecast length. The calculation is still performed but will likely not be accurate.
Forecast vs Recent Sales Threshold - override
This parameter defines the allowable relative error between system forecast and forecast data source. If the error is higher than the threshold and the condition on the average rate of sales is met, the alert is triggered for the product/location.
High Forecast Error Value - override
Forecast accuracy for items with high rate of sales, as defined by the Medium Rate of Sales Value – override, is tested against this parameter to determine if an alert is triggered.
Low Forecast Error Value - override
Forecast accuracy for items with low rate of sales, as defined by the Low Rate of Sales Value – override, is tested against this parameter to determine if an alert is triggered.
Low Rate of Sales Value - override
If the rate of sales is less than this value, the item is considered to have a low rate of sale. Its forecast accuracy is tested against the Low Forecast Error Value – override, to determine if an alert is triggered.
Medium Forecast Error Value - override
Forecast accuracy for items with medium rate of sales, as defined by the Medium Rate of Sales Value – override, is tested against this parameter to determine if an alert is triggered.
Medium Rate of Sales Value - override
If the rate of sales is less than this value, the item is considered to have a medium rate of sale. Its forecast accuracy is tested against the Medium Forecast Error Value – override, to determine if an alert is triggered. If the rate of sales is more than this value, the item is considered to have a high rate of sale. Its forecast accuracy is tested against the High Forecast Error Value – override, to determine if an alert is triggered.