| Oracle® Retail Demand Forecasting User Guide for the RPAS Fusion Client Release 16.0 E91109-03 |
|

 Previous |
 Next |
| Oracle® Retail Demand Forecasting User Guide for the RPAS Fusion Client Release 16.0 E91109-03 |
|
Previous |
Next |
This chapter provides an introduction to promotional forecasting and explains how it differs from the traditional statistical forecasting methodology. It discusses the advantages and limitations of both statistical and promotional forecasting models, and it outlines the use of Oracle Retail's Causal method of forecasting demand. It describes terminology used in the context of promotional forecasting, and it concludes with detailed descriptions of the tasks contained in Promote.
Promote is an optional add-on automated predictive solution that allows you to incorporate the effects of promotional and causal events (such as radio advertisements and holiday occurrences) into your time-series forecasts. The promotional forecasting process uses both past sales data and promotional information to forecast future demand.
Traditional statistical forecasting methods provide significant benefits to the process of forecasting consumer demand because they are good at predicting level, trend, and seasonality based on sales history. The limitation of traditional statistical methods is that they forecast with less accuracy when there are special events that cause significant deviations in selling patterns.
For example, the Easter holiday, for which companies often run promotions, occurs on a different date each year. Traditional statistical forecast methods can identify seasonality in sales history, but this seasonality is based on periodic similarities in the sales pattern. Since Easter occurs on different dates from year to year (that is, its period of recurrence is not regular), manual intervention is required to predict change in demand using the traditional statistical forecasting method. Events like this are called promotion events. Promotion events, such as advertisements, irregularly occurring holidays, competitor information, free gift with purchase offers, and so on are events that drive businesses from the normal selling cycle.
The goal of a promotional forecasting system is to improve time series forecasting by:
Providing the forecasting system with visibility as to when certain promotion events were active in the past (for example, identifying which weeks of a given year were affected by an Easter promotion).
Automatically determining the statistical effect, if any, of these events.
Incorporating significant effects into the future forecasts for time periods also associated with the observed promotion event.
The Promote module combines the automation of statistical time series forecasting with the improved accuracy found in customized causal forecasting. Promote uses both past sales data and promotional information (for example, advertisements, holidays) to forecast future demand. In order to understand the underlying rationale for the promotional forecasting process, it is important to understand the advantages and limitations of its underlying components.
Statistical time series forecasting uses past demand to predict future demand. The most basic component of the time series forecast is the level of sales. This is usually determined by looking at demand in the recent past. There often exists an underlying trend that can be detected within sales history. This is usually determined by looking at the change in demand in the recent past. A third factor influencing retail demand is seasonality. A forecasting algorithm trying to determine the effects of seasonality can only look for periodic similarities in the sales pattern. For example, December sales from previous years can be used to adjust the forecast for December only because December occurs regularly every 12 months. At every step, the time series approach is limited to using historical demand to predict future demand without regard to the underlying causes that are driving demand in the first place.
Promotional events, however, can create problems in estimating level, trend, and seasonality. Certain events, such as irregularly occurring holidays, newspaper/radio advertisements, free gift with purchase offers, and special discounts can cause significant deviations from the selling pattern.
Promotional forecasting, unlike statistical forecasting, attempts to predict future demand by identifying the factors that influence spikes and dips of past demand. Once these factors are known, the magnitude and direction of their effect can be evaluated. Their presence can then be incorporated into forecasting models for use during times when the causal factors are again expected to be present.
This section describes how custom promotional forecast models have been developed in the past, leading to the discovery of several consistent findings. These findings have been incorporated into Oracle Retail's development of the Promote forecasting module.
Promotional forecasting uses promotional factors to predict future demand. The first step is to determine all of the pertinent information affecting sales and transform this information into variables that the system understands. Seasonality, for instance, can be represented by a single seasonal continuous variable, such as the number of daylight hours or average daily temperature.
Alternatively, it can be represented by 12 different indicator variables representing each of the months. An indicator variable consists only of 0's and 1's (1 indicates that the event is on). For example, a monthly indicator variable for January would consist of a 1 during the first month of the year and 0's for the remaining months.
Once a list of variables is determined, the model needs to represent the promotion events in terms of their influence on overall demand. For example, if a set of promotional variables has a multiplicative promotional effect on demand, a log transformation may be needed to improve the model. After a suitable model is developed, it must be implemented using multivariate linear regression or neural network architecture with custom code handling the data loading and variable transformations. The final custom model may be quite accurate over the data set on which it was developed.
However, this model may not be general enough to be used universally across all data sets, thus requiring the development of multiple custom models to cover a client's entire domain. This has been found to be very time consuming and costly.
The process of developing custom promotional models has, however, brought to light a number of consistent patterns:
Level, trend, and seasonality are universal components of almost any forecast.
Including a time-series forecast as an input variable often improves promotional models.
Indicator variables are robust in that they can represent both additive and multiplicative effects.
These findings have led Oracle Retail to develop a novel approach to promotional forecasting that combines the automation and generalization of time series forecasting with the improved (albeit data set specific) accuracy met through customized causal forecasting.
Oracle Retail combines time series forecast methods with causal forecast methods, resulting in a new forecast method supported by the promotional forecasting module. Promote uses the AutoES method of forecast generation to determine a baseline time series forecast and then uses indicator variables to represent promotional events of interest. By giving the forecasting routine visibility as to when certain events occurred in the past, the system can correlate changes in the sales demand with these events and determine each promotional event's effect on sales. Then whenever these events occur in the future, the promotional effects can be incorporated into the forecast.
The Promotional Forecasting module has been developed to produce generalized promotional models automatically with little human intervention. Combined with the system's ability to allow you to develop your own data loading routines, Promotional Forecasting provides a cost-effective means for producing forecasts using promotional information.
Promotional Forecasting is designed to produce sales forecasts using both past sales history and event on/off information, both of which you provide. Using the sales data, the system first determines a seasonal time series model to describe the purchasing behavior of consumers. Differences between the seasonal model and the actual sales are then correlated with known events. Events that are found to have a statistically significant impact on sales are then included in a promotional forecast model as promotion events. For each promotion event, its promotion effect on sales is determined. The final promotional model consists of the seasonal model, promotion event on/off information, and each promotion event's resulting effect on sales. By combining these three, a final promotional forecast is computed.
|
Note: More detailed information on the Causal forecasting algorithm is provided in the Forecasting Methods Available in RDF section. |
The following are examples of promotional variables that could be created and the manner in which their associated on/off event status is specified:
Example 13-1 Promotion Event 1
Christmas Day applies to all products/locations. The Christmas promotional variable therefore has only one dimension, Day." Because Christmas Day falls on the 359th day of each non-leap year, the Day359 variable is set to True for every such year (all other days it is set to False).
Example 13-2 Promotion Event 2
A television advertisement is run locally in the New York/New Jersey area for the four weeks at the beginning of the spring fashion season. The TVAD promotional variable has two associated dimensions, State and Week. Week13, Week14, Week15, and Week16 is set to True only for states NY and NJ (all other states/weeks is set to False). Since no product dimension exists, the TV ad is assumed to have an effect on all products.
Example 13-3 Promotion Event 3
A holiday promotion is run involving all sporting goods items for the two weeks prior to Father's Day. The Father's Day promotional variable has two associated dimensions - item and Week. For this year, Week23 and Week24 is set to True only for individual items related to sporting goods items (all other weeks and all other items is set to False). Since no location dimension exists, the Father's Day promotion is assumed to apply to all stores.
After promotional variables have been loaded into RDF, you can use the Promotion Planner task to view, edit, and update associated values without having to reload new data.
When managing periods when events are active, RDF has the Floating Events Admin Workbook. Its one worksheet lists the events and you have the ability to flag periods when certain product/location combinations are active during an event.
A possible task scheduled to run before forecast generation is managing events and holidays, which may heavily impact a retailer's business. Some annual events such as Easter occur at a slightly offset week of the year from year to year. RDF needs to have some control over how these floating events and holidays will be managed along the time dimension so that their impact is not forecasted in the wrong time period. A lift associated with the event needs to be calculated, so it can be applied to the correct periods in the forecast horizon.
Management of this issue causes customers the pain, time and cost of configuring their data as this happens every year. This is a basic retail system requirement that the system should be able to address.
In a RDF causal implementation, an annual event that does not occur in the same period every year, but has a spike in demand associated with it, is handled by associating a causal factor to it. The system then determines the associated lift, and applies it to the relevant point in time in the forecast horizon.
In a RDF implementation, where there is no causal, these events still exist. For instance, an increase for sales leading to Easter will happen even if there is no promotion specifically associated with Easter (chocolate bunnies sell more during Easter even though they are not specifically promoted). And because it does not happen in the same time period every year, the Easter spike will appear randomly any time in March or April. The spike is baked in the seasonality of each item/store, making its prediction, timing, and magnitude; inaccurate at best.
RDF is able to handle such situations, not only through its causal capabilities, but also for baseline forecasting.
To do that, a set of events has to be defined. This usually happens at configuration time. Then, a user has to flag the periods where an event was active in the past (history) and in the future (forecast horizon). Once the dates are set up, the effect of the event is estimated based on past instances, and applied in the forecast horizon if the flag is active.
The following list outlines the standard procedures performed in order to set up the system to run a promotional forecast:
Setting forecast parameters in the Forecast Administration Workbook
Setting forecast parameters in the Forecast Maintenance Workbook
Setting promotions to be active in the Promo Planner Task
Running the batch forecast
Viewing and Edit Causal Forecast results
Analyzing forecasts in the Forecast Approval Workbook
Analyzing and editing causal effects in the Promo Effect Maintenance Task
Perform the following procedure to set up the system to run a promotional forecast.
Build a Forecast Administration Workbook.
In the Forecast Administration Workbook: Final Level Parameters View - Advanced Settings, select Generate Baseline Forecasts.
Optional: Set the Default Forecast Method to Causal for the desired level if the level is to be use only for Promotional Forecasting.
Optional: Set the Causal Higher Intersection for the desired level if the Override from Higher Level promotion type is used.
Optional for use with Daily Causal Forecasting: Set the values for the following parameters:
Causal Aggregation Profile
Causal Calculation Intersection
Causal Calculation Intersection Periodicity
Commit your changes to the master database by selecting Commit Now from the File menu.
Build a Forecast Maintenance Workbook.
Set the Forecast Method Override to Causal for any items/locations at the desired levels that use Promotional Forecasting.
Commit your changes to the master database by selecting Commit Now from the File menu.
Build a Promo Planner Workbook.
Set causal variables for items and locations historically in that the selected promotions are active.
Commit your changes to the master database by selecting Commit Now from the File menu.
Select Run Batch and generate a Forecast.
Perform this procedure to view a forecast that includes promotion effects.
Build a Forecast Approval Workbook and include System Baseline in your task.
In the Final Level View, review the System Baseline and the System Forecast. The System Baseline is predicted demand given no causal effects. The System Forecast is the sum of the System Baseline and the Promotional Peak calculated during the forecast generation process based on the causal data and settings.
Perform this procedure to view and edit promotion system-calculated effects.
Build a Promo Effect Maintenance Workbook.
In the Final Promotion Effect Parameters View PromoEffects view, review the System Calculated Effect.
If the System Calculated Effect is to be modeled using a method other than Automatic, edit thePromo Effect Type.
If you choose to adjust the system-calculated effect, adjustments can be made to the System Effect Override. You must also set the Promo Effect Type to Override All or Override Future Only.
Select Run Batch and generate a Forecast.
Follow this procedure to perform analysis on past promotions and simulate the effects of historic or future promotions:
In the Promotion Parameters View, review the System Calculated Effect and edit the System Effect Override then select Calculate to recalculate the Future Forecast.
|
Note: Changes to the Promo Effectiveness/ Results Workbook cannot be committed; however, this task is useful for:
|
The Promote tasks, workbooks and views allow you to manage the promotion events used in the system's promotional forecasting processes, and view/edit the system's analysis of the effects of these events on demand. In addition, the user can perform What-if, evaluate the results and commit back to the database the desired settings.
|
Note: External to Promote, the Forecast Administration Workbook includes several parameters that may be used as additional configuration options for promotional forecasting. For additional information, refer to Procedures in Promotional Forecasting. |
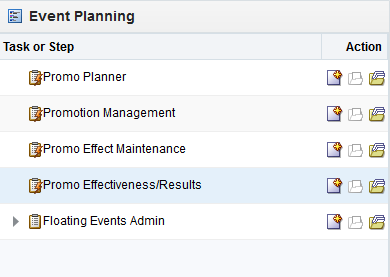
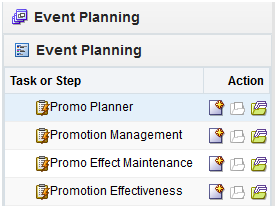
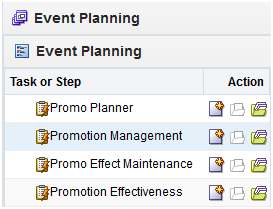
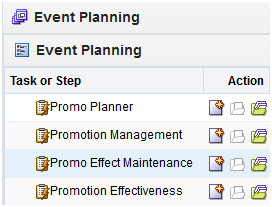
Table 13-1 lists the Promote tasks, workbooks, and views in the Event Planning activity.
Table 13-1 Promote Tasks, Workbooks, and Views
| Task | Workbook and Steps | Views |
|---|---|---|
|
Allows you to specify when certain promotional events were active in the past, and when they are active in the future. |
|
|
|
Allows you to enable and disable promotions for causal forecast levels and to specify whether promotions can have a negative effect. |
|
Promo Variable Model Type View |
|
Allows you to review the system-calculated promotional lift effects, edit these effects, and determine how changes are factored into the promotional model. |
Promo Effect Maintenance Workbook |
Promotion Effect Parameters Views Final Promotion Effect Parameters View |
|
In addition to all tasks that can be performed in the other Promo workbooks, the user can perform what-if, evaluate the promotional forecast and commit the parameters. |
Promotion Effectiveness Workbook |
|
|
|
Default Causal Parameters View Final Level Causal Parameters View Pooling Levels Causal Parameters View |
|
|
|
|
|
The Promo Effectiveness/ Results task is a historical and future view to the effects of a planned promotion.
This task has these views:
In this task, you view the promotional forecast. There is also the ability to analyze the effects on the forecast if a promotion does or does not occur. This analysis is performed by turning a promotional event or attribute on or off for dates in the future plans, and/or by modifying the Simulated Effect. This task is intended for simulation and analysis purposes only. There is no Commit functionality.
|
Note: Changes to the Promo Effectiveness/ Results task cannot be committed back to the master database; however, this task is useful for reporting on the performance of past promotions and simulating the effects of future promotions to support more accurate promotional modeling. |
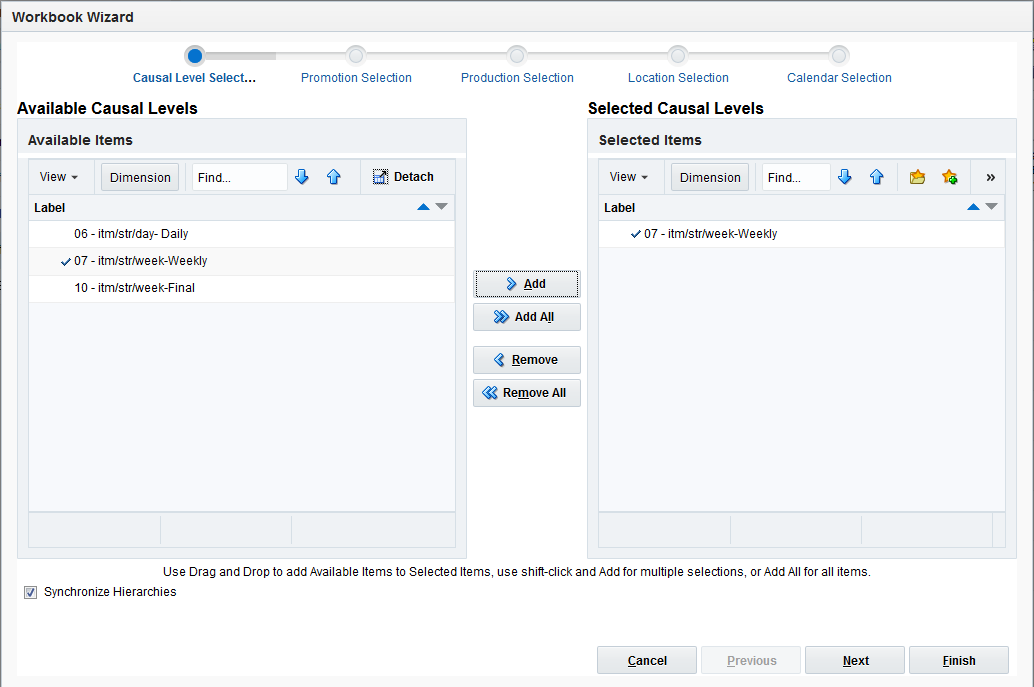
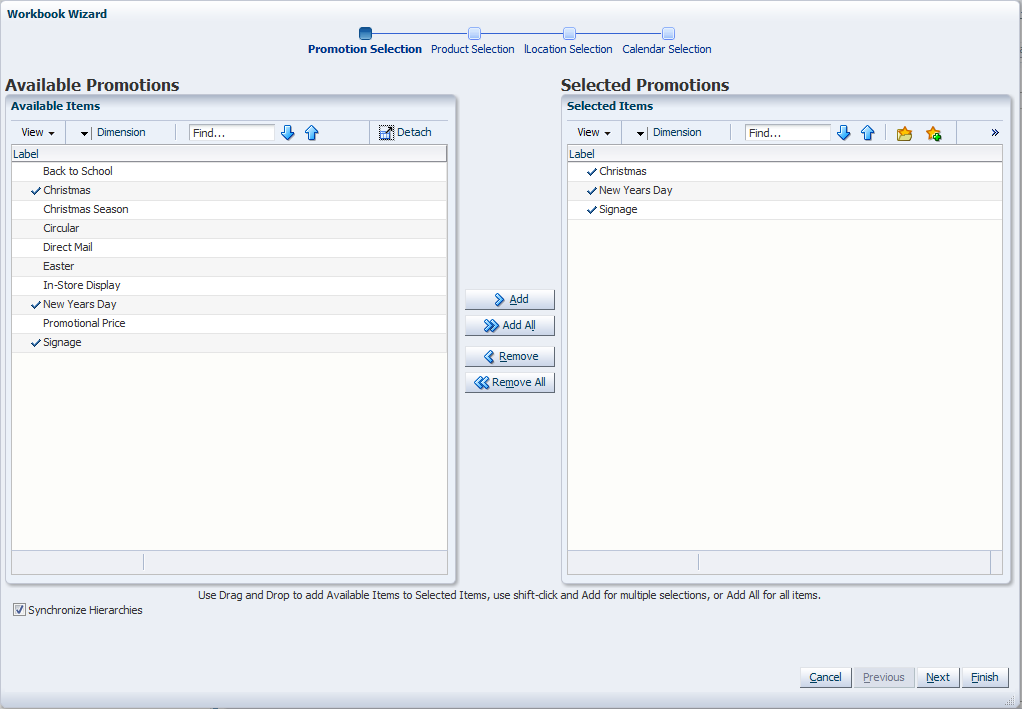
To build the Promo Effectiveness/ Results workbook, perform these steps:
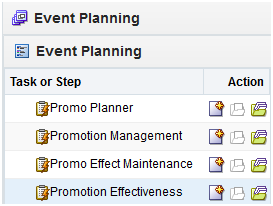
Click the New Workbook icon in the Promo Effectiveness/ Results task in the Event Planning activity.
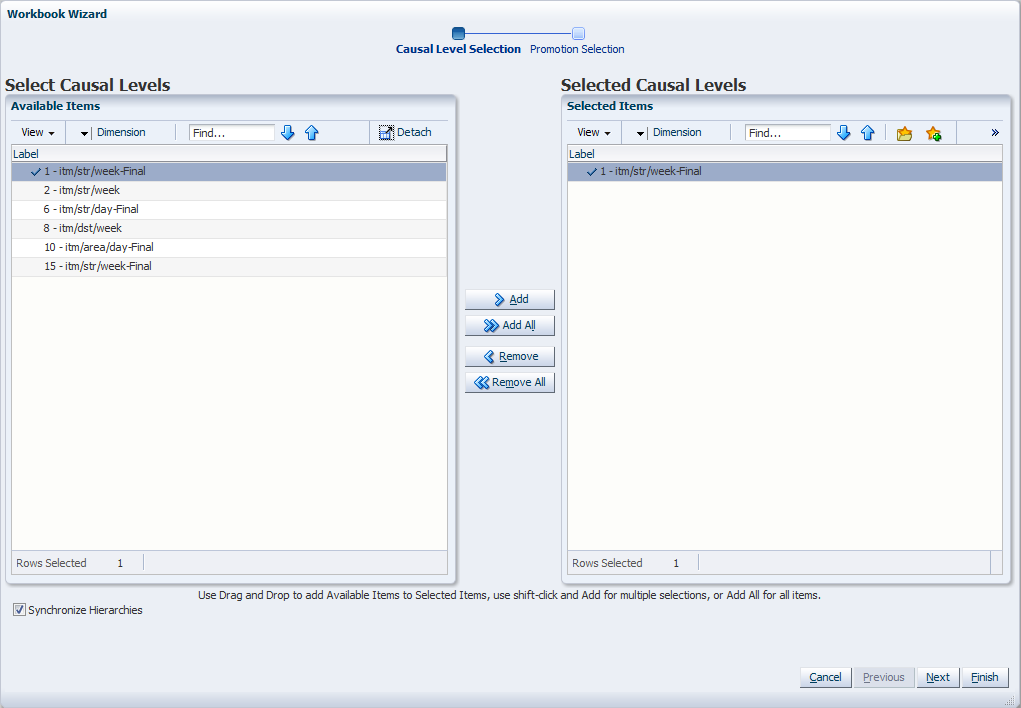
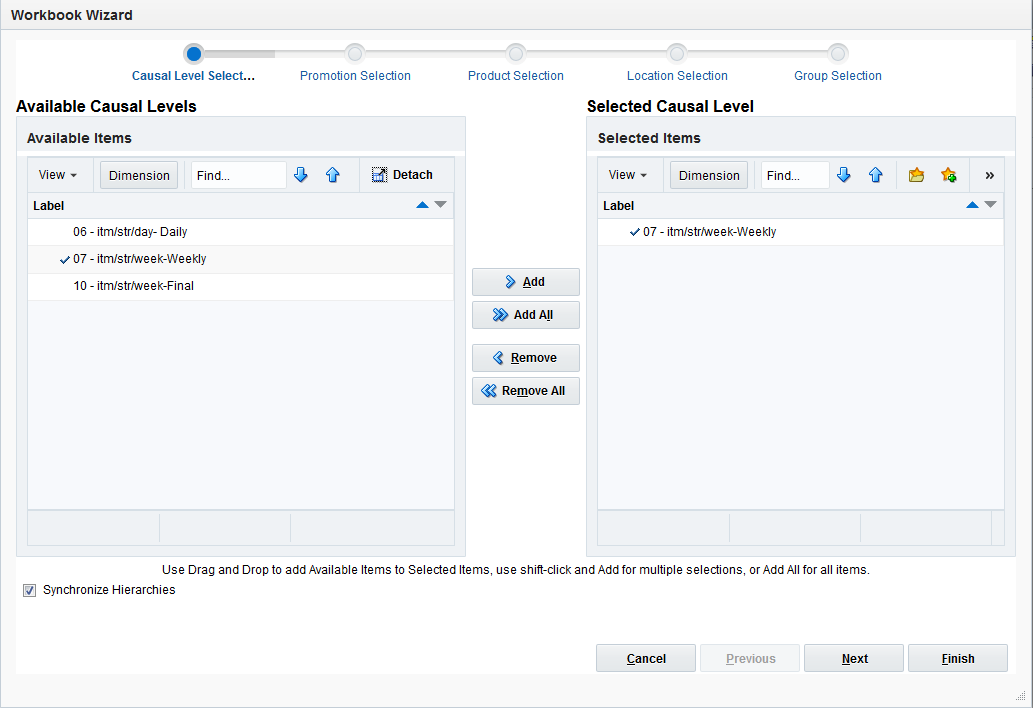
The Workbook wizard opens. Select the causal level and click Next.
|
Note: This wizard only displays the causal final levels for selection. |
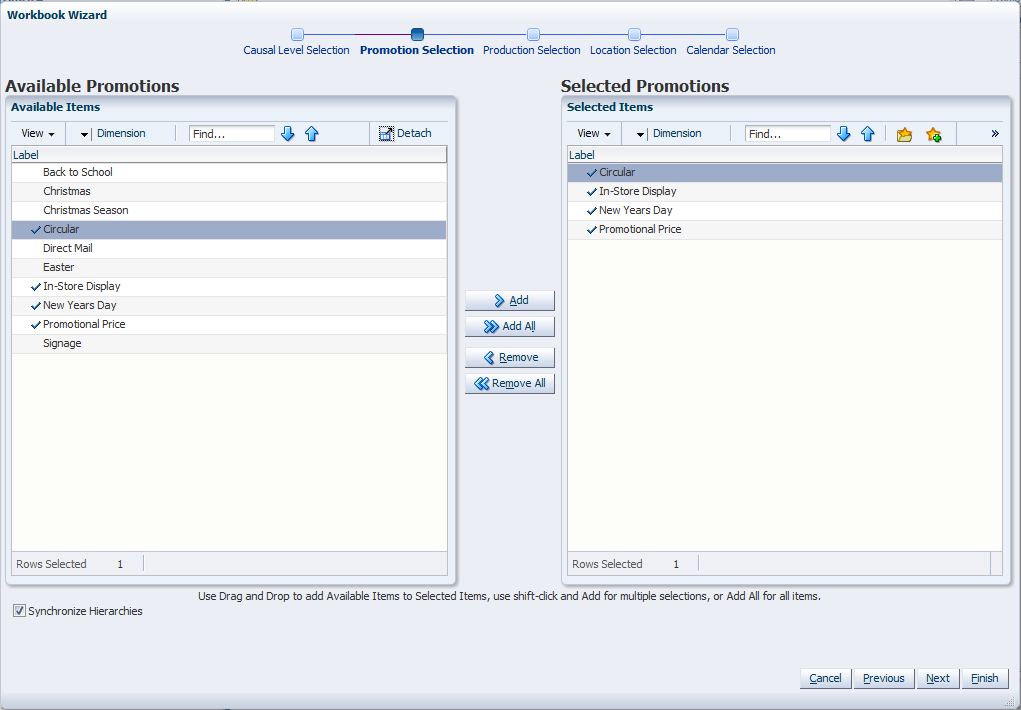
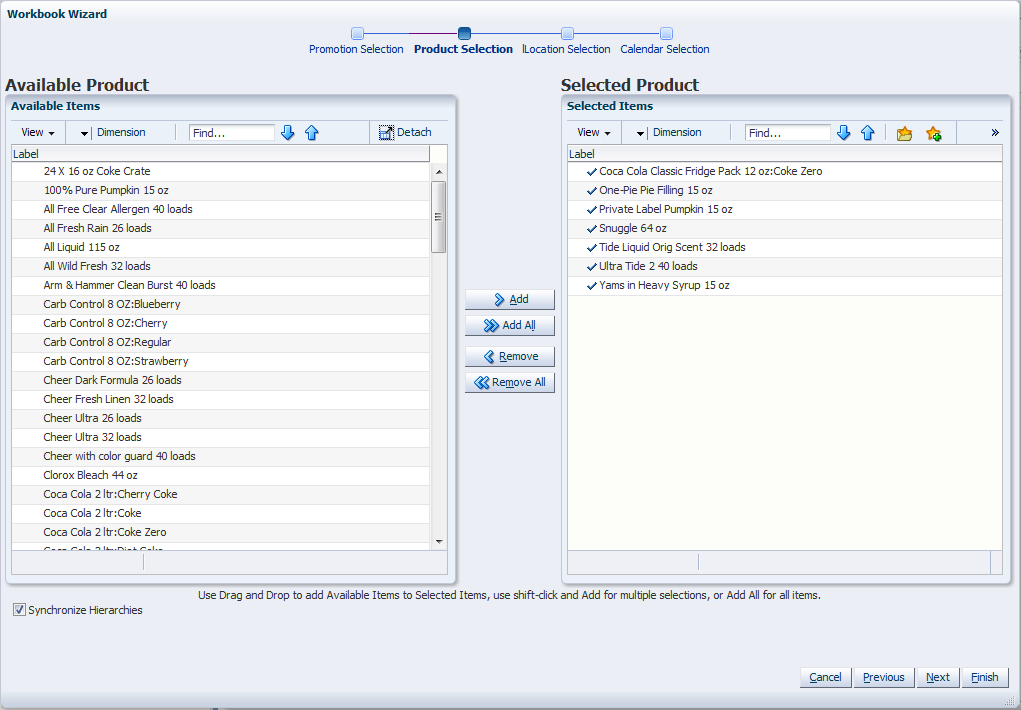
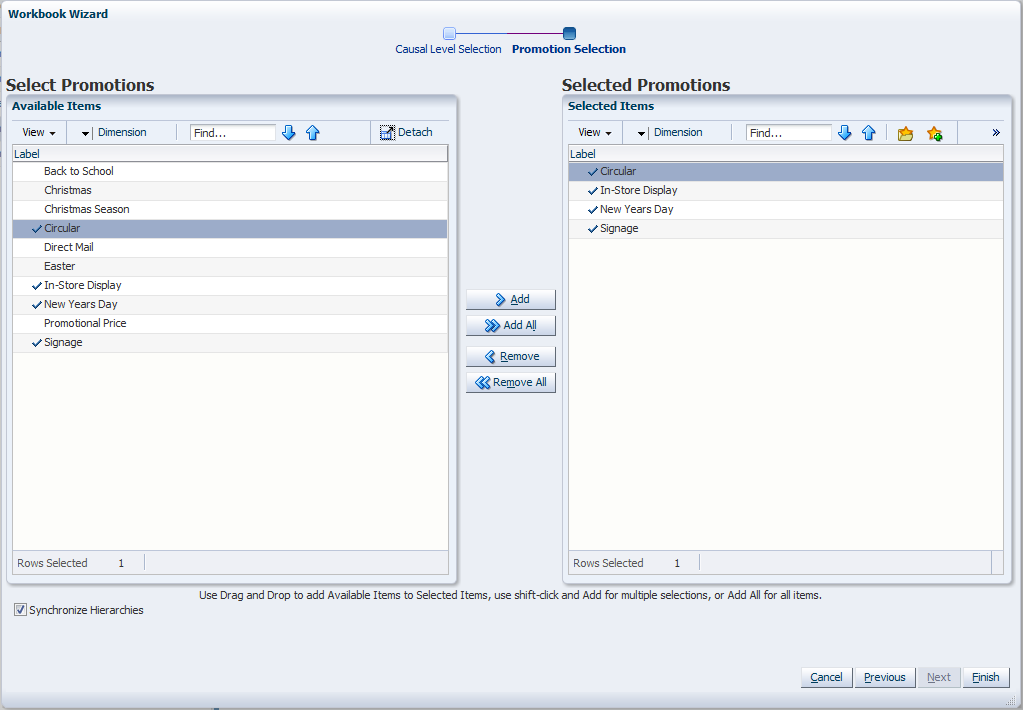
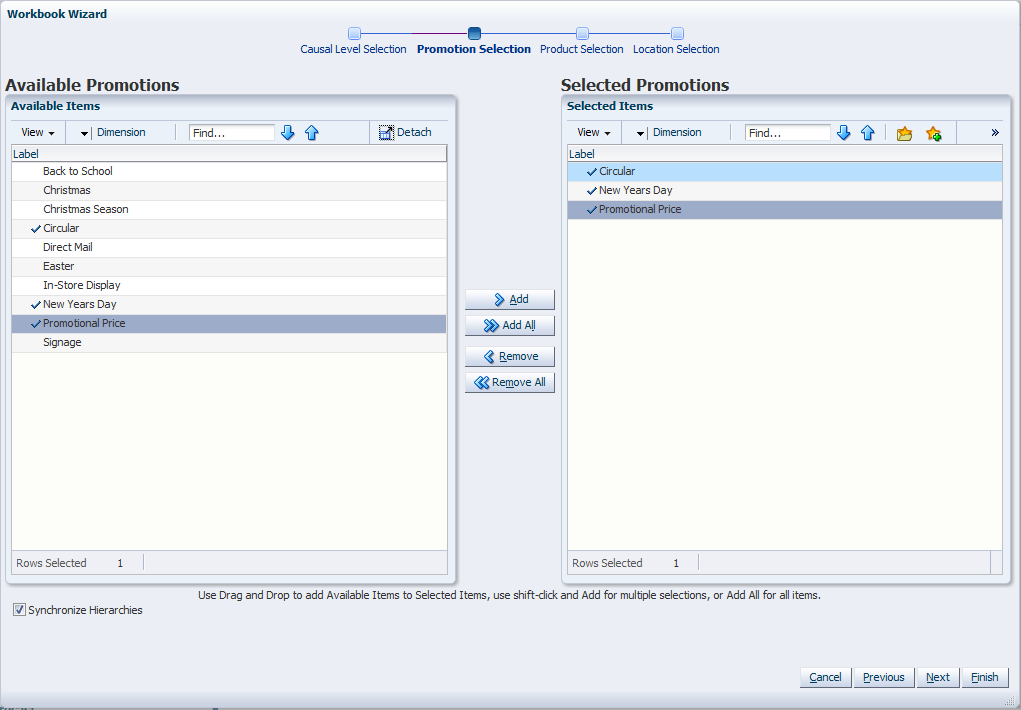
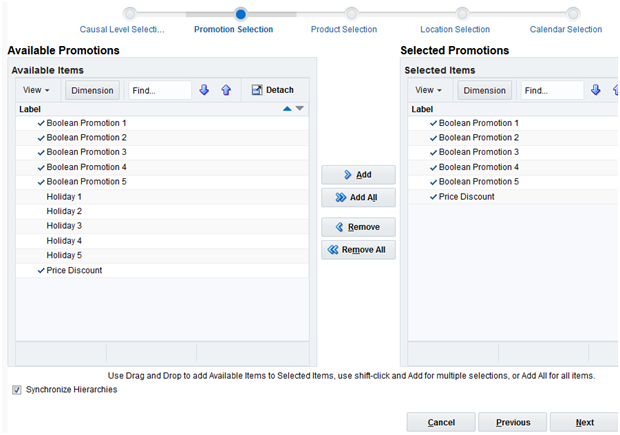
Select the promotions to include and click Next.
|
Note: If RDF detects cross-promotional effects for your selected causal level, then RDF uses those promotions and the wizard skips to "Workbook Wizard: Select Products". |
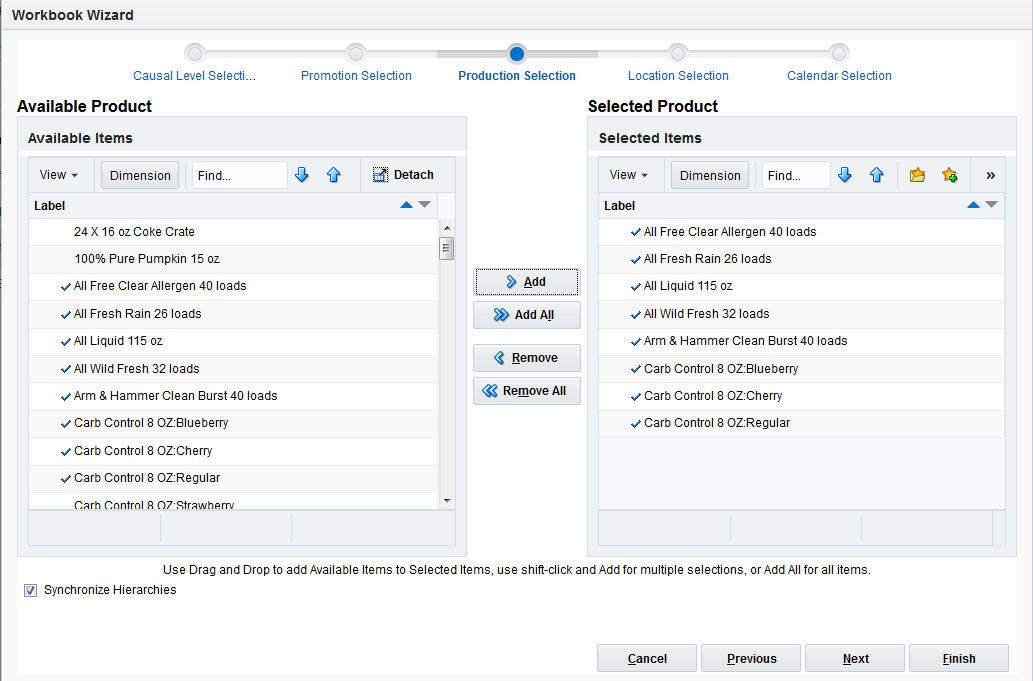
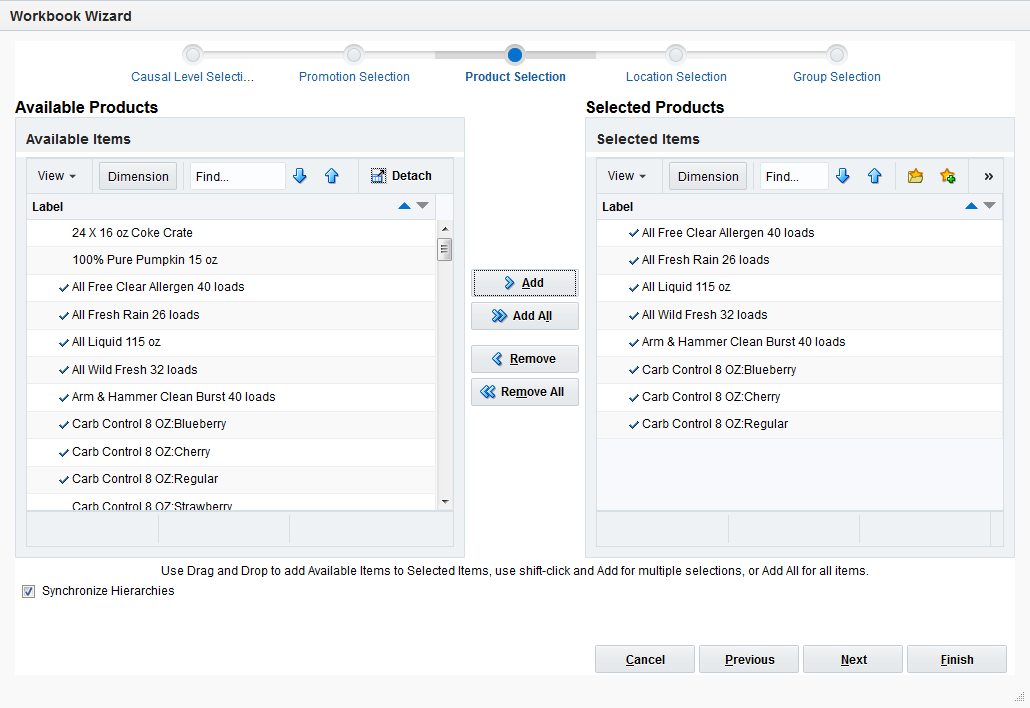
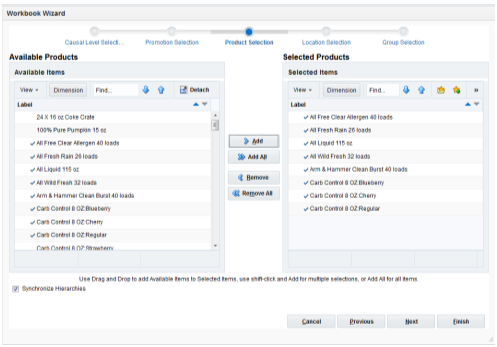
Select the products to include and click Next.
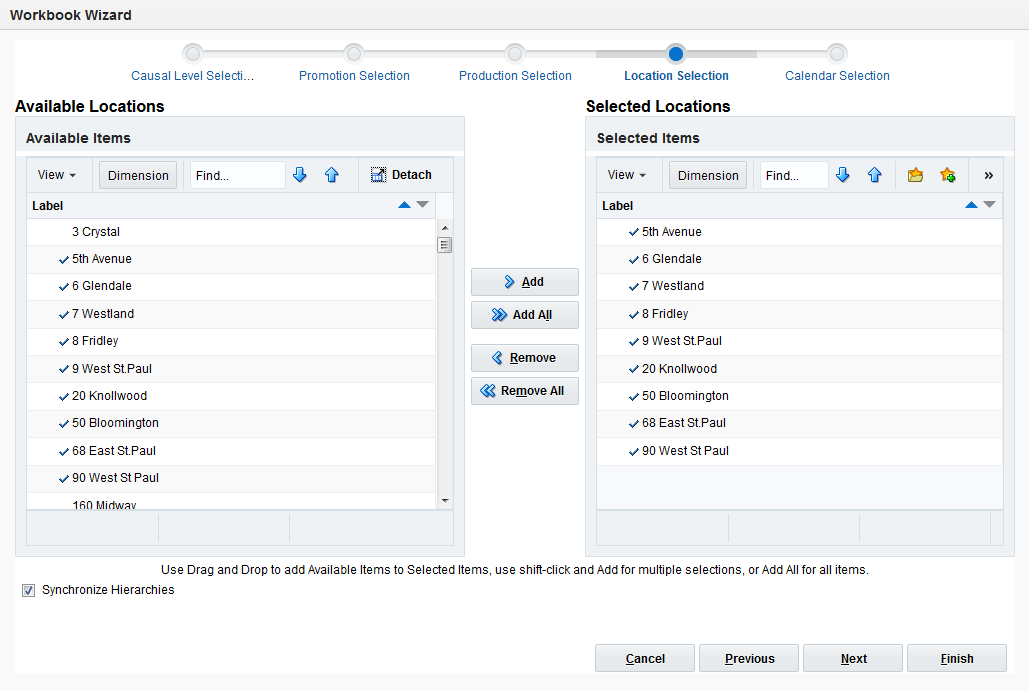
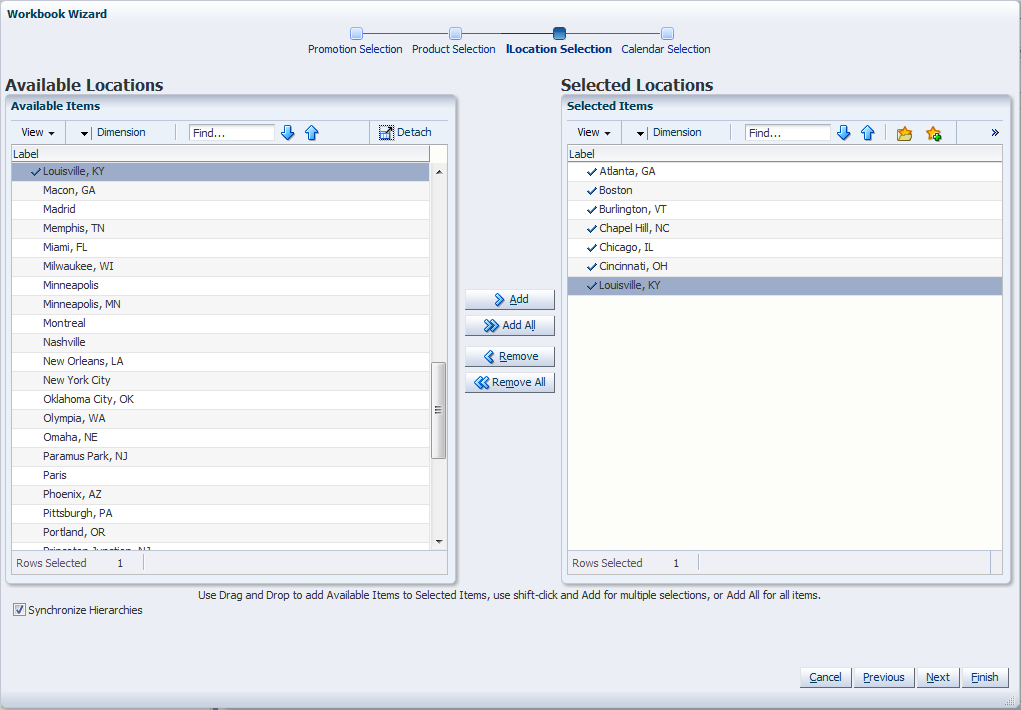
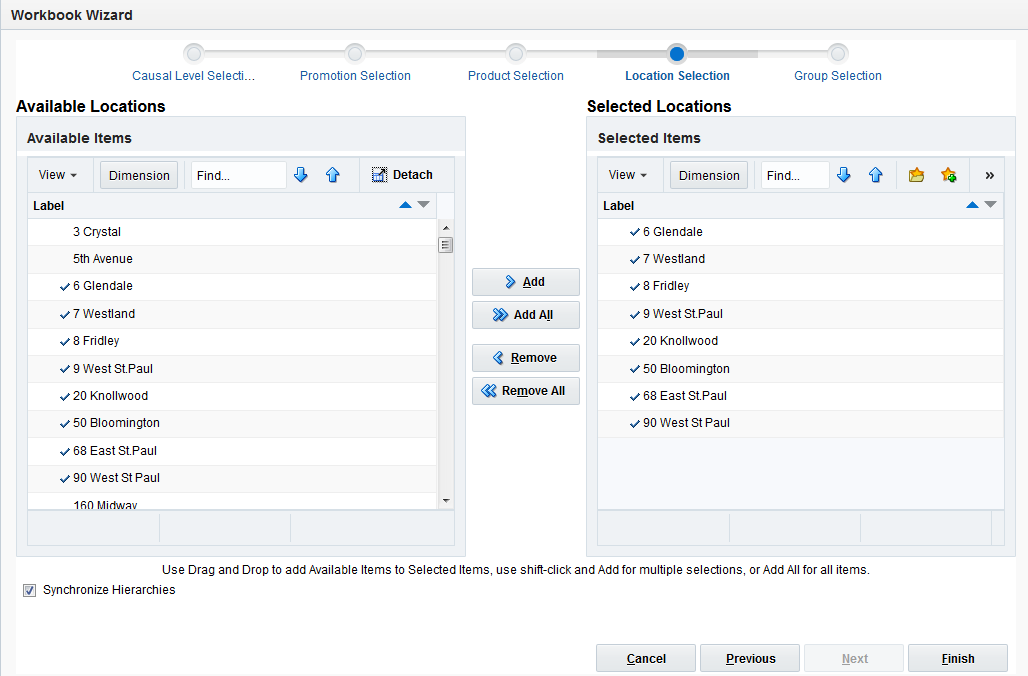
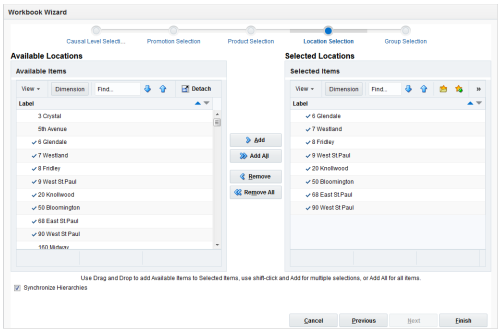
Select the locations and click Next.
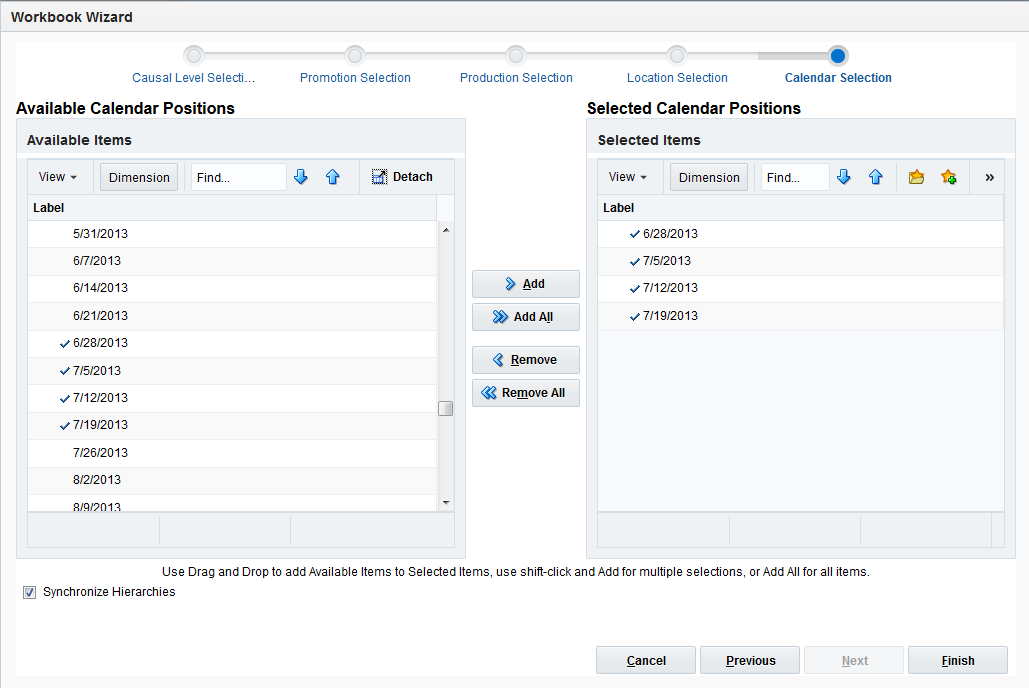
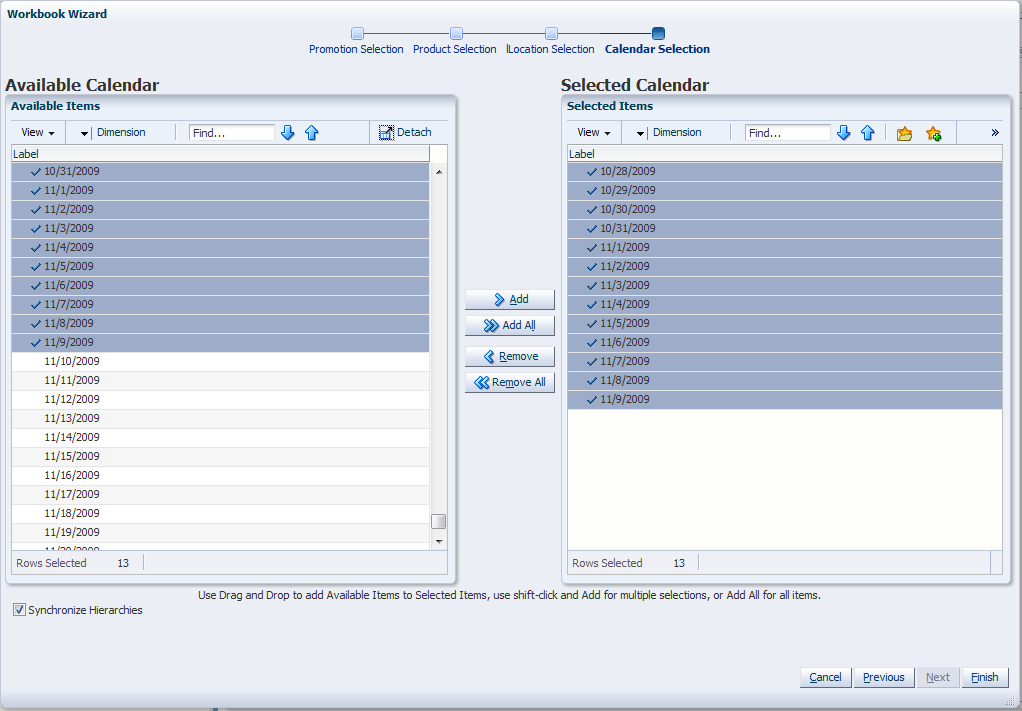
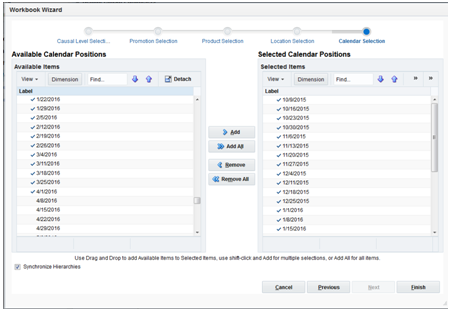
Select the days you want to work with and click Finish.
The Promo Effectiveness/ Results workbook is built.
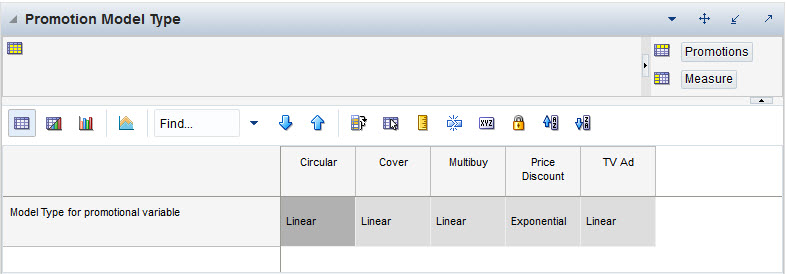
The Promotion Model Type view allows you to review the model type.
The Promotion Model Type view contain the following measure:
Model Type for Promotional Variable
This measure stores the model type for the selected promotion variables. The choices are exponential and linear. An exponential model type is displayed if the promotion type is exponential. A linear model type is displayed when the promotion types are Real or Boolean.
For additional information, see "Promotion Variables".
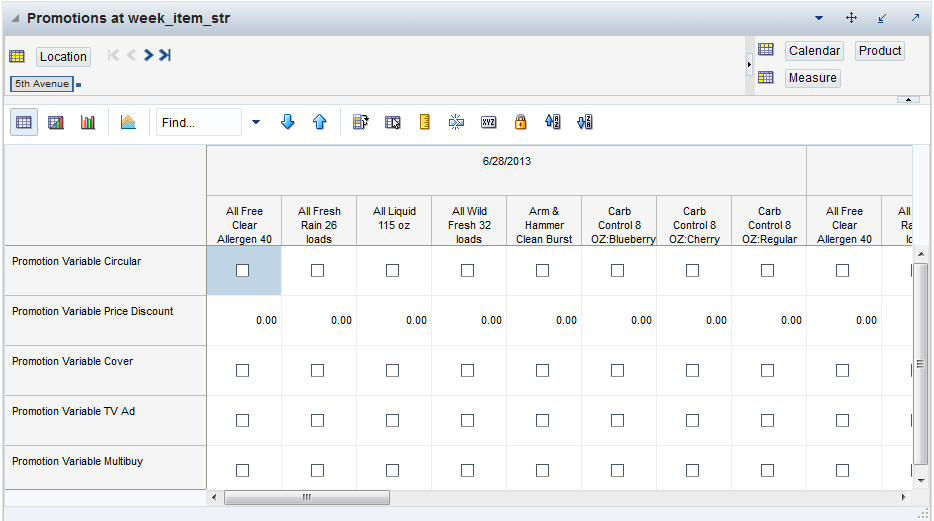
The Promotion view allows you to review and enable or disable promotions for item/locations for desired periods. Once the changes in the promo calendar have been made, click Calculate to update the forecast values in the Promotion Forecast view.
The promotions must be enabled for the chosen causal level.Note that multiple Promotions views are possible. Namely, there is one view for every distinct promotion intersection. Promotions with identical intersections are displayed in the same view.
The Promotions view contain the following measure:
Promotion Variables
Promotion Variables are defined as either Boolean, Exponential, or Real types during the configuration process in the Promote Plug-In. Refer to the Oracle Retail Demand Forecasting Configuration Guide for additional details on configuring the Promote solution.
For additional information, see "Promotion Variables".
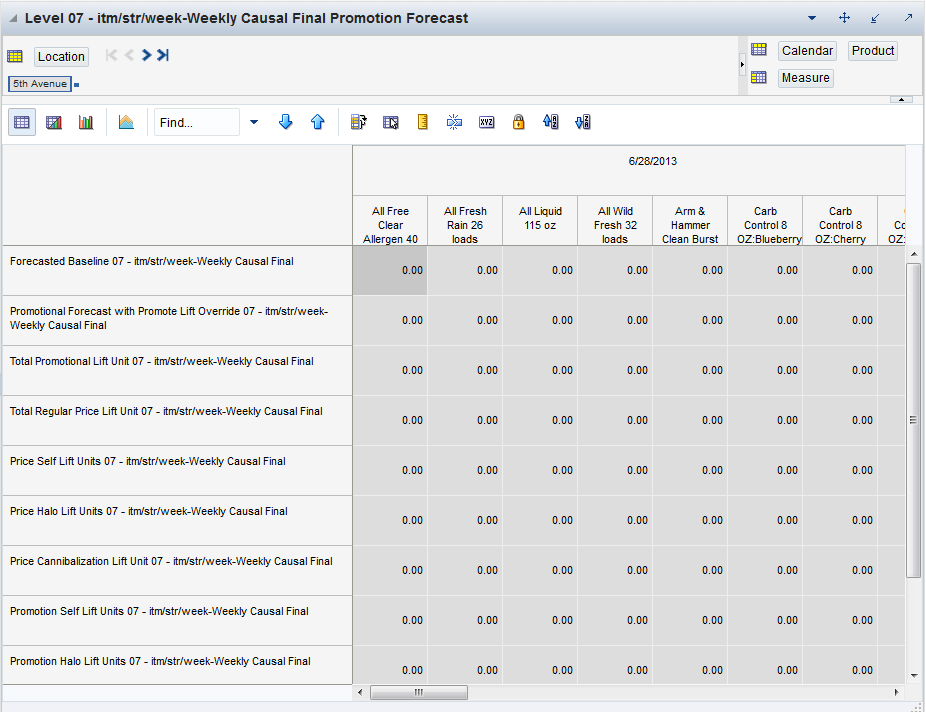
The Promotion Forecast view allows you visibility to all components of the forecast, like Self, Halo, and Cannibalization effects for both regular price changes, as well as promotions. This is the place the user reviews the impact of the promo-related parameters set in the Promotions and Promotion Parameters views. The process of changing parameters, re-generating the promo forecast, and reviewing the impact in this view, implements the promotional what-if functionality.
The Promotion Forecast view can contain the following measures:
Forecast Baseline
The Forecast Baseline is a forecast generated on past sales data that contains no promotions (that is, normal demand given no causal effects).
Price Cannibalization Lift Unit
This measure displays the negative effect, measured in units, that a price change of certain items has on this item.
Price Halo Lift Units
This measure displays the positive effect, measured in units, that a price change of certain items has on this item.
Price Self Lift Units
This measure displays the effect that a price change has on the sales units of an item.
Promotion Cannibalization Lift Units
This measure displays the negative effect, measured in units, that the promotion of certain items has on this item.
Promotion Halo Lift Units
This measure displays the positive effect, measured in units, that the promotion of certain items has on this item.
Promotion Self Lift Units
This measure displays the effect that promotions have on the sales units of an item.The value is expected to reflect the overlapping promotions effect. More information is available in the Forecast Administration workbook.
Promotional Forecast with Promote Lift Override
This measure displays the promotional forecast where the promotional peaks are not calculated by RDF, but imported as lift overrides.
Promotional Lift Override
Override, in units, of the system generated promotional lift. The override is at the same intersection as the forecast.
This measure can be equal to the Aggregated Promotion Lift Override or zero (0). It is generated based on the Aggregated Promotion Lift Override and the Apply Promotion Lift Override Indicator. If the indicator is set to True (which applies the override), then this value should be the same as the spread down Aggregated Promotion Lift Override. If the indicator is False (which does not apply the override), then this value equals zero (0).
Total Promotional Lift Unit
This measure displays the total effect that a promotion can have on an item's sales units. It is the sum of Promotion Self Lift Units, Promotion Halo Lift Units, and Promotion Cannibalization Lift Units.
Total Regular Price Lift Unit
This measure displays the total effect that a regular price change can have on an item's sales units. It is the sum of Regular Price Self Lift, Regular Price Halo Lift, and Regular Price Cannibalization Lift.
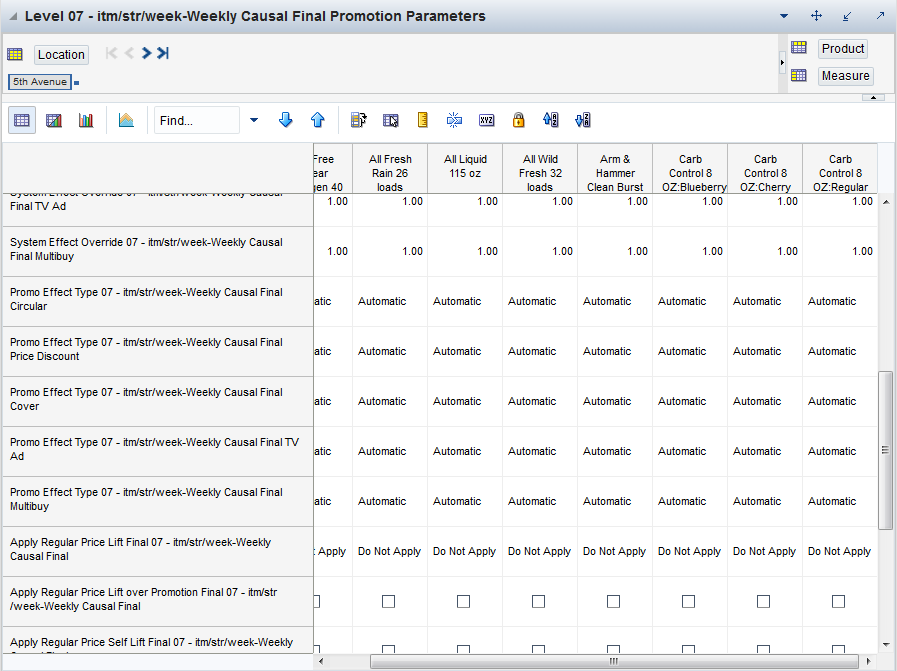
The Promotion Parameters view allows you to set up rules that need to be followed when forecast is simulated. For instance, you may not want to apply regular price change effects when an item is on promotion or you may want to incorporate Halo and no Cannibalization effects in the forecast. click Calculate to update the forecast values in the Promotional Forecast view.
|
Note: Promotion Parameters includes several views, one for the selected final level, and one for each source level corresponding to the final level. |
The Promotion Parameters view contains the following measures:
Aggregated Promotion Lift Override
This measure allows you to override (in units) the system generated promotional lift.The override is at an aggregate level and spread down to the forecast level.
Apply Promotion Cannibalization Lift
Select this parameter (set to True) if the application of Cannibalization Lifts is enabled for the forecast level.
Apply Promotion Halo Lift
Select this parameter (set to True) if the application of Halo lifts is enabled for the forecast level.
Apply Promotional Lift Override
Select this parameter (set to True) if you want RDF to ignore the system calculated lifts and apply the overrides.
Apply Regular Price Cannibalization Lift
Is only effective if Apply Regular Price Lift is set to Apply System or Apply Override. Select this parameter (set to True) if the application of Regular Price Cannibalization Lifts is enabled for the forecast level.
Apply Regular Price Halo Lift
Is only effective if Apply Regular Price Lift is set to Apply System or Apply Override. Select this parameter (set to True) if the application of regular price Halo lifts is enabled for the forecast level.
Apply Regular Price Lift
If regular price lifts are enabled for the forecast level, select one of the following options:
| Option | Description |
|---|---|
| Do Not Apply | Does not apply regular price effects (including Self, Cannibalization, and Halo effects) |
| Apply System | Applies system calculated effects |
| Apply Override | Ignores system calculated effects and applies overrides |
Apply Regular Price Lift Over Promotion
Is only effective if Apply Regular Price Lift is set to Apply System or Apply Override. Select this parameter (set to True) if the application of regular price lifts is enabled for time periods that are promoted. If the parameter is clear, then regular price lifts are not applied for periods with promotions.
Apply Regular Price Self Lift
Is only effective if Apply Regular Price Lift is set to Apply System or Apply Override. Select this parameter (set to True) if the application of regular price lifts is enabled for the forecast level.
Blended Promo Effect
This measure is registered for each promotion. This is the value for the promotion effect that was used to create the forecast if no override is specified. Depending on the administration and maintenance settings it can be one of the following:
Item/store calculated effect
Source (pool) calculated effect
A combination of the two. The way the two effects are combined can also be determined by the user by specifying a blending parameter.
Promo Effect Type
Causal variable types define how causal variables are treated in the causal model-fitting process (which includes a call to the lower-level regression engine) and the forecast generation process where the model is used to extend the forecast over the forecast horizon.
Table 13-3 lists the Causal variable types.
Promotional Lift Override
This read-only measure allows you to override (in units) the system generated promotional lift. The override is at the same intersection as the forecast.
This measure can be equal to the Aggregated Promotion Lift Override or zero (0). It is generated based on the Aggregated Promotion Lift Override and the Apply Promotion Lift Override Indicator. If the indicator is set to True (which applies the override), then this value should be the same as the spread down Aggregated Promotion Lift Override. If the indicator is False (which does not apply the override), then this value equals zero (0).
System Calculated Effect
The System Calculated Effect is a read-only measure indicating the lift effect generated by the system.
System Effect Override
The user-specified lift effect. This user-entered effect is active if used in conjunction with the Override All and Override Future Only Promotion Effect Types. Otherwise, it equals 1.00.
In order to correlate deviations from the seasonal forecast with the occurrence of historic promotion events, the system needs visibility as to when these events were active. The system must also be informed of dates on which the status of upcoming promotion events will again be on, so the anticipated promotion effects can be built into the forecasting model.
The Promo Planner task allows you to indicate to the system when certain events were active in the past and when they is active in the future. All promotional events should be represented as accurately as possible so the modeling routine can more precisely detect correlations between event occurrences and changes in sales values.
The Promo Planner task consists of as many views as are necessary to represent all unique dimensional intersections associated with the promotion events contained in the task. A separate view is constructed for each of the required intersections. For example, promotion events such as Advertisement and Gift with Purchase may be loaded at the item/store/week intersection, while an event such as Christmas is loaded at the [Day] level.
In this setup, the Advertisement and Gift with Purchase promotions would appear on one view, and Christmas would appear on another. Whenever a hierarchy is not included in the base intersection (as in the case of the Christmas promotional event) the event is assumed to apply to all positions in the undefined hierarchy. Thus, Christmas is assumed to apply to all products and all locations, but only to the Day-level calendar positions specified in the Promotions View.
This task has this view:
To build the Promo Planner workbook, perform these steps:
Click the New Workbook icon in the Promo Planner task in the Event Planning activity.
The Workbook wizard opens. Select the promotion events to include and click Next.
Select the products to include and click Next.
Select the locations to include and click Next.
Select the days you want to work with and click Finish
The Promo Planner workbook is built.
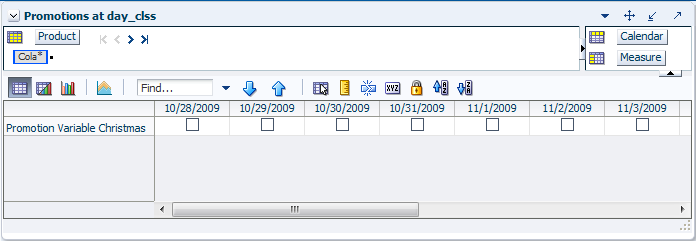
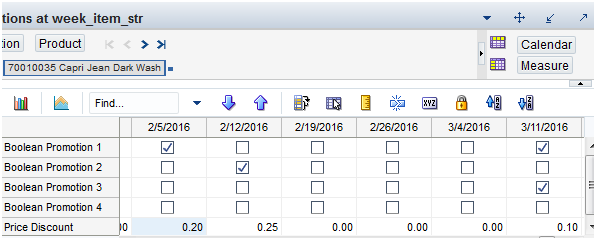
The Promotions view allows you to view and edit the on/off information associated with each configured promotional event. This view provides an interface in which you can specify the time periods (and possibly products or locations) for which certain promotional variables are active.
The Promotions view contains the following measures:
Promotion Variables
Promotion Variable Type is defined through setting both Data Type and Model Type during the configuration process in the Promote Plug-in. The Promotion Variable Type includes Boolean, Exponential, and Real. The following table explains how Promotion Variable Type is defined through Data Type and Model Type settings.
| When the Type is | And the Model is | Then the Promotion Variable Type is |
|---|---|---|
| Boolean | Linear | Boolean |
| Real | Linear | Real |
| Real | Exponential | Exponential |
The Data Type includes Boolean and Real types. The Model Type includes Linear and Exponential types. When Data Type is set to Boolean, the Promotion Variable Type is Boolean. When Data Type is set to Real and the Model Type is set to Linear, the Promotion Variable Type is Real. If Data Type is set to Real and the Model Type is set to Exponential, the Promotion Variable Type is Exponential.Refer to the Oracle Retail Demand Forecasting Configuration Guide for additional details on configuring the Promote solution.
| Promotion Variable Type | Description |
|---|---|
| Boolean | A check in a given cell indicates that the associated promotion event's status is on (or 100% of the lift effect applies) for that intersection. If no check is indicated, the event's status is off.
Boolean promotions can be enabled together with other types of promotions at the same time. |
| Exponential | Real numbers are expected in the cells. The value specified here is used in an exponential model which is an input to the stepwise regression sub-routine.
A typical example of a metric modeled as exponential is the percent price change. Note how the percent price change can be positive (price increase) or negative (price decrease). Exponential promotions can be enabled together with Boolean promotions at the same time. However, they can not be enabled together with Real promotions. |
| Real | Non-negative values are expected in the cells.
A value of 0 indicates that the event's status is off. A value greater than 0 will act as a weight when calculating the effects during the stepwise regression. Real promotions can be enabled together with Boolean promotions at the same time. However, they can not be enabled together with Exponential promotions. |
About Implementation
Among the ways Causal variables can be implemented include price or discount percent. Your Oracle Retail Consultant can best determine the most accurate setup of promotion variables based upon your promotional forecasting requirements.
The Promotion Management task allows you to enable and disable promotions for causal forecast levels and to specify whether promotions can have a negative effect.
This task has these views:
To build the Promotion Management workbook, perform these steps:
Click the New Workbook icon in the Promotion Management task in the Event Planning activity.
The Workbook wizard opens. Select the causal level and click Next.
Select the promotions you want to work with and click Finish.
The Promotion Management workbook is built.
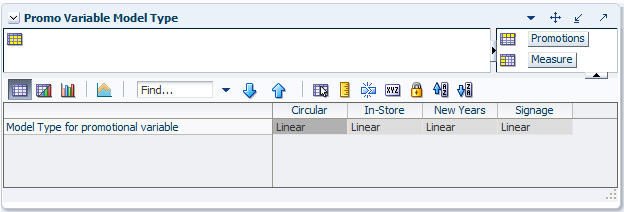
The Promo Variable Model Type view allows you to view the model type for the selected promotion variables.
The Promo Variable Model Type view contains the following measure:
Model Type for Promotional Variable
This measure stores the model type for the selected promotion variables. The choices are exponential and linear. An exponential model type is displayed if the promotion type is exponential. A linear model type is displayed when the promotion types are Real or Boolean.
For additional information, see "Promotion Variables".
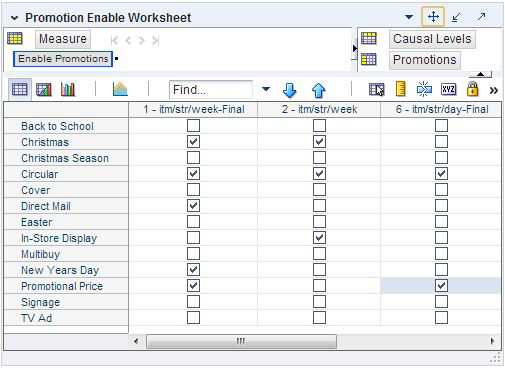
The Promotion Enable view allows you to enable or disable a promotion for the causal forecast levels. The Promotion Enable view is built at the hierarchy intersections of the promotion variables and the causal levels selected during the wizard process.
The Promotion Enable view contains the following measure:
Enable Promotions
This is a read/write Boolean measure. The Enable Promotions measure allows you to enable a subset of promotions for a certain causal forecast level. It defaults to True for all causal forecast levels.
|
Note: Exponential promotions and Real promotions can not be enabled at the same time for the same level. In another word, Real promotions and Exponential promotions are not valid combinations. The valid promotion combinations are Boolean and Exponential promotions, as well as Boolean and Real promotions.Each promotion's type is defined in the Configuration Tool. For additional information, see "Promotion Variables". |
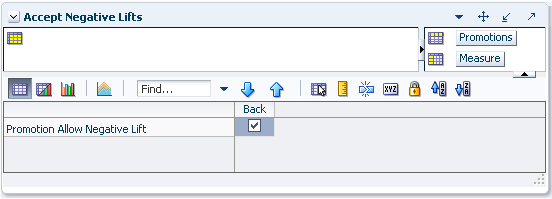
The Accept Negative Lift view allows you to specify whether a promotion is allowed to have negative effect. The Promotion Enable view is built at the hierarchy intersections of the promotion variables selected during the wizard process.
The Accept Negative Lift view contains the following measure:
Promotion Allow Negative Lift
This is a read/write Boolean measure. The Promotion Allow Negative Lift measure allows you to specify whether a promotion is allowed to have negative effect. When this measure is set to False for a promotion, the forecast engine does not allow that promotion to have any negative lift (Effect < 1). It defaults to True for all promotions.
The Promo Effect Maintenance task provides a view to the system-calculated and adjusted lift effects. You can edit effects at any product/location intersection and determine how these changes are factored into the promotional models. The Promo Effect Maintenance task contains one view. There may be multiple versions of this view, defined at various causal levels.
This task includes these views:
To build the Promo Effect Maintenance workbook, perform these steps:
Click the New Workbook icon in the Promo Effect Maintenance task in the Event Planning activity.
The Workbook wizard opens. Select the causal final level and click Next.
Select the promotion events to include and click Next.
|
Note: If RDF detects cross-promotional effects for your selected causal level, then RDF uses those promotions and the wizard skips to "Workbook Wizard: Select Products". |
Select the products you want to work with and click Next.
Select the locations you want to work with and click Finish.
The Promo Effect Maintenance workbook is built.
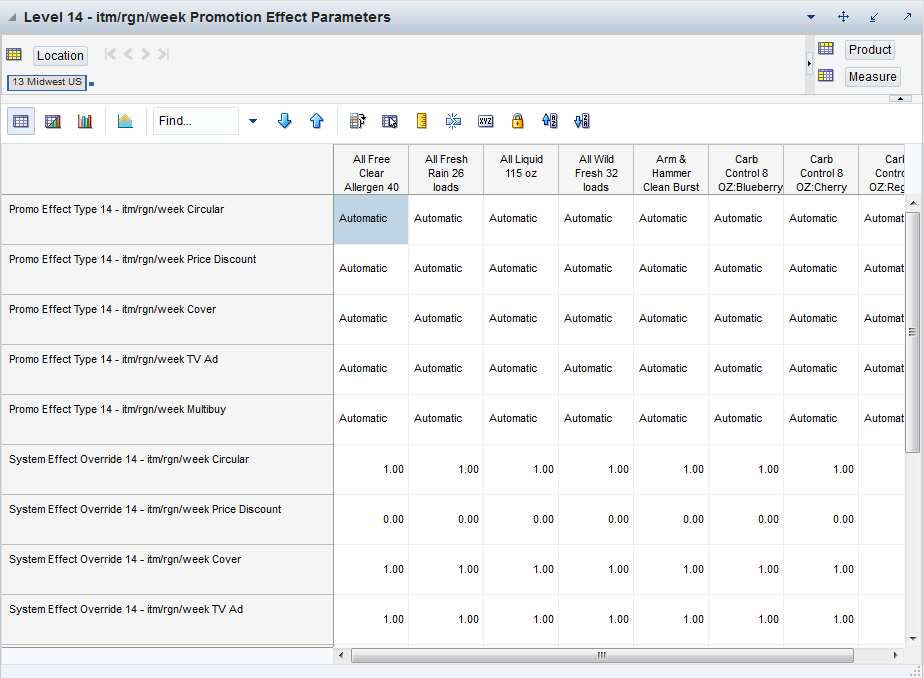
The Promotion Effect Parameters view allows you to view and modify the system-calculated effects of a given promotion at the causal source level.There is one view for every causal source level.
|
Note: Changes that are committed in the Promo Effect Maintenance task are not incorporated into the forecast until another forecast is generated in RDF batch forecast process. |
The Promotion Effect Parameters view contains the following measures:
Promo Effect Type
Causal variable types define how causal variables are treated in the causal model-fitting process (which includes a call to the lower-level regression engine) and the forecast generation process where the model is used to extend the forecast over the forecast horizon. Table 13-3 lists the options.
System Calculated Effect
The System Calculated Effect is a read-only measure indicating the lift effect generated by the system.
System Effect Override
The user-specified lift effect. This user-entered effect is active if used in conjunction with the Override All and Override Future Only Promotion Effect Types. Otherwise, it equals 1.00.
Table 13-2 Promo Effect Types
| Causal Variable Type | Description |
|---|---|
|
Automatic |
The inclusion of the Promo Effect is decided by regression. If the Promo Effect is found to be significant on the training set, it is included in the model. Otherwise, it is rejected. Automatic is the system default Promotion Effect Type. |
|
Forced In |
The Promo Effect is forced in to the model, thus regression is not given a choice to reject even if the effect is considered insignificant by regression. As a result, we will always return an effect even if it has a negative impact to the demand forecast. |
|
Disabled |
The variable is excluded from the model, hence no effect is returned either. |
|
Override All |
This type allows you to specify a causal effect that is used during the forecasting process. For Promo Effects specified as Override All, you also specify the corresponding causal effect in the Promotion Effect Override. The causal engine de-causalizes the training data using the user-specified effect. During forecast generation, the user-specified effect is used to determine the causal forecast. Therefore, you must change the Promotion Effect Type when this user-specified effect is no longer to be used. |
|
Override Future Only |
This type allows you to specify a causal effect that is used during the forecasting process. For Promo Effects specified as Override Future, you also specify the corresponding causal effect in the Promotion Effect Override. The calculated effect is not written back to the effects measure, but it is used to de-causalize the data. During forecast generation the calculated effect is ignored, and, instead, the user-specified effect is used to produce a causal forecast. Therefore, you must change the Promotion Effect Type when this user-specified effect is no longer to be used. |
|
Override from Higher Level |
This promotion type is used in conjunction with the Causal Higher Intersection set in the Forecast Administration Workbook. If the Causal Higher Intersection is not specified, no promotional effect is calculated. It allows the system to use the geometric mean of causal effects computed from product/location combination in the same group (the intersection level specified in the Causal Higher Intersection during system setup) for product/location combinations for which from sales history alone a causal effect is unable to be computed for that Promo Effect. The way the system handles this, is by having the override effects measure filled in with higher-level effects for those variables specified as Override Higher Level. During forecast generation the effect calculated as average of low level effects is used to produce a causal forecast. Note that if no effects are found for any of the product/locations in the Causal Higher intersection group, then the system uses the geometric mean of causal effects calculated from all Product/Locations as the override effect being passed in. |
|
Automatic Boolean |
If the promotion variable is always be set to 0.00 or 1.00 (meaning inactive or active, respectively), this type produces the same results as the Automatic type; however, Automatic Boolean improves the performance (speed) of the forecasting engine during the batch run of the forecast. |
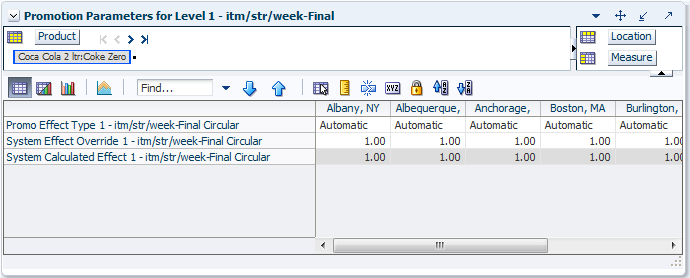
The Promotion Parameters view allows you to view and modify the system-calculated effects of a given promotion.
|
Note: Changes that are committed in the Promo Effect Maintenance task are not incorporated into the forecast until another forecast is generated in RDF batch forecast process. |
The Promotion Parameters view contains the following measures:
Promo Effect Type
Causal variable types define how causal variables are treated in the causal model-fitting process (which includes a call to the lower-level regression engine) and the forecast generation process where the model is used to extend the forecast over the forecast horizon. Table 13-3 lists the options.
Blended Promo Effect
This measure is registered for each promotion. This is the value for the promotion effect that was used to create the forecast if no override is specified. Depending on the administration and maintenance settings it can be one of the following:
Item/store calculated effect
Source (pool) calculated effect
A combination of the two. The way the two effects are combined can also be determined by the user by specifying a blending parameter.
System Calculated Effect
The System Calculated Effect is a read-only measure indicating the lift effect generated by the system.
System Effect Override
The user-specified lift effect. This user-entered effect is active if used in conjunction with the Override All and Override Future Only Promotion Effect Types. Otherwise, it equals 1.00.
Table 13-3 Promo Effect Types
| Causal Variable Type | Description |
|---|---|
|
Automatic |
The inclusion of the Promo Effect is decided by regression. If the Promo Effect is found to be significant on the training set, it is included in the model. Otherwise, it is rejected. Automatic is the system default Promotion Effect Type. |
|
Forced In |
The Promo Effect is forced in to the model, thus regression is not given a choice to reject even if the effect is considered insignificant by regression. As a result, we will always return an effect even if it has a negative impact to the demand forecast. |
|
Disabled |
The variable is excluded from the model, hence no effect is returned either. |
|
Override All |
This type allows you to specify a causal effect that is used during the forecasting process. For Promo Effects specified as Override All, you also specify the corresponding causal effect in the Promotion Effect Override. The causal engine de-causalizes the training data using the user-specified effect. During forecast generation, the user-specified effect is used to determine the causal forecast. Therefore, you must change the Promotion Effect Type when this user-specified effect is no longer to be used. |
|
Override Future Only |
This type allows you to specify a causal effect that is used during the forecasting process. For Promo Effects specified as Override Future, you also specify the corresponding causal effect in the Promotion Effect Override. The calculated effect is not written back to the effects measure, but it is used to de-causalize the data. During forecast generation the calculated effect is ignored, and, instead, the user-specified effect is used to produce a causal forecast. Therefore, you must change the Promotion Effect Type when this user-specified effect is no longer to be used. |
|
Override from Higher Level |
This promotion type is used in conjunction with the Causal Higher Intersection set in the Forecast Administration Workbook. If the Causal Higher Intersection is not specified, no promotional effect is calculated. It allows the system to use the geometric mean of causal effects computed from product/location combination in the same group (the intersection level specified in the Causal Higher Intersection during system setup) for product/location combinations for which from sales history alone a causal effect is unable to be computed for that Promo Effect. The way the system handles this, is by having the override effects measure filled in with higher-level effects for those variables specified as Override Higher Level. During forecast generation the effect calculated as average of low level effects is used to produce a causal forecast. Note that if no effects are found for any of the product/locations in the Causal Higher intersection group, then the system uses the geometric mean of causal effects calculated from all Product/Locations as the override effect being passed in. |
|
Automatic Boolean |
If the promotion variable is always be set to 0.00 or 1.00 (meaning inactive or active, respectively), this type produces the same results as the Automatic type; however, Automatic Boolean improves the performance (speed) of the forecasting engine during the batch run of the forecast. |
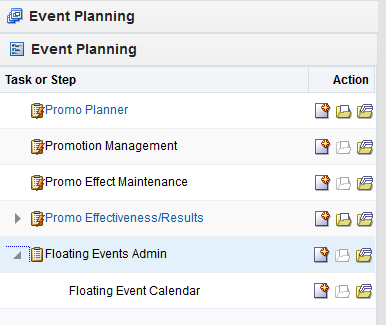
This section describes managing events and holidays for forecast generation in RDF using the Floating Events Admin Workbook.
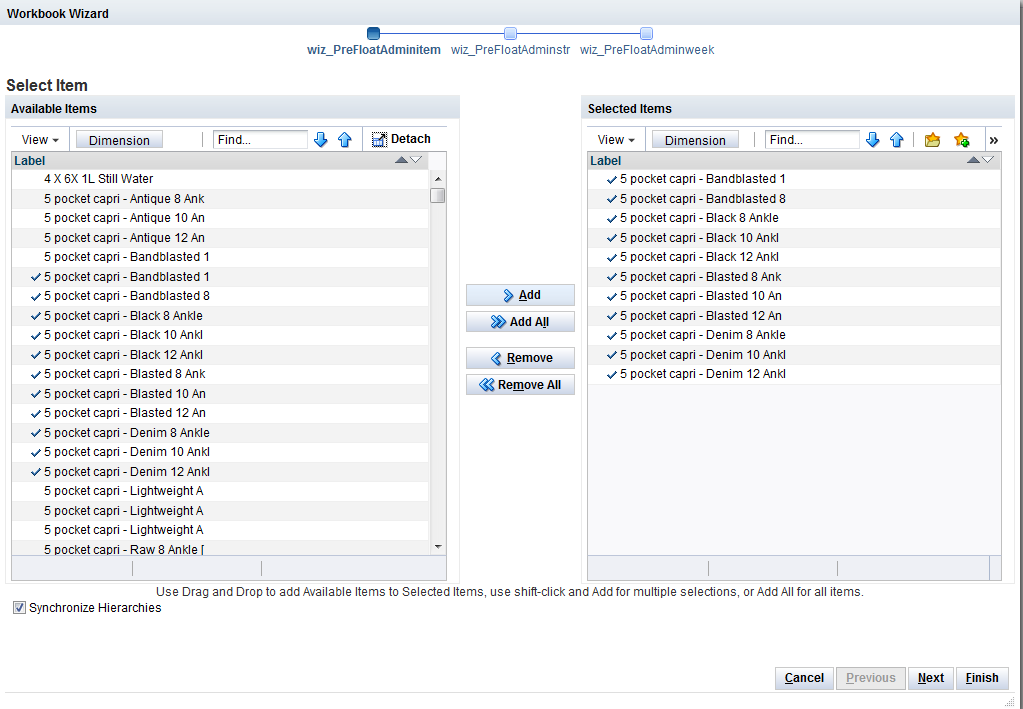
To build the Floating Events Admin workbook, perform these steps:
Click the New Workbook icon in the Floating Events Administration task in the Event Planning activity.
The Workbook wizard opens. Select the specific products that you want to view and click Next.
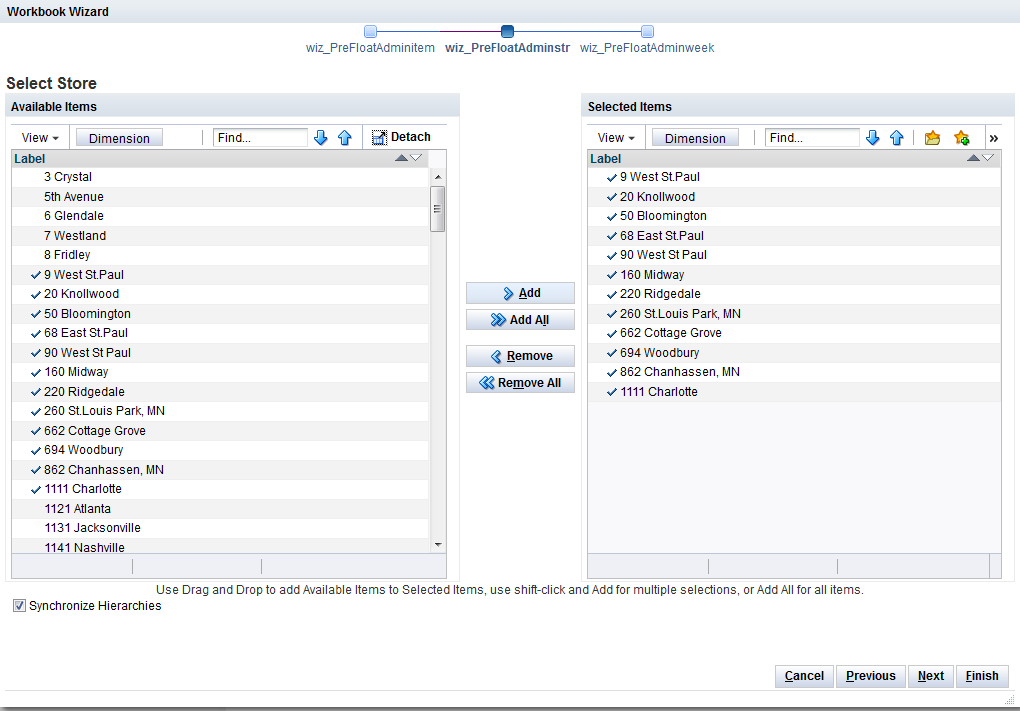
Select the specific stores that you want to view and click Next.
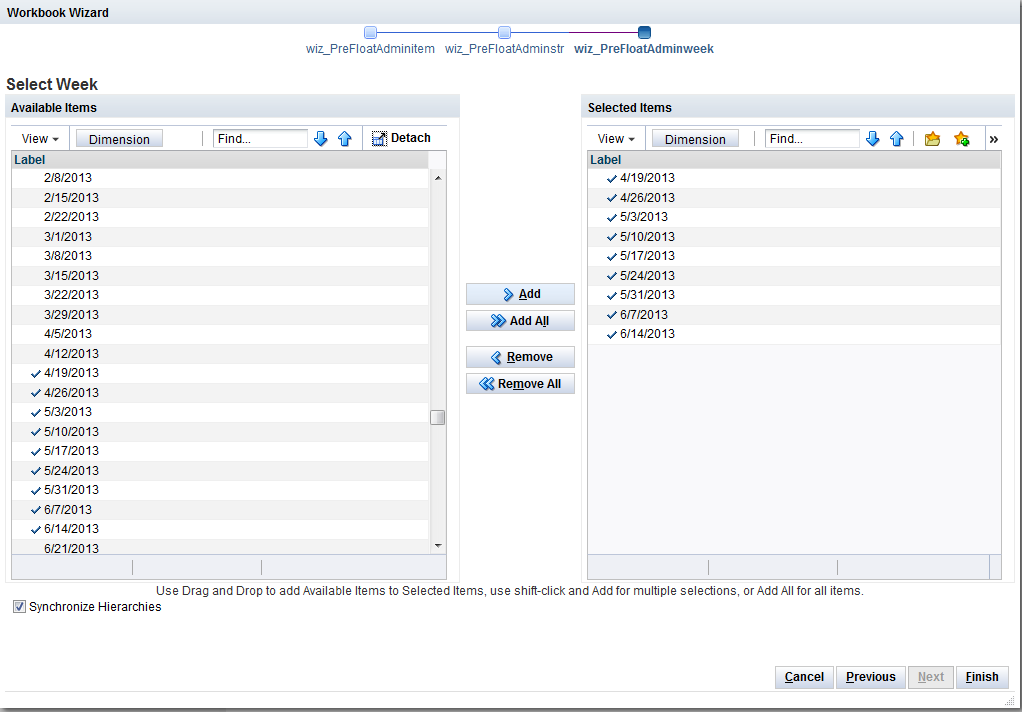
Select the weeks you want to work with and click Finish.
The Floating Events Admin workbook is built.
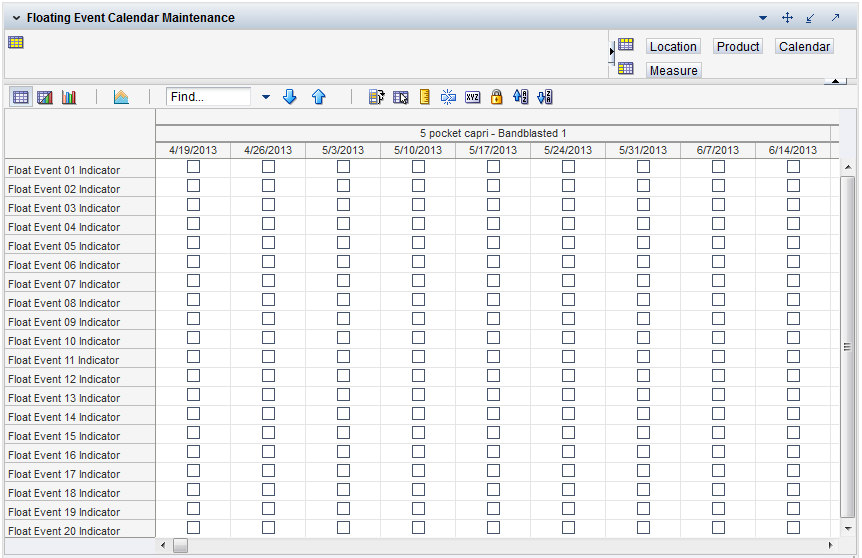
The Floating Event Calendar Maintenance view allows you to flag periods when certain product/location combinations are active during an event.
In this task you can perform every step necessary to plan promotions. You can determine which events should be active, the value of the price discount, review and possibly overwrite causal effects, and run simulations to evaluate the plan.
The simulations are a very useful tool to determine how effective a promotion is. For instance, an item with a price discount of 25% and advertised in a flyer may yield a lift of 150%. The same item, with the same price discount, advertised in a flyer, and on radio, yields a lift of 155%. The user has the information to decide if the cost of the radio ad is worth the extra 5% increase in sales.
Once you decide on the setup for the promotion, based on the what-if simulations, the information can be committed and the next forecast batch generates the baseline and lifts that are exported to downstream applications, such as replenishment solutions.
To build the Promotion Effectiveness workbook, perform these steps:
Click the New Workbook icon in the Promotion Effectiveness task in the Event Planning activity.
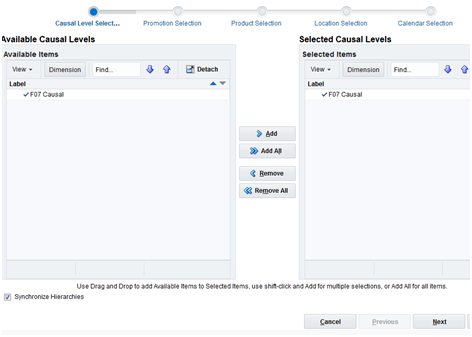
The Workbook wizard opens. Select the causal final level and click Next.
Select the promotion events to include and click Next.
Select the products you want to work with and click Next.
Select the locations you want to work with and click Next.
Select the periods you want to work with and click Finish.
The Promotion Effectiveness workbook is built.
This workbook has two steps:
The Promotional Parameters step has several views:
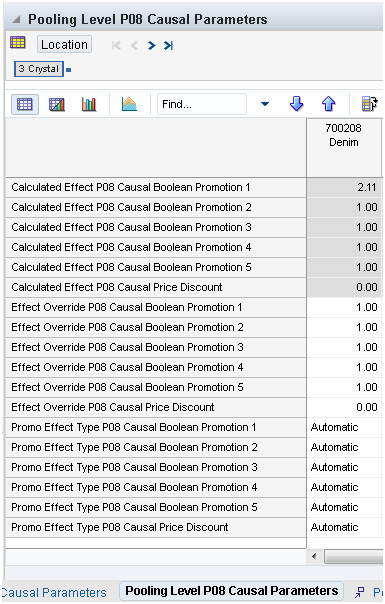
In this step, you can review all the information related to promotion effects. For example, you can check the calculated effects at the final as well as pooling levels. You can decide if the calculated effects need to be adjusted, and how to combine final level and pooling level effects to create a robust causal forecast.
The views in this Promotional Parameters step give you the tools to build the blocks necessary to build a robust and accurate causal forecast.
Good item: blend param -> 0
Bad item: blend param -> 1
New item: get pooling
Item not new, but never promoted: get pooling effect
This view contains three measures.
The Default Causal Parameters view contains the following measures:
Default Blending Parameter
This parameter sets the weights for combining the Final and Source Level promotion effects, when calculating the blended effect. The range of the parameter is 0 to 1. A value closer to 1 will yield a blended effect closer to the Pooling Level effect. You pick a high value if you want t robust causal forecast, although the final level promotion information is not very reliable. A value closer to zero yields an effect closer to the Final Level effect. You pick a low value if the final level promotion information is accurate and you want the causal forecast to reflect item-specific effects.
The measure can also be edited in the Forecast Administration workbook, and can be overridden in the Forecast Maintenance workbook.
Default Source Level
The list of values displayed in this field allows you to change the pooling level that is used for calculating the blended effect. The pooling levels are set up in the RPAS Configuration Tools. A value from the pick list is required in this field at the time of forecast generation.
The measure can also be edited in the Forecast Administration workbook, and can be overridden in the Forecast Maintenance workbook.
Default Overlapping Promotions Adjustment Factors
This Default Overlapping Promotion Adjustment Factor specifies at a high level how the individually calculated promotions interact with each other when they are overlapping in the forecast horizon. This parameter serves as a global setting, but can be overridden at lower levels. The default value is 1.
A value greater than 1 means the promotion effects will be compressed when applied in the model, instead of linearly summing up to get the total promotion effect. The larger the value is, the larger the compression effect will be, meaning the smaller the total effect will be.
A value between 0 and 1 means the promotion effects will be amplified when applied in the model, instead of linearly summing up to get the total promotion effect. The smaller the value is, the larger the amplification effect will be, meaning the larger the total effect will be.
If a value less than or equal to 0 is put in the cell, the calculation engine will find the best adjustment factor to fit the history data. This factor is then used to combine overlapping promotions in the forecast horizon. With few exceptions, the value should be anywhere from 1 to 5. This factor is then used to combine overlapping promotions in the forecast horizon.
The measure can also be edited in the Forecast Administration workbook.
|
Caution: The process to find the best adjustment factor can be time consuming and introduce performance issues. |
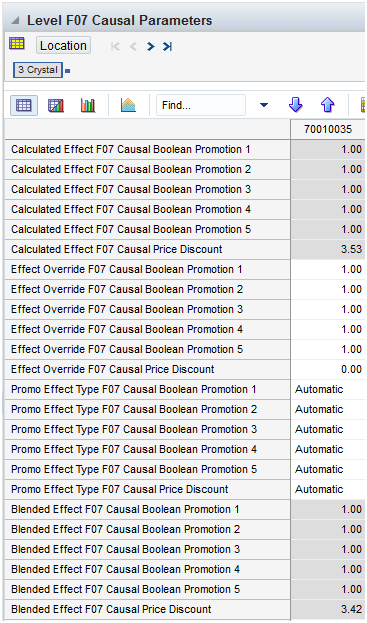
This view includes all the information available in the Final Level Causal Effect Parameters in the Promo Effect Maintenance workbook.
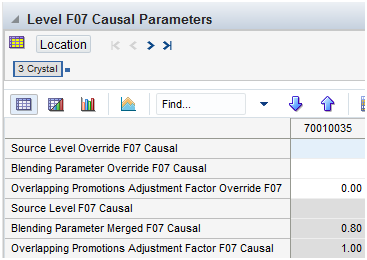
Additionally there are a few measures (shown in Figure 13-41) that when used together with the ones in Figure 13-42 give total flexibility to you to generate the causal forecast you want.
All of these measures are described and are available for editing in the Forecast Administration workbook.
The Promotional Forecast step has several views:
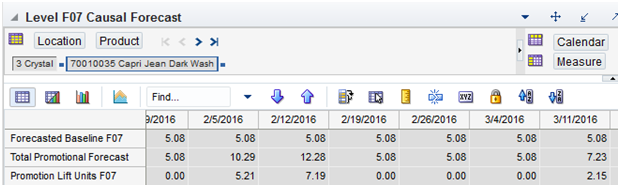
The Causal Forecast view allows you visibility to the baseline and promotion lifts components of the forecast. This is the place you review the impact of the promo-related parameters set in the Promotions and Promotion Parameters views. The process of changing parameters, re-generating the promo forecast, and reviewing the impact in this view, implements the promotional What-if functionality.
The Causal Forecast view contains the following measures:
Forecasted Baseline
The Forecast Baseline is a forecast generated on past sales data that contains no promotions (that is, normal demand given no causal effects).
Promotion Lift Units
This measure displays the total effect that promotions can have on an item's sales units. It includes the effects of all the promotions active for that time period, as well as the price effect.
Total Promotional Forecast
This measure displays the sum of the baseline and the promotion lift.
Custom Menu: Calculate Forecast
The Promotional Forecast step has a custom Menu which implements the forecast simulation (what-if). First, it calculates the promotional lifts based on the effects set in the Promotional Parameters step. Then it applies the effects on top of the baseline to create the Total Promotional Forecast.
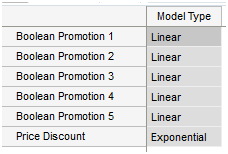
Figure 13-46 displays the Promotion Model Type view.
The Promotion Model Type view contains the following measure:
Model Type for Promotional Variable
This measure stores the model type for the selected promotion variables. The choices are exponential and linear. An exponential model type is displayed if the promotion type is exponential. A linear model type is displayed when the promotion types are Real or Boolean.
For additional information, see "Promotion Variables."
The Promotions view allows you to review and enable or disable promotions for item/locations for desired periods. Once the changes in the promo calendar have been made, click Calculate to update the forecast values in the Promotional Forecast view.
The promotions must be enabled for the chosen causal level.Note that multiple Promotions views are possible. Namely, there is one view for every distinct promotion intersection. Promotions with identical intersections are displayed in the same view.
The Promotion Calendar view contains the following measure:
Promotion Variables
Promotion Variables are defined as either Boolean, Exponential, or Real types during the configuration process in the Promote Plug-In. Refer to the Oracle Retail Demand Forecasting Configuration Guide for additional details on configuring the Promote solution.
For additional information, see "Promotion Variables."