| Oracle® Retail Demand Forecasting User Guide for the RPAS Fusion Client Release 16.0 E91109-03 |
|

 Previous |
 Next |
| Oracle® Retail Demand Forecasting User Guide for the RPAS Fusion Client Release 16.0 E91109-03 |
|
Previous |
Next |
After the forecast is generated, the next steps in the forecasting process are analysis and approval. Approval of forecasts is required before the forecast data can be exported to other processes, such as replenishment programs. The Forecast Approval task allows you to view, analyze, adjust, and approve forecast results.
Some system forecasts may be set to be automatically approved by the system. The default approval method for items in a forecast is set in the Forecast Administration Workbook, and these policies can be amended for individual product/location combinations in the Forecast Maintenance Workbook. Any forecasts not set to Automatic Approval may require evaluation, adjustments, and ultimately approval before subsequent processes are executed.
You can view and analyze forecast data at multiple forecast levels (source-level and final-level) simultaneously. Revisions to and approvals of final-level forecast values are made on the appropriate views in the Forecast Approval task. The Forecast Approval task can contain these views:
Table 12-1 Views for the Forecast Approval Workbook
| View | Description |
|---|---|
|
|
This view displays all the regular price and promotional forecasting components |
|
|
This view allows you to review final-level system-forecast quantities and make revisions to them if needed. |
|
|
This view allows you to specify the manual approval policy of forecasts by product and location. |
|
|
This view allows you to review the partition dimensions in which the generated forecast was run. |
|
|
This view displays the system-generated source-level forecast and allows you to compare this data with final-level forecast values. |
|
Final or Source System Parameters View |
The Final System Parameters view is only available if Generate System Parameters or Generate Methods is turned on in the Forecast Administration Workbook. The Source System Parameters view is only available if Generate System Parameters or Generate Methods is turned on in the Forecast Administration Workbook, and a Source Level was designated in Forecast Administration. |
When the Forecast Approval task is displayed, you may review the system-generated forecast and measures for any levels included in the task and make adjustments to forecast values at the final-level. Forecast values are overwritten in the Adjusted Forecast measure on the Final Forecast view. Approvals are made for each product/location combination in the Approval Method measure of the Forecast Approval view.
After you complete your work, you can save the task using the Save function on the File menu. To update the master database with the approved forecast values, you must commit the task using the Commit Now or Commit Later option on the File menu. Once the task is committed, the forecast values are stored in the master database and can be used by other processes.
To build the Forecast Approval workbook, perform these steps:
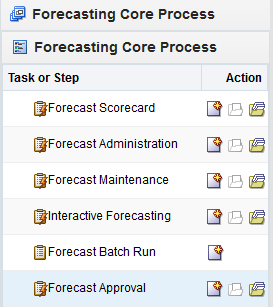
Click the New Workbook icon in the Forecast Approval task in the Forecasting Core Process activity.
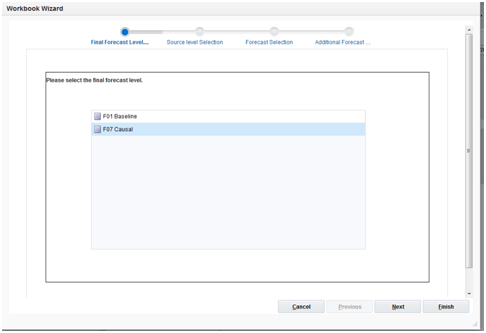
The Workbook wizard opens. Select the final forecast level you want to work with and click Next.
|
Note: In the Source Level wizard, the source levels for a Causal Final Level are not displayed, only the Causal Final Level is displayed. |
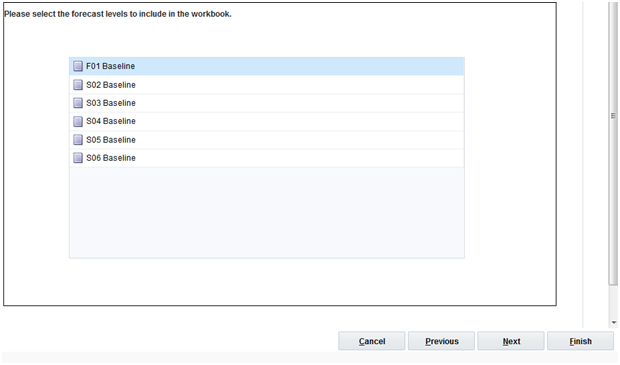
Select the forecast levels you want to work with and click Next. Select as many forecast levels as necessary for comparison.
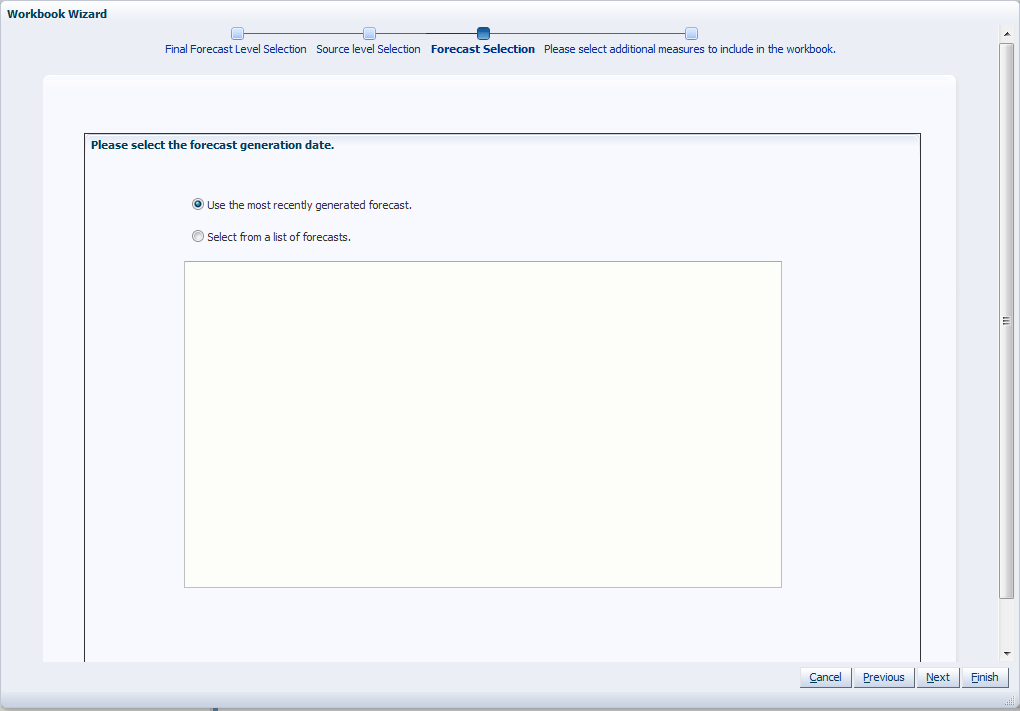
Select the forecast generation date you want to work with and click Next.
Select Use the most recently generated forecast to build a task containing the most recent forecast values.
|
Note: Use the most recently generated forecast - it must be selected if the task supports an AutoTask build. |
Click Select from a list of forecast to select from a list of previously generated forecasts stored in the system. Note that if this option is selected, the system automatically highlights the first forecast in the list, and if no further selections are made by you, this first forecast is used.
If no selection is made by you, the birth date defaults to the latest generated generation ID.
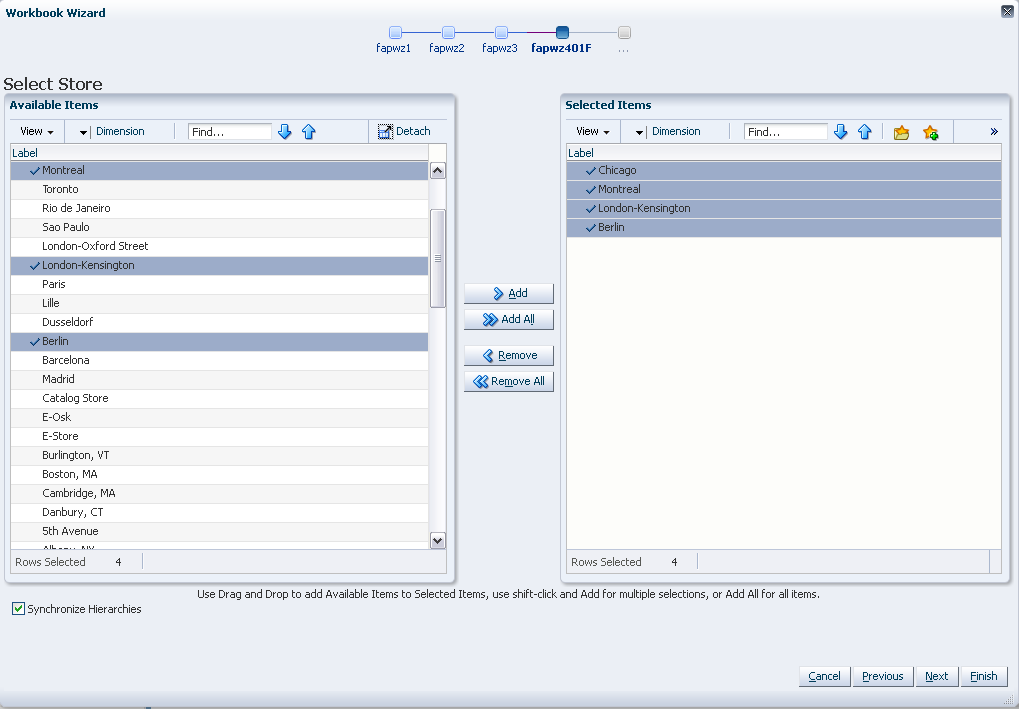
Select the stores you want to work with and click Next.
|
Note: It is important to include all locations that are members of the location dimensions in the forecast levels to be analyzed. For example, if you select to view a forecast level that is defined at item/chain/week, you should include all locations that are members of the particular chain to be analyzed. It is recommended that Position Query functionality or selection from aggregate levels in the Location hierarchy is employed if the task is generated using AutoTask build. |
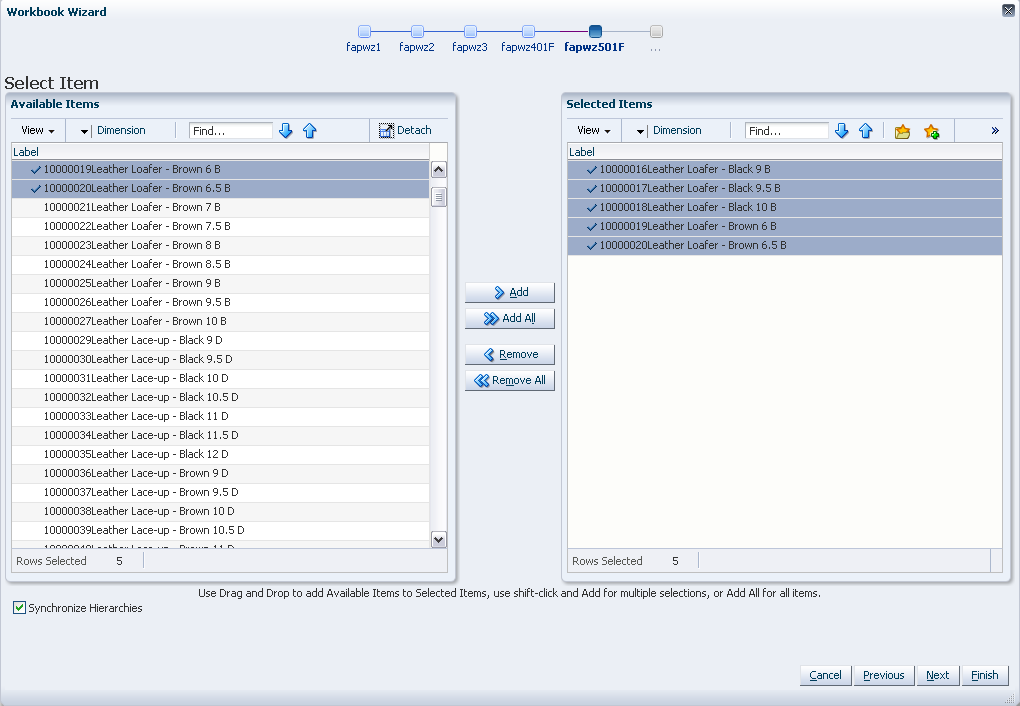
Select the items you want to work with and click Next.
|
Note: It is important to include all products that are members of the Merchandise dimensions in the forecast levels to be analyzed. For example, if you select to view a forecast level that is defined at subclass/store/week, you must include all items that are members of the particular subclass to be analyzed. It is recommended that Position Query functionality or selection from aggregate levels in the Merchandise hierarchy is employed if the task is generated using AutoTask build. |
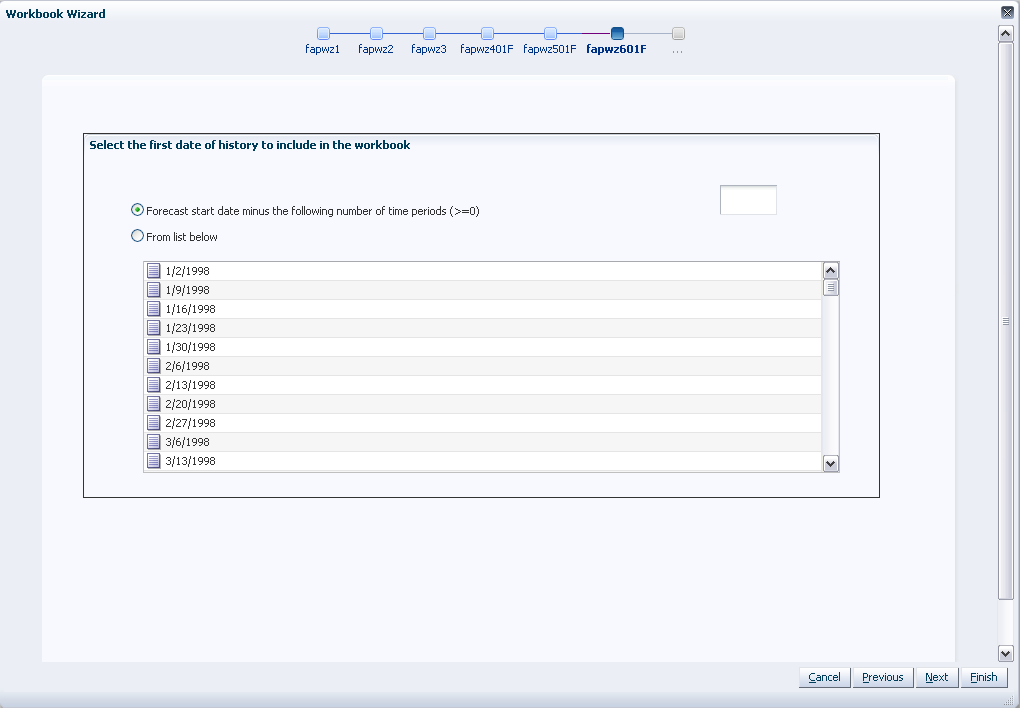
Select the first date of history you want to work with and click Next.
You may choose to either set the Forecast Start Date minus the number of periods or select the first date of history from the displayed list. It is recommended that the Forecast Start Date minus the number of periods is set if the task is generated using AutoTask build.
|
Note: If you make no selection, the system uses the forecast start date. |
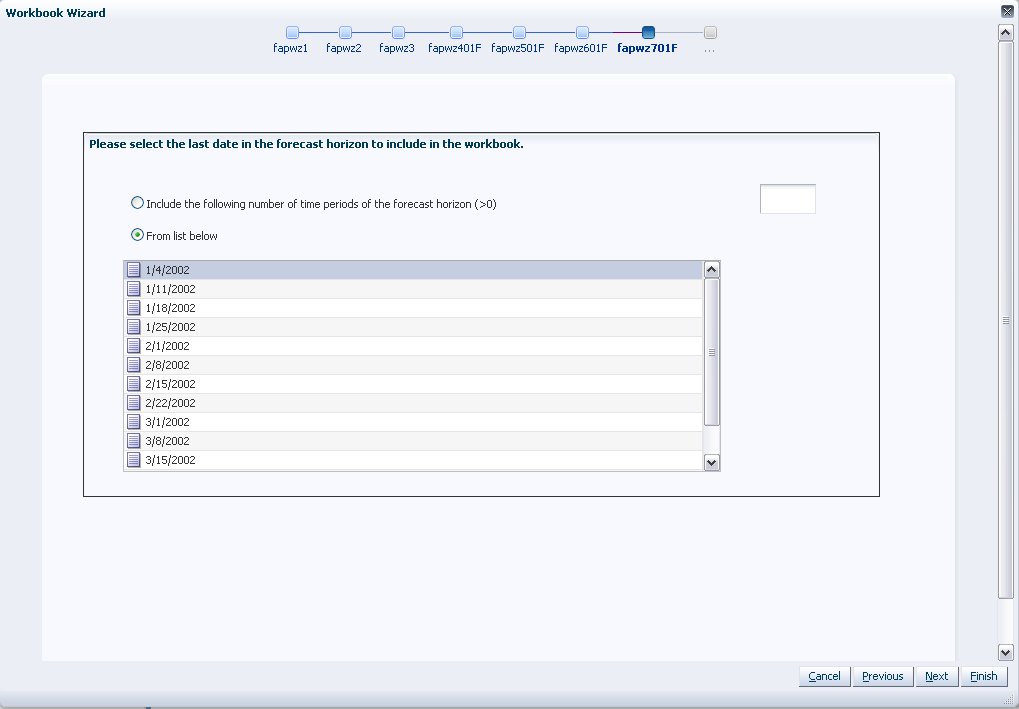
Select the last date in the forecast horizon you want to work with and click Next.
You may either choose to Include the following number of time periods of the forecast horizon or select the last date to include of the horizon from the displayed list. It is recommended that Include the following number of time periods of the forecast horizon is set if the task is generated using AutoTask build. The value entered must be within the forecast horizon. Click Next.
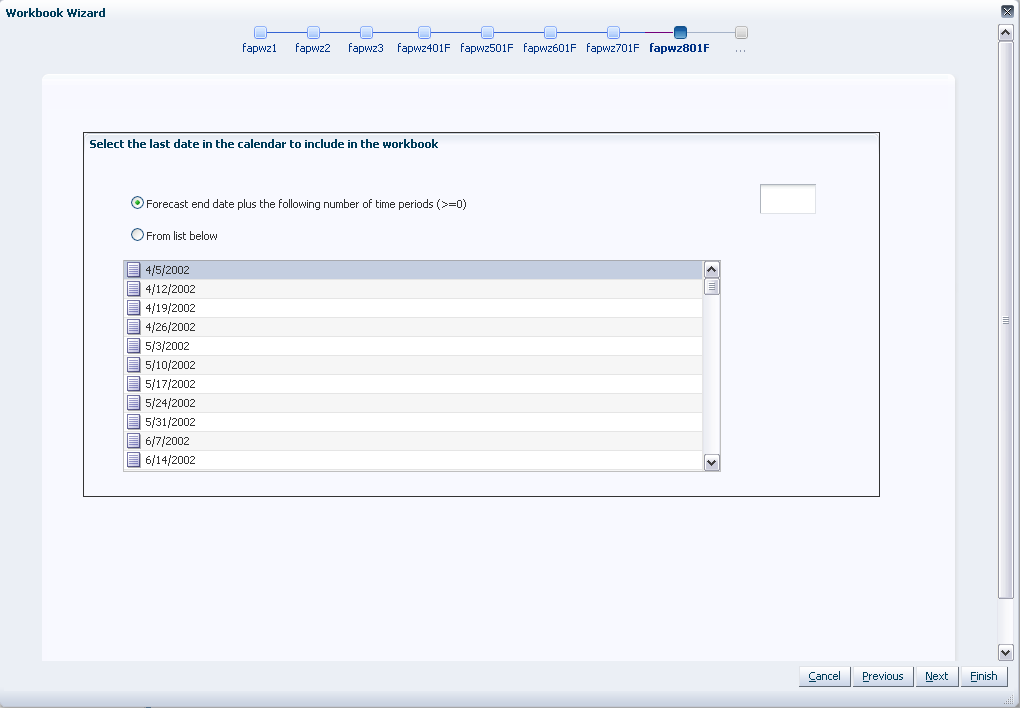
Select the last date in the calendar you want to work with and click Next.
You may choose to either set the Forecast end date plus the following number of time periods or select the last date to include of the post-horizon calendar from the displayed list. It is recommended that Forecast end date plus the following number of time periods is set if the task is generated using AutoTask build. Click Next.
|
Note: If you make no selection, the system uses the last date in the forecast horizon chosen by you in the previous wizard window. |
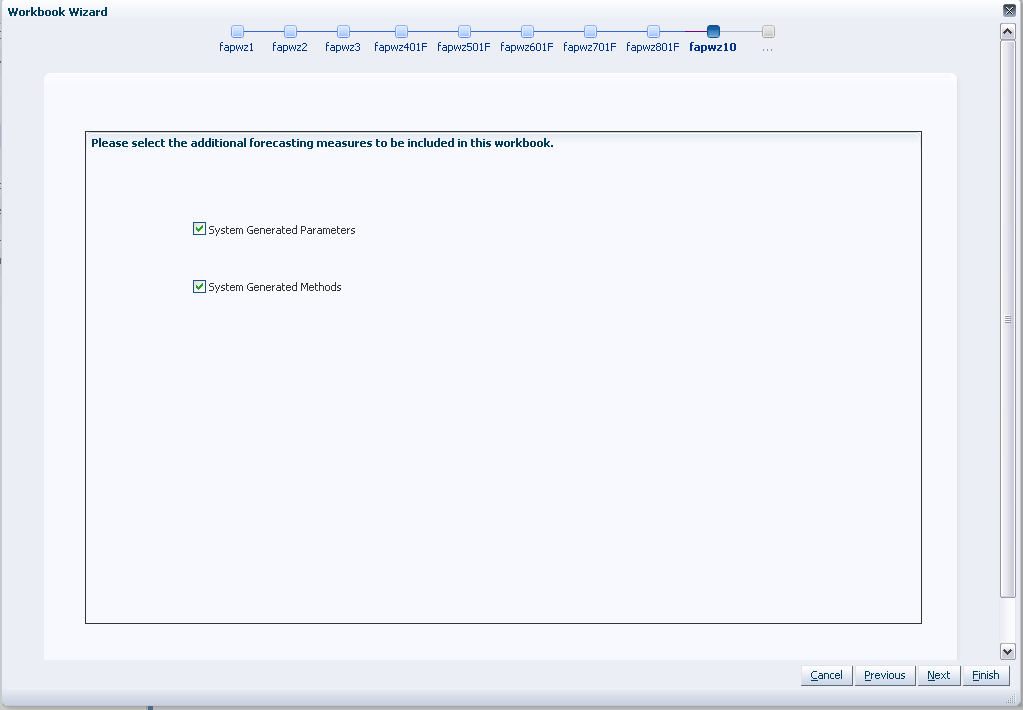
Select any additional forecast measures you want to work with in your task. The valid values of these measures may only be viewed if Generate Intervals, Generate Cumulative Intervals, Generate Methods, Generate Parameters, Generate Baselines, or Store Interim Forecasts were selected in the Forecast Administration Workbook. Click Finish.
|
Note: If any of these parameters are included in the Forecast Approval task using AutoTask build and are later deselected for generation in the Forecast Administration Workbook, AutoTask must be set again. |
The Forecast Approval workbook is built.
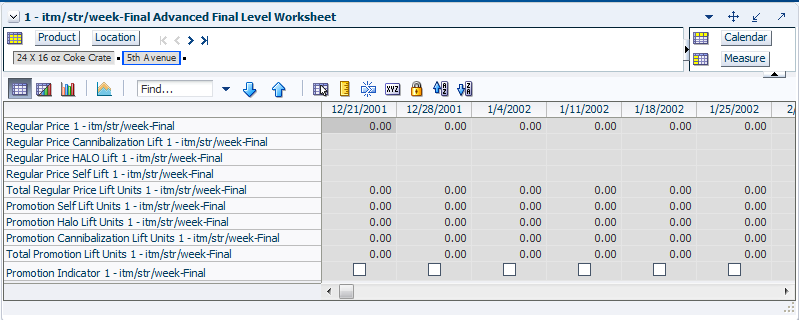
This view displays all the regular price and promotional forecasting components. These include Self Lifts, as well as Halo and Cannibalization Effects for Regular Price and Promotions. This information is read-only.
The Advanced Final Level view contains the following measures:
Promotion Cannibalization Lift Units
This measure displays the negative effect, measured in units, that the promotion of certain items has on this item. The Default Apply Interaction Factor is set to True and the Default Interaction Factor is set to a value other than 1.When the Interaction function is enabled, you should expect to see the displayed lift unit adjusted by the Interaction Factor calculation.
Promotion Halo Lift Units
This measure displays the positive effect, measured in units, that the promotion of certain items has on this item.If the Default Apply Interaction Factor is set to True and the Default Interaction Factor is set to a value other than 1, the displayed lift is the result of the combination of various lift types.When the Interaction function is enabled, you should expect to see the displayed lift unit adjusted by the Interaction Factor calculation.
Promotion Indicator
If this measure is checked (True), it indicates that a given item/location has any promotion active for a time period
Promotion Self Lift Units
This measure displays the effect that a promotion has on the sales units of an item.If the Default Apply Interaction Factor is set to True and the Default Interaction Factor is set to a value other than 1, the displayed lift is the result of the combination of various lift types.When the Interaction function is enabled, you should expect to see the displayed lift unit adjusted by the Interaction Factor calculation.
Regular Price
This measure displays the price for which the item has sold at the given store. This is a time-phased measure, and you can see how a change in price drives the regular price effects.
Regular Price Cannibalization Lift
This measure displays the negative effect, measured in units, that a price change of certain items has on this item. If the Default Apply Interaction Factor is set to True and the Default Interaction Factor is set to a value other than 1, the displayed lift is the result of the combination of various lift types.When the Interaction function is enabled, you should expect to see the displayed lift unit adjusted by the Interaction Factor calculation.
Regular Price Halo Lift
This measure displays the positive effect, measured in units, that a price change of certain items has on this item. If the Default Apply Interaction Factor is set to True and the Default Interaction Factor is set to a value other than 1, the displayed lift is the result of the combination of various lift types.When the Interaction function is enabled, you should expect to see the displayed lift unit adjusted by the Interaction Factor calculation.
Regular Price Self Lift
This measure displays the effect that a price change has on the sales units of an item. If the Default Apply Interaction Factor is set to True and the Default Interaction Factor is set to a value other than 1, the displayed lift is the result of the combination of various lift types.When the Interaction function is enabled, you should expect to see the displayed lift unit adjusted by the Interaction Factor calculation.
Total Promotion Lift Units
This measure displays the total effect that promotions can have on an item's sales units. It is the combination of Promotion Self Lift Units, Promotion Halo Lift Units and Promotion Cannibalization Lift Units. The default way to combine the promotional lifts is to sum them up. However, if the Default Apply Interaction Factor is set to True and the Default Interaction Factor is set to a value other than one, the Total Promotion Lift Units is not the straight summation of the three promotion lift measures.
|
Note: If the measure, Apply Promotional Lift Override, is selected in the Advanced Final Level Parameters View, then RDF ignores the system calculated lifts and applies the Aggregated Promotion Lift Override. It only applies the override in the week that has a promotion. |
Total Regular Price Lift Units
This measure displays the total effect that regular price changes can have on an item's sales units. It is the sum of Regular Price Self Lift, Regular Price Halo Lift, and Regular Price Cannibalization Lift.
The Final Level view allows you to review the forecast quantities and make adjustments to forecasts if needed. The primary objective in the Forecast Approval task is to review and edit forecast values using the Adjusted Forecast field on the Final Level view and ultimately approve forecasts that have been user-adjusted or require manual approval.
The Final Level view contains the following measures:
Adjusted Cumulative Interval
When changes are made to the Adjusted Forecast, the value of the Forecast Cumulative Interval is recalculated in this measure. The values in this measure are read-only. To view and store this measure:
Generate Cumulative Intervals must be selected in the Forecast Administration Workbook.
Cumulative Intervals must be selected to be viewed in the Forecast Approval wizard.
Adjusted Forecast
The value in this field initially defaults to the System Forecast if the forecast is automatically approved by the system or through a Forecast Approval Alert. Otherwise, the value in the Adjusted Forecast is different than the System Forecast if:
Adjusted Forecast has been updated by you.
Keep Last Changes is set to Total, Difference or Ratio.
Update Last Weeks Forecast is set to Replicate.
Changes to the Adjusted Forecast are automatically approved. The Approval view updates with the date of the adjustment and the name of the user who made the adjustment.
|
Note: Changes to the Adjusted Forecast for periods outside of the forecast horizon are not committed.Edits to any non-committed values in the Forecast Approval Workbook are overwritten when data is refreshed. |
Approved Cumulative Interval
The Approved Cumulative Interval is the cumulative interval that was approved at the time of the task build. The values contained in this measure are read-only. If changes are made to the Adjusted Forecast, the Approved Cumulative Interval reflects the recalculated values when the task is committed and data is refreshed.
Approved Forecast
The Approved Forecast is the forecast quantity that was approved at the time of the task build. The values contained in this measure are read-only. If changes are made to the Adjusted Forecast, then click Calculate to show the new value in the Approved Forecast.
Approved System Forecast
The Approved System Forecast is populated with the last System Forecast approved for a time series:
Approval Method set to Automatic Approval
Approval Method set to a Forecast Approval Alert and the alert is not triggered
Update Last Weeks Forecast is set to Use Forecast
The values in this measure are read-only.
Demand Transference Lift Units
This measure displays the total lift caused by assortment changes. This is a time-phased measure, and you can see how assortment changes drive the demand transference lift in unit.
If the Default Apply Interaction Factor is set to True and the Default Interaction Factor is set to a value other than 1, the displayed lift is the result of the combination of various lift types.When the Interaction function is enabled, you should expect to see the displayed lift unit adjusted by the Interaction Factor calculation.
Forecast Cumulative Interval
Cumulative Intervals are used in safety stock calculation within allocation and replenishment systems. This value is similar to a running total of the Forecast Interval and is read-only. To see this measure:
Generate Cumulative Intervals must be selected in the Forecast Administration Workbook.
Cumulative Intervals must be selected to be viewed in the Forecast Approval wizard.
Forecast Interval
The Forecast Interval is calculated on the particular forecast region as capped standard deviation for some methods. It takes into consideration the system forecast for capping as well.
The forecast interval for any given week i is capped to a maximum of:
Forecast(i) * upperCapRatio
This cap is applied once the interval exceeds the system forecast, and it is applied for every value of the interval after that. The upperCapRatio (Interval Cap Upper Ratio) is a parameter set in the Forecast Administration Workbook.
The forecast interval is capped to a minimum of Forecast(i) * lowerCapRatio whenever the interval is less than this quantity. The lowerCapRatio (Interval Cap Lower Ratio) is another parameter set in the Forecast Administration Workbook.
When forecasts are approved, the corresponding Intervals and Cumulative Interval measures are approved. To see this measure:
Generate Intervals must be selected in the Forecast Administration Workbook.
Intervals must be selected to be viewed in the Forecast Approval wizard.
Forecast vs. Last Approved Forecast Workbook Alert
This measure is the target measure of a real time alert. It compares current forecast with the forecast generated last period, and if the difference is more than a threshold, the alert is triggered which is visible by the different format of the cells.
Forecast vs. Last Year Sales Workbook Alert
This measure is the target measure of a real time alert. It compares forecast with recent/ past sales, and if the difference is more than a threshold, the alert is triggered which is visible by the different format of the system forecast cells. This measure is only relevant for a baseline level.
Causal Peaks Workbook Alert
This measure is the target measure of a real time alert. It compares current forecast with the maximum historical demand. If the difference is positive, the alert is triggered which is visible by the different format of the system forecast cells. This measure is only relevant for a causal level.
History Data
History Data (a read-only measure) is the sales data used to generate the forecast. This allows you to compare Actuals to forecast values. When the task is created, the Data Source measure is copied into History Data.
Interaction Multiplier
The measure displays the interaction factor's impact when the Default Apply Interaction Factor is set to True and the Default Interaction Factor is set to a value other than 1. The value in this field equals to the combined total lift divided by the linearly added up lifts
If Apply Interaction Factor is set to False, or the Interaction Factor is set to 1, the value in this field will equal to 1.
Interim Forecast
The Interim Forecast is the forecast generated at the final-level that is used as the Data Source in Curve to produce the Spreading Profile. This profile determines how the Source Forecast is spread down to the Final Forecast level. The values in this measure are read-only. To see this measure:
Generate Interim Forecast must be selected in the Forecast Administration Workbook.
Interim Forecast must be selected to be viewed in the Forecast Approval wizard.
Last Approved Forecast
The Last Approved Forecast is the approved system forecast value when an approval occurred on a previous batch forecast for the time series. The values contained in this measure are read-only.
Return Forecast
If the Return Forecast option is enabled, this measure displays the units per week that are returned to the store.
System Baseline
This metric is an input to causal forecasting. It is set or specified in the Causal Baseline measure in the Forecast Administration workbook. It can be interfaced in the solution, or, more likely, it is also generated in RDF on another forecast level.It is generated using past sales data that contains no promotions (that is, normal demand given no causal effects).
System Forecast
The System Forecast displays the system-generated forecast for the time series. The values contained in this field are read-only. This measure includes baseline as well as promotional, regular price change, and demand transference lifts, if applicable.
If the Interaction function is enabled, the displayed lift is the result of the combination of various lift types.
If the Interaction function is enabled, the displayed lift is the result of the combination of various lift types.
Total Peak
This measure stores the total lift that an item can have on top of its baseline demand. The total lift is the sum of the Total Promotion Lift Units and other effects that are available to be applied on top of the baseline.
Total Promotion Lift Units
This measure displays the total effect that promotions can have on an item's sales units. A period can have one event active. For example, an item is advertised in a flyer and then the application of the promotion on the baseline is straightforward. However, for a different period the item can be advertised in a flyer, in the store, and have a price discount. Then the total promotion lift is not the straight summation of the three promotion lift measure.
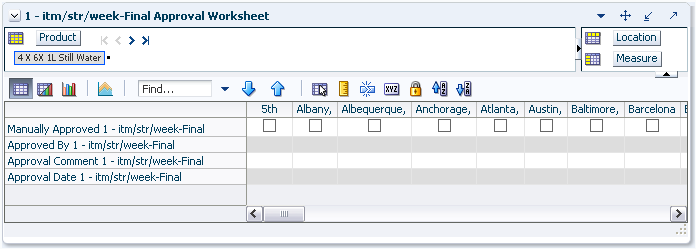
The Forecast Approval view allows for non-adjusted System Forecast to be approved. This view can also be used to view the approval date of forecast values and to display the name of the user that manually approved forecast values for a given product/location combination. The default Approval Method is set in Forecast Administration Workbook, and for product/location combinations that vary from the default, the Forecast Maintenance Workbook can be used.
The Approval view contains the following measures:
Approval Comment
Approval Comment is a field in which notes may be entered regarding the forecast values or any pertinent information for specified product/location combinations.
Approval Date
Approval Date is a read-only field that displays the date that the forecast quantity is approved either automatically during the batch forecast process or when changes are made to the Adjusted Forecast. This information is necessary for RDF to carry out any subsequent processes, such as replenishment procedures.
Approved By
Approved By is a read-only field that displays the name of the user to approve forecasts for an item/location. This field may be populated with Sys if the system was set to automatically approve forecasts during the batch forecast process.
Manually Approved
Manually Approved is a Boolean flag. This field may be checked if you want to accept the System Forecast quantity for a time series that has yet to be approved. The flag is also activated when a change is made to the Adjusted Forecast and Calculate occurs. When this flag is activated, the time series for an item/location are approved and both the Approval Date and Approved By fields are updated.
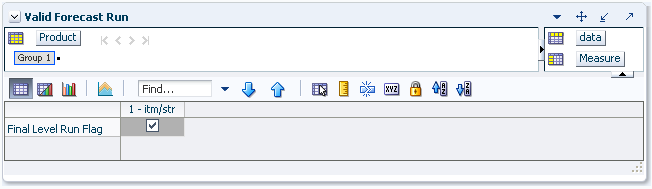
In a global domain environment, the Valid Forecast Run view allows you to identify which Local domains share the forecast birth date selected in the wizard when viewed in the Master domain. If in a Local domain, only the single position of the partition dimension is displayed.
The measure displayed on this view is viewed at the final-level/partition intersection. The Valid Forecast Run view includes the following standard measure:
Final Level Run Flag
The Final Level Run Flag is a read-only Boolean measure. A check (set to True) displayed in this field indicates which positions from the partition dimension had a successful forecast run for the birth date selected in the Forecast Approval wizard.
|
Note: Edits to the Adjusted Forecast can only be committed for partitions that have an activated Final Level Run Flag. |
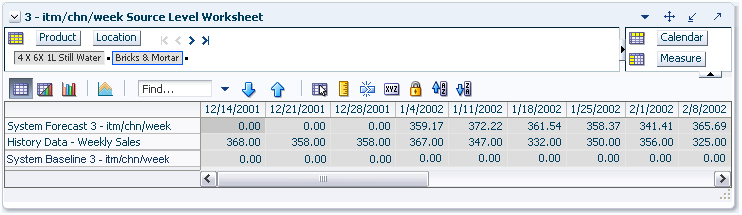
The Source Level view displays the system-generated source-level forecast. Final-level forecast values in the Final Level view can be viewed alongside and compared with their corresponding source-level forecasts.
|
Note: This view is not displayed for causal final levels. |
The Source Level view contains the following measures:
History Data
History Data (a read-only measure) is the sales data used to generate the forecast. This allows you to compare Actuals to forecast values. When the task is created, the Data Source measure is copied into History Data.
System Baseline
The System Baseline is a forecast generated on past sales data that contains no promotions (that is, normal demand given no causal effects). To see a generated Baseline Forecast:
Promote must be implemented.
Generate Baseline must be selected in the Forecast Administration Workbook.
The System Baseline must be selected to be viewed in the Forecast Approval wizard.
System Forecast
The System Forecast displays the system-generated forecast for the time series. The values contained in this field are read-only.
The Final or Source Parameters views allow you to view relevant information for the forecast methods used during forecast generation. The information is different for forecast levels where baseline forecast is generated versus levels where causal is run. These parameters are only available to be viewed if Generate Parameters or Generate Methods are available in the Advanced settings of the Forecast Administration Workbook.
For baseline levels the view shows the alpha, level, and trend parameters for each fitted time series. .
The Final or Source Parameters for Baseline Forecast view contains the following measures.
To see these measures:
Generate Parameters must be selected in the Forecast Administration Workbook.
System Generated Parameters must be selected to be viewed in the Forecast Approval wizard.
Fit Error Factor
This is the relative error calculated at source level and transformed to become the error factor for the final level.
The transformation is a two step process. First, the source level error is replicated at the final level intersection. Then it is multiplied with a profile - still at the final level intersection, to add some variability for each product/location combination.
The value is multiplied with the forecast to create the confidence intervals.
Forecast Method Picked
This is the system-calculated alpha value (which is an internal optimization parameter that corresponds to the rate of decay of the weighting on the historical values) for the corresponding product/location combination if the chosen method is one of the following methods: Simple, Holt, Additive Winters, Multiplicative Winters, and Profile Based.
System Generated Alpha
This is the system-calculated alpha value (which is an internal optimization parameter that corresponds to the rate of decay of the weighting on the historical values) for the corresponding product/location combination if the chosen method is one of the following methods: Simple, Holt, Additive Winters, Multiplicative Winters, and Profile Based.
System Generated Level
This is the system-calculated level (which is the constant baseline forecast) if the chosen method is one of the following methods: Simple, Holt, Additive Winters, Multiplicative Winters, and Seasonal Regression.
System Generated Gamma
This is the system-calculated gamma value for the corresponding product/location combination if the chosen method is one of the following methods: Simple, Holt, Additive Winters, Multiplicative Winters, and Profile Based.
System Generated Trend
This is the system-calculated trend (which is the rate of change of the baseline forecast with time) if the chosen method is one of the following methods: Holt, Additive Winters, Multiplicative Winters, and Seasonal Regression.
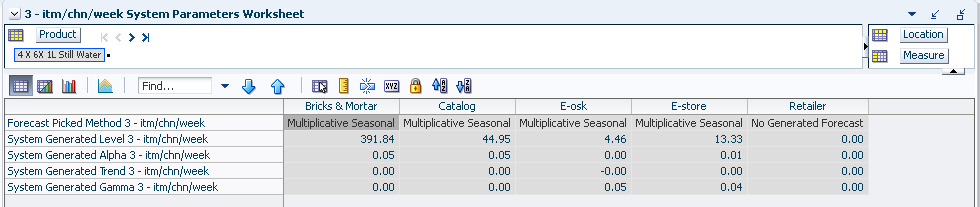
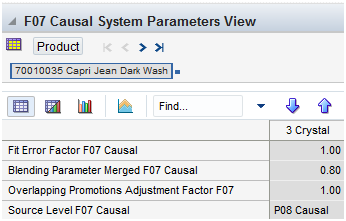
This view shows the system parameters for a causal forecast.
The Final or Source Parameters for Causal Forecast view contains the following measures.
Since no forecast is generated at the causal pooling levels, the information on this view is relevant only for the final forecast level
The Final Parameters for Causal Forecast view contains the following measures.
To see these measures:
Generate Parameters must be selected in the Forecast Administration Workbook.
System Generated Parameters must be selected to be viewed in the Forecast Approval wizard.
Fit Error Factor
This is the relative error calculated between the historical demand and the backcast. The backcast is calculated as the regression intercept, as a proxy for the baseline and the causal information applied on top of it.
Overlapping Promotion Adjustment Factor
This measure displays the Overlapping Promotion Adjustment Factor value that was applied during the forecast generation at the item/location level.
The Overlapping Promotion Adjustment Factor specifies how the individually calculated promotion effects are combined with each other when the promotions are overlapped in the forecast horizon. More details can be found in the Forecast Administration Task.
Blending Parameter Merged
This parameter displays the weight for combining the Final and Source Level promotion effects, when calculating the blended effect. The range of the parameter is 0 to 1. A value closer to 1 will yield a blended effect closer to the Source Final Level effect. A value closer to zero yields an effect closer to the Final Level effect. The measure displays the merged default and override values set in the Forecast Administration and Forecast Maintenance workbooks, respectively.
Source Level
This measure displays the pooling level assigned to the item/location. It is the merge between the default and override values set in the Forecast Administration and Forecast Maintenance workbooks, respectively.
The following sections demonstrate how the exception management framework can be used to navigate the Forecast Approval workbook.
The amount of forecasts that are typically produced every week by retailers is huge. Manually reviewing and approving so many numbers is not realistic. On the other hand, automatically approving all numbers is not good practice either. To address this fact, RPAS offers the exception management framework, where rules can be set up, and the forecast can be checked against those rules. If the rules are violated, the cells are flagged, and the user can review and take action. If not, the forecasts are approved, and the user can concentrate on the forecasts that need attention.
RDF has a set of alerts configured, that can be used for the forecast approval process. Some of these rules, are implemented both as batch as well as workbook alerts. The batch alerts are calculated in batch and are typically used to narrow down the information that is brought in a workbook. They will include the whole forecast horizon of the product/locations that are alerted. Once the workbook is built, the user can navigate it by continuing to use the batch alert, or she can switch to workbook alerts. The workbook alerts are more convenient once the workbook is built, because they point the user to the exact cell that needs attention, not just the product/location.
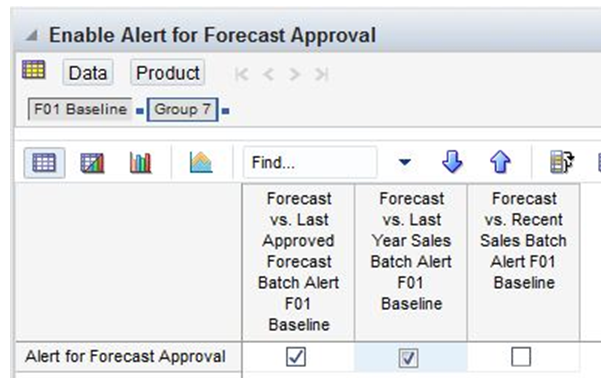
The first step is to enable some alerts to be used for approval. This happens in the Forecast Administration workbook, and should be an infrequent task.
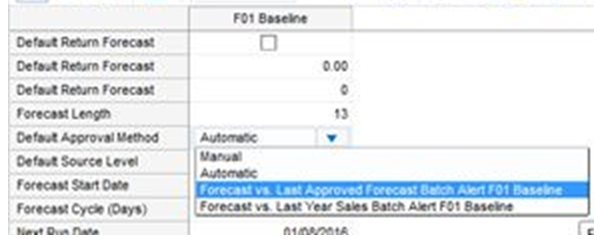
Not all alerts make sense for all types of forecasts. For instance, for a baseline forecast, comparing forecasts vs. sales last year probably makes sense. However, due to differences in the promotional calendar year over year, it may not make sense to compare these quantities for the causal forecast. After selecting one or more alerts to be used in the approval process, choose your approval option.
In this case the user selected to compare the forecast vs the last approved forecast. The reasoning behind this is that the user has spent a fair amount of time to make sure the forecast is in good shape the last time forecast was generated. For the next run she wants to be alerted when the new forecasts differ significantly from the last approved values. If they are close, the new numbers are automatically approved.
At this point the setup is complete, and the forecast generation batch can be kicked off. Among other tasks, the batch generates the forecasts and runs the forecast approval rules.
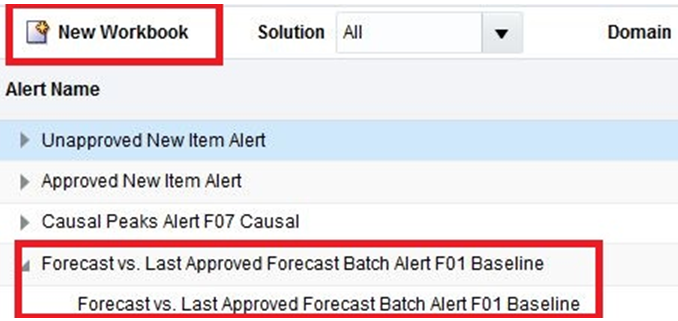
When the user logs in after the batch is run, she will see the list of alerts and the number of time series that are flagged in each local domain.
She can pick an alert and select to build a new workbook. The forecast approval alerts are most relevant in building the Forecast Approval workbook, but they can be included in any workbook. The workbook builds using the same wizard options as if an alert was not included. The only difference is that the last step is to pick a sheet for the alert measure. A good choice is the System Parameters worksheet.
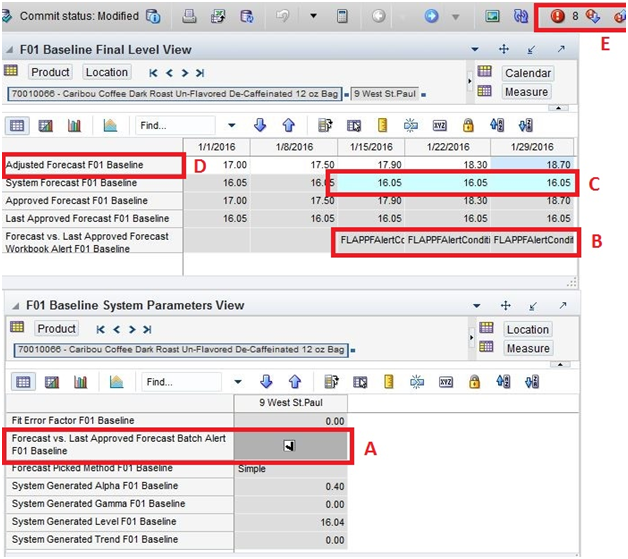
Once the workbook is built, it can be formatted to look like Figure 12-21. Table 12-2 describes the workbook sections.
Table 12-2 Workbook Section Descriptions
| Section | Description |
|---|---|
|
A |
This shows the forecast vs. last approved forecast alert measure. This measure was used to limit the information included in the workbook to just what is flagged. At this point the user can continue to use it to navigate the flagged time series, or she can switch to the workbook alerts. |
|
B |
There are two ways that the workbook alerts flag certain cells. First is the workbook alert measure. There is one for every workbook alert included in the sheet. Some users may find it useful, while other may want to hide the measure and use the second option. |
|
C |
Another way to point out the flagged cells is to look at the formatted cells of the system forecast measure. Note how both options B and C take the user to the exact week where the forecast needs attention. |
|
D |
The adjusted forecast measure is where the user can make adjustments if she chooses to do so. For instance, she may asses that the last approved forecast and system forecast are close enough, so no action is taken. Or for other weeks, she may adjust the forecast to a value closer to the last approved forecast, in which case, the previously flagged cells will appear normal. |
|
E |
Finally, these three controls enable the navigation. First we have the counter, which is dynamically updated based on the number of formatted/flagged cells. The next two advance to the previous or next alerted cell, respectively. |
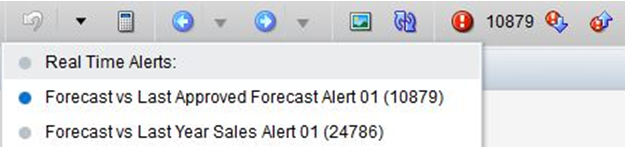
If more than just one workbook alert is enabled for the sheet, the user can easily switch among alerts, depending on the business rule she wants to check as shown in Figure 12-22.