| Oracle® Retail Demand Forecasting User Guide for the RPAS Fusion Client Release 16.0 E91109-03 |
|

 Previous |
 Next |
| Oracle® Retail Demand Forecasting User Guide for the RPAS Fusion Client Release 16.0 E91109-03 |
|
Previous |
Next |
This chapter describes how the preprocessing functionality is implemented in RDF using the Preprocess Administration Workbook.
Use the Preprocess Administration Workbook to perform the steps for this task:
|
Note: Similar to the Preprocess Administration Workbook is the Source Measure Maintenance Workbook. For functionality differences, see Source Measure Maintenance Functionality. |
About Preprocessing
Preprocessing is a module that is used to correct historical data prior to forecast generation when history does not represent general demand patterns. It is meant to automatically make adjustments to the raw POS (Point Of Sales) data so the next demand forecasts do not replicate undesired patterns.
Data Preprocessing is commonly used to:
Correct for lost sales due to stock-outs
Cleanse data for effects of promotions and short-term price changes (optional)
Correct for outliers – unusually high or low values introduced by human error or special events (hurricane that left a store closed for a week)
Scrub data manually to fake history and override user history
Adjust demand for the occasional 53rd calendar week
Manage demand created during events and holidays that do not occur in the same period every year, for example, Back to School.
Preprocessing runs after the data has been loaded from the host system and prior to forecast generation. Use the Preprocess Administration Workbook to produce and review data. It is common for an environment to require preprocessing to run multiple times to properly smooth the history. Commonly, there are up to three or four runs to go from raw sales to the data source that is used to generate the forecast. For RDF, a maximum of six runs is allowed for one data source. For example, if there is one baseline and one causal level, there can be up to six preprocessing runs allowed to create the data source for the baseline forecast, and up to six runs allowed to create the data source for the causal forecast.
Preprocessing Data in the RDF Workflow
Preprocessing offers a variety of Algorithm methods to support the business requirements. The main reason for preprocessing is to transform the raw sales data into a measure that gets as close as possible to unconstrained demand.
The preprocessing step is most often implemented in batch, by invoking a preprocessing special expression. The special expression takes several measures as input. For instance, one needs to specify the measure to be corrected, the desired algorithm, and the number of periods to be considered. However, you can go into more detail, and specify several filter window lengths, or exponential smoothing parameters.
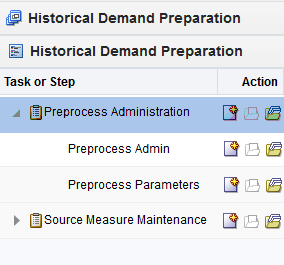
The following table lists the workbooks, steps, and views for the Preprocess Administration task.
To build the Preprocess Administration workbook, perform these steps:
Click the New Workbook icon in the Preprocess Administration task in the Historical Demand Preparation activity.
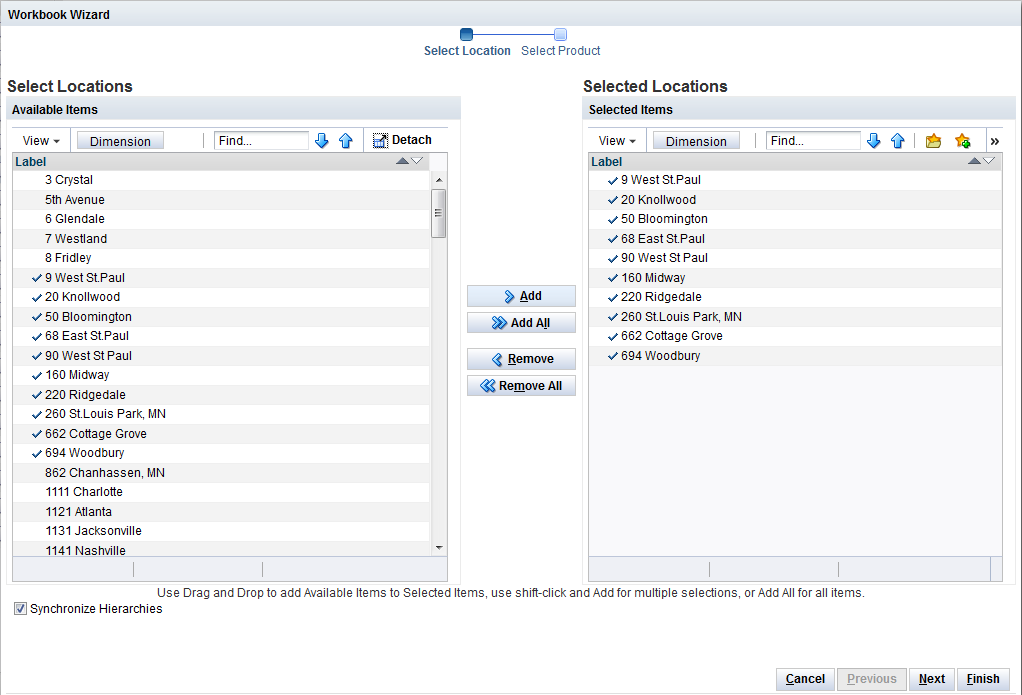
The Workbook wizard opens. Select the specific locations that you want to view and click Next.
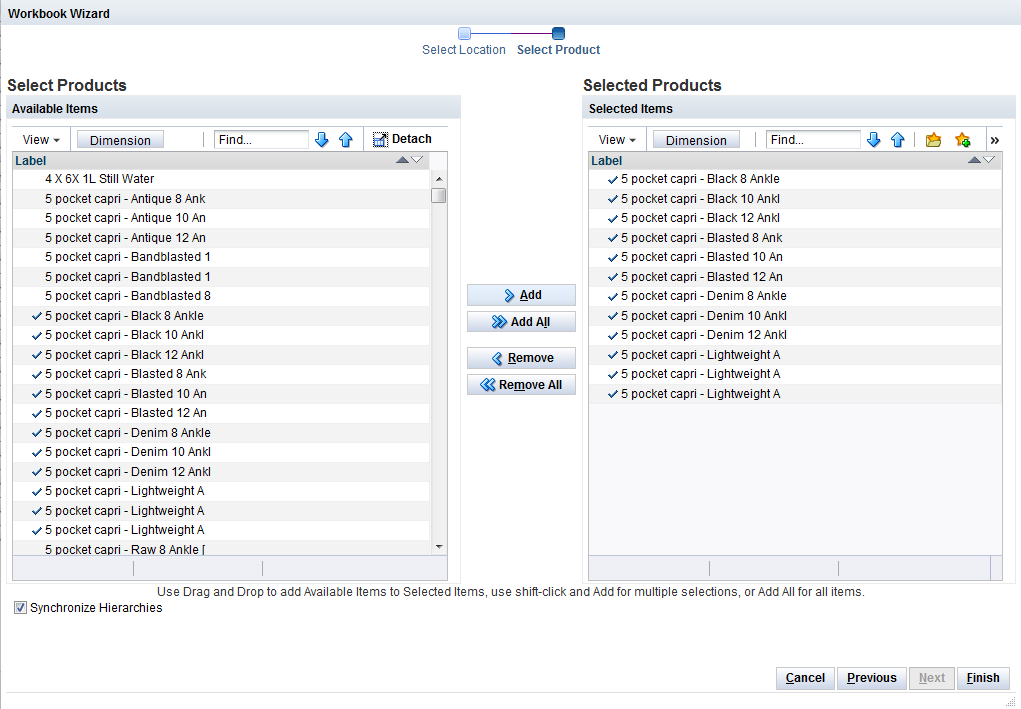
Select the products you want to work with and click Finish.
The Preprocess Administration workbook is built.
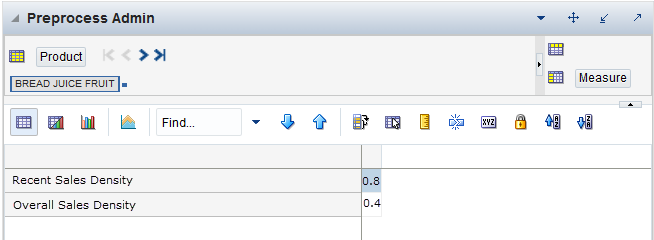
This step contains the Preprocess Admin view.
The Preprocess Admin view allows you to define the scope of the preprocessing run, as well as filter out item/locations where preprocessing does not make sense because of lack of enough historical sales.
The Preprocess Admin view contains the following measures:
|
Note: The time series is preprocessed when both the Recent Sales Density and the Overall Sales Density results are larger than the thresholds for both measures. |
Recent Sales Density
This measure shows a threshold value of sales density during a recent time period. The time period is defined by the Like TS Duration measure and the density is calculated as the number of populated cells during the Like TS Duration divided by the Like TS Duration. For example, if the Like TS Duration is five periods, and there are two periods with non-zero sales, then the density is 2/5, which is 40%.
Overall Sales Density
This measure shows a threshold value of sales density over the entire sales history (the time period). The time period is defined by the first non-zero data point until today. The density is calculated as the number of populated cells during the time period divided by the time period. For example, if the time period is 100 periods, and there are 20 periods with non-zero sales, then the density is 20/100, which is 20%.
This step has six views:
These views make available the preprocessing parameters for four rounds of preprocessing runs, necessary to calculate the data source for baseline forecasting and promotional forecasting.
In RDF, preprocessing is configured to create the data sources for baseline forecasting, as well as, causal forecasting. The creation of each of the sources can go through at most six runs of preprocessing. For example, to generate the causal data source, it is configured for three runs and for the baseline data source, it is configured for four runs.
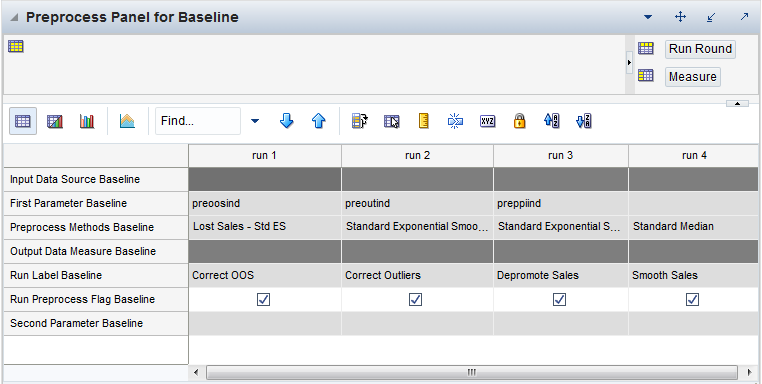
The view displays the measures necessary to create the data source for baseline forecasting. This involves four rounds of preprocessing that run in batch or online.in this order:
Correcting for stockouts
Correcting for outliers
Depromoting sales
Smooth sales
|
Note: Measures are replicated for each round of preprocessing. |
The Preprocessing Panel for Baseline view contains the following measures:
Input Data Source
Indicates the measure that will be corrected. This is the input to the first preprocessing run. There are no inputs available for other runs other than the first run.
First Time-Phased Parameter Causal
This measure stores the first time-phased measure that is required for some preprocessing methods. For instance, for the STD ES LS method, this measure would store the measure name of the outage flag. Or for the STD ES method, it could store the name of the outlier flag.
Preprocess Method
Name of the preprocessing method to be used for each run. This method is selected in the Configuration Tools
Output Data Measure
Indicates the measure that stores the result of the last configured preprocessing run. For instance, for the Preprocess Panel for Baseline, the output comes from run 4.
Run Label
A label denoting the purpose of the preprocessing run, for example, Correct Outliers, or Depromote Sales.
Run Preprocess Flag
Boolean measure indicating if this run should be enabled or skipped.
Second Time-Phased Parameter Causal
This measure stores the second time-phased measure that is required for some preprocessing methods. For instance, for the Forecast Sigma method, this measure would store measure name of the confidence intervals. Or for the Override method it could store the measure name of the outage flag.
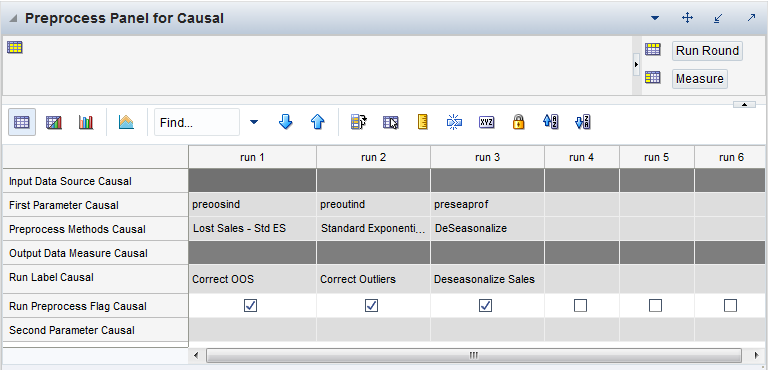
This view displays the measures necessary to create the data source for baseline forecasting. This involves three rounds of preprocessing that run in this order:
Correcting for stockouts
Correcting for outliers
Deseasonalizing the measure to create the causal data source
The first two runs are the same used to generate the baseline data source. Hence they use the same parameters as the ones in the Preprocess Panel for Baseline View. The third run deseasonalizes the demand.
|
Note: Measures are replicated for each round of preprocessing. |
The Preprocessing Panel for Causal view contains the following measures:
Input Data Source
Indicates the measure that will be corrected. This is the input to the first preprocessing run. There are no inputs available for other runs other than the first run.
First Time-Phased Parameter Causal
This measure stores the first time-phased measure that is required for some preprocessing methods. For instance, for the STD ES LS method, this measure would store the measure name of the outage flag. Or for the STD ES method, it could store the name of the outlier flag.
Preprocess Method
Name of the preprocessing method to be used for each run. This method is selected in the Configuration Tools
Output Data Measure
Indicates the measure that stores the result of the last configured preprocessing run. For instance, for the Preprocess Panel for Causal, the output comes from Run 3.
Run Label
A label denoting the purpose of the preprocessing run, for example, Correct Outliers, or Deseasonalize Sales.
Run Preprocess Flag
Boolean measure indicating if this run should be enabled or skipped.
Second Time-Phased Parameter Causal
This measure stores the second time-phased measure that is required for some preprocessing methods. For instance, for the Forecast Sigma method, this measure would store measure name of the confidence intervals. Or for the Override method it could store the measure name of the outage flag.
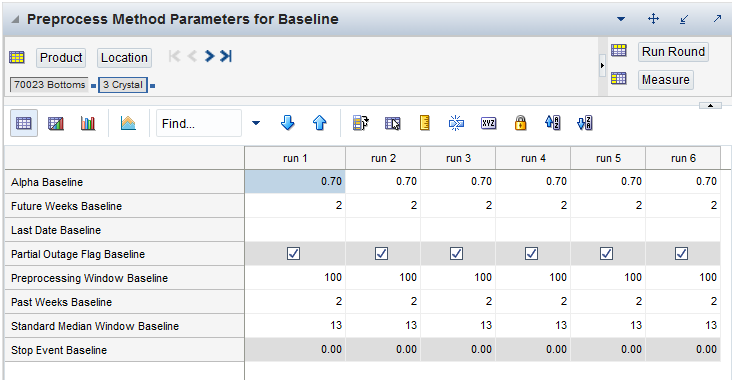
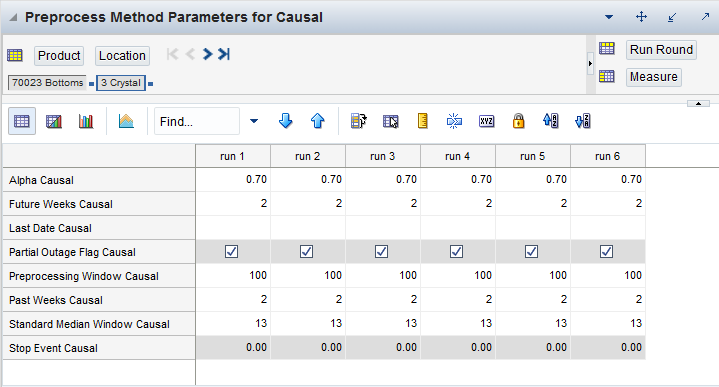
There are actually two views with the same set of measures, where, you can enter values for parameters specific for some of the preprocessing methods available in the special expression to create the data sources for the baseline and causal forecasts. There is a set of parameters for each of the maximum six runs allowed. However, very likely not all six are configured. For example, when generating the causal data source, three runs are configured. The parameters are entered at the class/store intersection
The Preprocessing Methods Parameters for Baseline view contains the following measures:
Alpha
Exponential smoothing coefficient used to calculate past and future velocities.
Future Weeks
This represents the maximum number of data points to calculate the future velocity, when using the Standard Exponential Smoothing or Lost Sales Standard Exponential Smoothing preprocessing methods.
Last Date
This represents the end date of the preprocessing window; it is typically today's date, but can be any date in the past.
Past Weeks
This represents the maximum number of data points to calculate the past velocity, when using the Standard Exponential Smoothing or Lost Sales Standard Exponential Smoothing preprocessing methods.
Preprocessing Window
Number of historical data points that are preprocessed.
Standard Median Window
Filter window length for the Standard Median preprocessing method.
Partial Outage
A scalar parameter indicating if the period immediately following an out-of-stock period should be adjusted. The default behavior is for the flag to be True.
Stop at Event
This parameter determines which periods are included in the calculation of past/future velocities.
If the flag is set to True, then the algorithm only includes periods before the first event flag or event indicator.
If the flag is False, then all available, non-flagged periods, within the windows defined by nfut and npast, are used in the calculation of the past and future velocities.
The default setting for the flag is False.
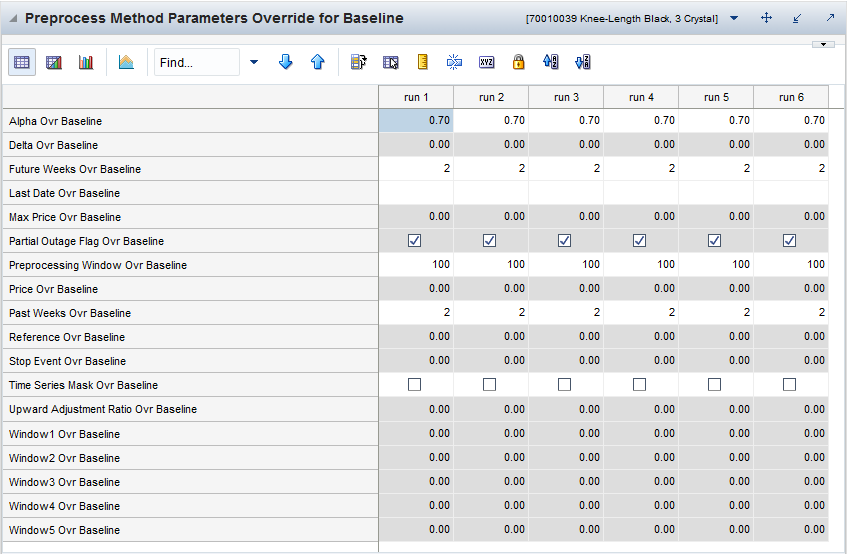
In this view at the item/store level, you can override values for parameters specific for some of the preprocessing methods available in the special expression. There are two views, corresponding to the preprocessing runs necessary to create the data sources for the baseline and causal forecasts.
After all parameters are set and committed back to the domain, usually a batch job will run the pre-processing steps and prepare the data source s for forecast generation.
The Preprocessing Method Parameters Override for Baseline view contains the following measures:
Alpha Override
Exponential smoothing coefficient used to calculate past and future velocities.
Future Weeks Override
This represents the maximum number of data points to calculate the future velocity, when using the Standard Exponential Smoothing or Lost Sales Standard Exponential Smoothing preprocessing methods.
Last Date Override
This represents the end date of the preprocessing window; it is typically today's date, but can be any date in the past.
Past Weeks Override
This represents the maximum number of data points to calculate the past velocity, when using the Standard Exponential Smoothing or Lost Sales Standard Exponential Smoothing preprocessing methods.
Preprocessing Window Override
Number of historical data points that are preprocessed.
Standard Median Window Override
Filter window length for the Standard Median preprocessing method.
Partial Outage Override
A scalar parameter indicating if the period immediately following an out-of-stock period should be adjusted. The default behavior is for the flag to be True.
Stop at Event Override
This parameter determines which periods are included in the calculation of past/future velocities.
If the flag is set to True, then the algorithm only includes periods before the first event flag or event indicator.
If the flag is False, then all available, non-flagged periods, within the windows defined by nfut and npast, are used in the calculation of the past and future velocities.
The default setting for the flag is False.
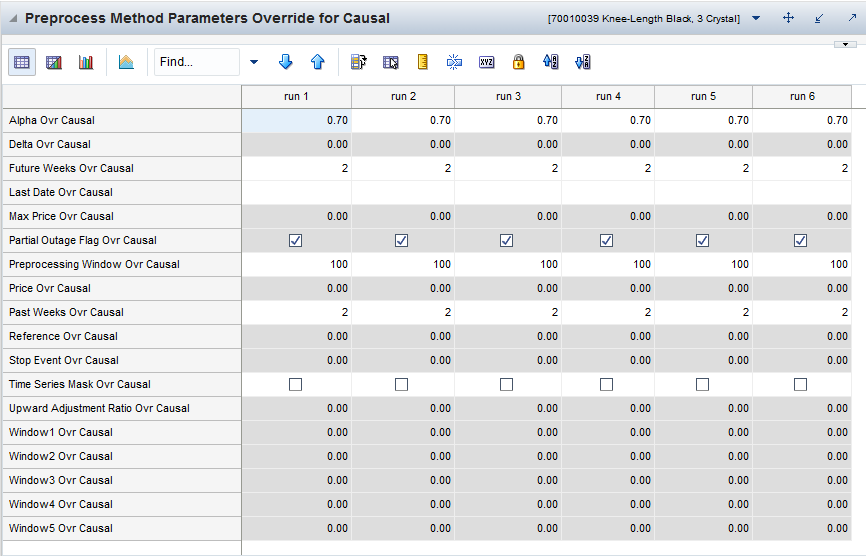
There are actually two views with the same set of measures, where, you can enter values for parameters specific for some of the preprocessing methods available in the special expression to create the data sources for the baseline and causal forecasts. There is a set of parameters for each of the maximum six runs allowed. However, very likely not all six are configured. For example, when generating the causal data source, three runs are configured. The parameters are entered at the class/store intersection
The Preprocessing Method Parameters Override view contains the following measures:
Alpha
Exponential smoothing coefficient used to calculate past and future velocities.
Future Weeks
This represents the maximum number of data points to calculate the future velocity, when using the Standard Exponential Smoothing or Lost Sales Standard Exponential Smoothing preprocessing methods.
Last Date
This represents the end date of the preprocessing window; it is typically today's date, but can be any date in the past.
Past Weeks
This represents the maximum number of data points to calculate the past velocity, when using the Standard Exponential Smoothing or Lost Sales Standard Exponential Smoothing preprocessing methods.
Preprocessing Window
Number of historical data points that are preprocessed.
Standard Median Window
Filter window length for the Standard Median preprocessing method.
Partial Outage
A scalar parameter indicating if the period immediately following an out-of-stock period should be adjusted. The default behavior is for the flag to be True.
Stop at Event
This parameter determines which periods are included in the calculation of past/future velocities.
If the flag is set to True, then the algorithm only includes periods before the first event flag or event indicator.
If the flag is False, then all available, non-flagged periods, within the windows defined by nfut and npast, are used in the calculation of the past and future velocities.
The default setting for the flag is False.
In this view at the item/store level, you can override values for parameters specific for some of the preprocessing methods available in the special expression. There are two views, corresponding to the preprocessing runs necessary to create the data sources for the baseline and causal forecasts.
After all parameters are set and committed back to the domain, usually a batch job will run the pre-processing steps and prepare the data source s for forecast generation.
The Preprocessing Method Parameters Override view contains the following measures:
Alpha Override
Exponential smoothing coefficient used to calculate past and future velocities.
Future Weeks Override
This represents the maximum number of data points to calculate the future velocity, when using the Standard Exponential Smoothing or Lost Sales Standard Exponential Smoothing preprocessing methods.
Last Date Override
This represents the end date of the preprocessing window; it is typically today's date, but can be any date in the past.
Past Weeks Override
This represents the maximum number of data points to calculate the past velocity, when using the Standard Exponential Smoothing or Lost Sales Standard Exponential Smoothing preprocessing methods.
Preprocessing Window Override
Number of historical data points that are preprocessed.
Standard Median Window Override
Filter window length for the Standard Median preprocessing method.
Partial Outage Override
A scalar parameter indicating if the period immediately following an out-of-stock period should be adjusted. The default behavior is for the flag to be True.
Stop at Event Override
This parameter determines which periods are included in the calculation of past/future velocities.
If the flag is set to True, then the algorithm only includes periods before the first event flag or event indicator.
If the flag is False, then all available, non-flagged periods, within the windows defined by nfut and npast, are used in the calculation of the past and future velocities.
The default setting for the flag is False.