| Oracle® Retail Demand Forecasting User Guide for the RPAS Fusion Client Release 16.0 E91109-03 |
|

 Previous |
 Next |
| Oracle® Retail Demand Forecasting User Guide for the RPAS Fusion Client Release 16.0 E91109-03 |
|
Previous |
Next |
This chapter describes these two features:
Item attributes — which are used to make automatic like item recommendations for new items.
New items — including:
workflow around handling
reviewing and approving their automatic like item recommendation
the manual process for like stores selection with new stores
In general, an item is considered new if it satisfies the following condition:
Forecast start date override is in the future or Sales history length is less than the time series duration parameter
In general, an item is considered a like-item if it satisfies the following conditions:
The pre-range mask is nitmaitrmsk
When an item/str has a sales history longer than tsDuration. (from first populated sale to today)
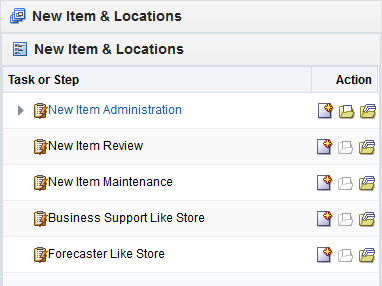
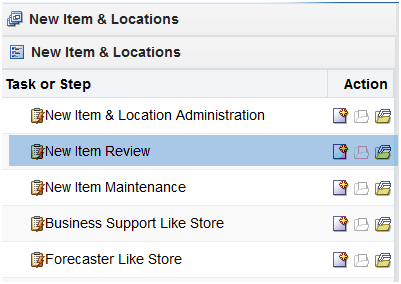
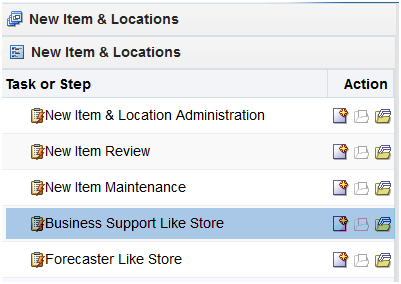
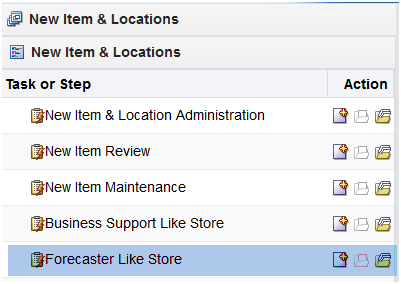
These workbooks help you achieve this task:
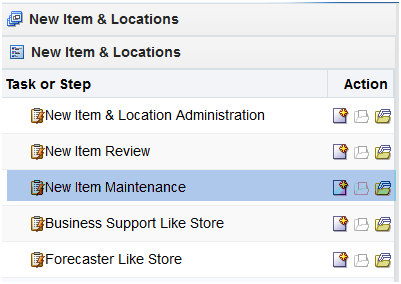
The following table lists the workbooks, steps, and views for the New Item & Locations task.
|
Note: The full functionality of these workbooks is available only when item attributes are loaded and thus the like item recommendation is automated.When item attributes are not available. Then like items are selected manually, and the attribute-based functionality is unavailable. |
To build the New Item Administration workbook, perform these steps:
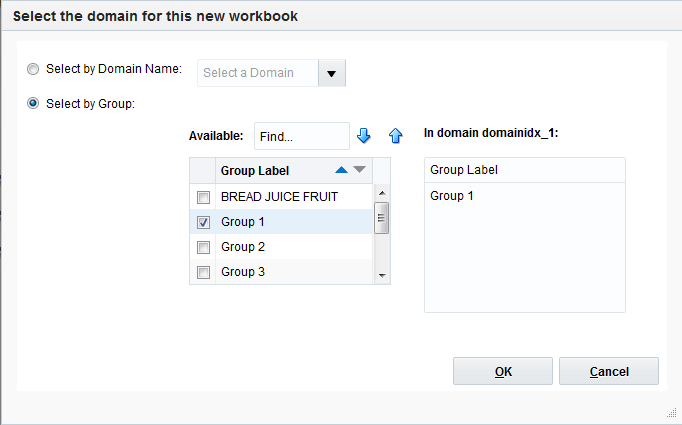
Click the New Workbook icon in the New Item Administration task in the New Item & Locations activity.
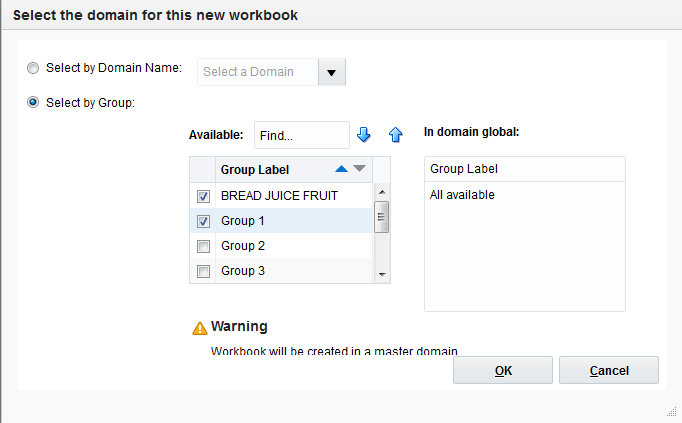
The Workbook wizard opens. Select the domain for this workbook and click OK.
The New Item & Location Administration workbook is built.
This step contains views that allow you to set default values for some parameters related to the new item functionality
The available views are:
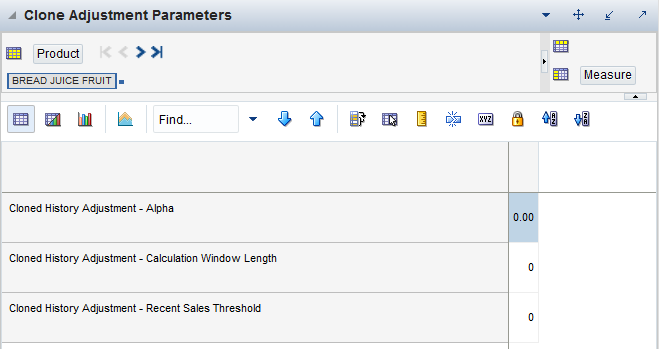
The Clone Adjustment Parameters view is used to review default values for some parameters related to the new item functionality
The Clone Adjustment Parameters view contains the following measures:
Cloned History Adjustment - Alpha (Range 0-1)
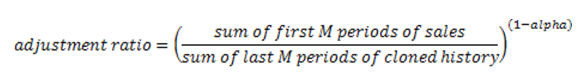
This parameter is used to calculate the ratio that is applied to the cloned history. If this parameter is close to zero (0), then the cloned sales will be scaled so that they are aligned with the sales level. If this parameter is close to one (1), then little scaling of the cloned history will occur.
Cloned History Adjustment - Recent Sales Threshold
This parameter represents a specific number of periods. If it is less than the number of periods from the first sale date to the current date, then the cloned history is adjusted. If it is greater than the number of periods from the first sale date to the current date, then no adjustment is made to the cloned history.
Cloned History Adjustment - Calculation Window Length
This parameter is the number of periods that are considered when adjusting the cloned history.
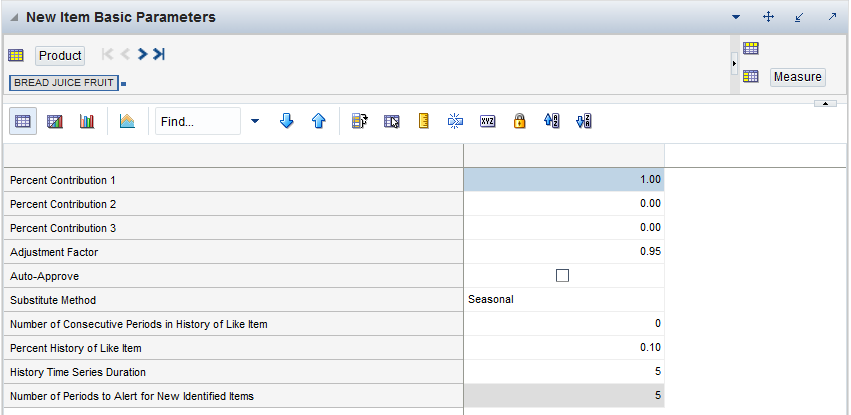
The New Item Basic Parameters view is used to set default values for some parameters related to the new item functionality.
|
Note: If no item attributes are available, then this view has a subset of measures. |
The New Item Basic Parameters view contains the following measures:
|
Note: If no item attributes are available, then History Time Series Duration is the only measure for this view. |
Percent Contributions
Percent Contribution1, Percent Contribution2, Percent Contribution3
Adjustment Factor
You may enter an Adjustment Factor to apply to the cloned history of the new location. This is a real number between [zero (0), infinity). The default (NA) value is 1.00 (in other words 100%), which translates to no adjustment.
Example 4-1 Adjustment Factor
If demand for a new store is expected to be 30% greater than its clone store, the Adjustment Factor would be set to 1.30. If demand for a new store is expected to be 30% less than its clone store, the Adjustment percent would set to 0.70.
|
Note: Adjustment Factors and Clone Contributions specified in the Product Cloning and Location Cloning views are used together while evaluating the result for a given item/store. |
Example 4-2 Adjustment Factors and Clone Contributions
| SKU1 | |
|---|---|
| SKU2 | SKU3 |
| 20% | 80% |
| Adjustment Factor = 1 | |
| STR1: | |
|---|---|
| STR2 | STR3 |
| 50% | 50% |
| Adjustment Factor = 0.5The contributions are calculated as:SKU2/STR2 at 5% (=20% x 0.5x50%), SKU2/STR3 at 5%,SKU3/STR2 at 20%(=80%x0.5x50%),SKU3/STR3 at 20% | |
Auto-Approve
You decide if automatic like item recommendations are automatically approved by selecting this measure. Automatically approved like items also trigger an alert and the New Item Maintenance workbook is using the alert to pre-range the new items only to approved items positions. If the automatic like item recommendations are not automatically approved, the new items are alerted in a not approved alert and can be viewed and adjusted in the New Item Review workbook.
Substitute Method
This measure displays a list where you can select the substitute method. When a Substitute Method is used to forecast, the method set for an intersection is cleared once the Default Forecast Start Date is greater than the Forecast Start Date Override plus the Like TS Duration for the intersection. Valid options are:
| Substitute Method | Description |
|---|---|
| None | No Forecast is created for the time series (product location combination) |
| Seasonal | You provide a like item/location that has a similar seasonality pattern. The new time series' forecast is the like item/locations demand forecast with the applied adjustment. The forecast is set to zero (0) for all dates before the new product/location's start date. |
| Lifecycle | You provide a like item/location that had a similar lifecycle pattern as the new item/location. The new item/location's forecast is the like/location's actual historical demand with the applied adjustment shifted such that the like item/locations first sales matches the new item/location's forecast start date. |
| Cloning | You provide a like item/location that has a similar selling pattern as the new item/location. The historical demand of the like item/location is copied into the historical sales of the new item/location. During forecasting, the forecast of the new item/location is generated based on the new item/location's own, copied historical demand. |
| Base Rate of Sales | You provide a base rate of sales for a new item/store combination. The new product's forecast is a combination of the seasonality of the forecast at the corresponding source level and the base rate of sales. Specifically, the formula to calculate the forecast is:
Forecast at time t = source level forecast at time t divided by the average of the source level forecast times the base rate of sales. The base rate of sale is a convenient way to generate (seasonal) forecasts for a new item. No Like item or Clone item is needed. What is necessary is a value for how much the item is selling on average per period. That value works as the interim forecast used to spread the source level forecast down to final level. Because this item is new, the system knows that as you have specified a history start date. The base rate of sale forecast is generated until the TS duration is reached. The TS duration is the difference between forecast start date and history start date. Usually the default history start date is empty, which means it is the beginning of the calendar. If the history start date override is also empty, the forecast start date less the beginning of the calendar (>=2 years) is probably much more than the TS duration, so the item is not considered new. In this case base rate of sales or any new item method, will not work. |
Number of Consecutive Periods in History of Like Item
In this measure, you enter a threshold for the number of consecutive periods in the most recent history, where the demand was positive. If the actual number is larger than the threshold, than the time series qualifies to serve as like item/location for a new/item/location. For instance, the threshold is set to three, and the demand pattern is:
0,2,3,1,2,1,0,1,2,2,1,today
The calculated number of consecutive periods with positive demand is 4, and the item/location qualifies as a possible like item/location.
Percent History of Like Item
In this measure, you enter the threshold for the data density. If the actual density is larger
than the threshold, the time series qualifies to serve as like item/location for a new/item/location. The data density is calculated as:
data density = number of periods with demand larger than zero / total length of demand
For a time series with the following demand values:
0,1,0,1,0,today
The data density is 2/4 = 50%
History Time Series Duration
In this measure you can enter the threshold for the historical demand duration to determine if a time series is considered. If the demand history is less than the threshold, the forecast of the new time series is generated using the new item/store functionality. If the demand length is larger than the threshold, the time series is not considered new anymore, and its own demand is used to generate the forecast.
Number of Periods to Alert for New Identified Items
This measure defines how many periods of new item/stores display in the New Item Review Workbook and New Item Maintenance Workbook.
|
Note: This workbook is only available if item attributes exist. |
This workbook is intended for new items that have received like item recommendations, but which were not auto-approved. You can review recommendations, as well as metrics that support the recommendations. The recommendations are based on similarity of items, which in turn is based on how close new items' attributes are compared to all existing items' attributes.
|
Note: The Like Item 2 field is ignored when there is no Like Item 1. |
The workbook can be built two ways, either:
Use the unapproved items alert
Use the task flow, in which case a pre-range mask narrows down the product hierarchy to only the relevant new and existing items
To build the New Item Review workbook, perform these steps:
Click the New Workbook icon in the New Item Review task in the New Item & Locations activity.
The Workbook wizard opens. Select the domain for this workbook and click OK.
The New Item Review workbook is built.
This step is the first place to go after the like item recommendation was run in batch. You can check what like items were recommended for a certain new item. There may be more than one like item, due to the assortment of each store. For instance, a very good fit for a new item is only sold in a certain store format, so for other store formats different like items are recommended. For each like item picked, the store count for which the like item is valid is displayed.
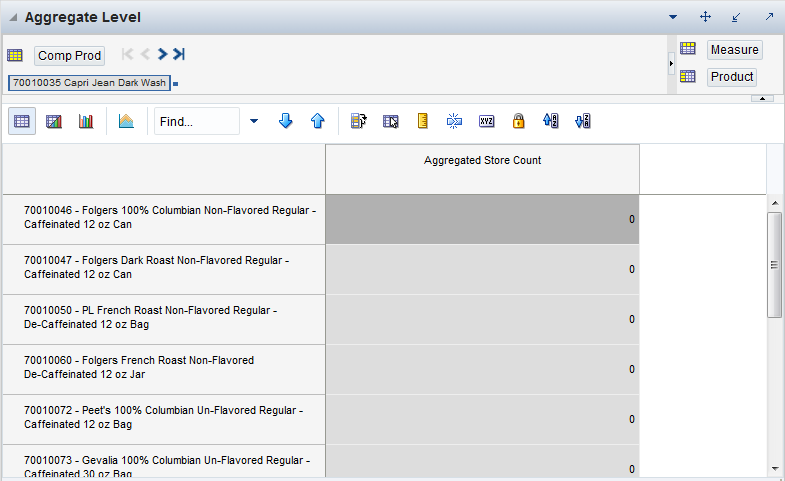
The available view is:
The Aggregate Level view is at the item/item RHS intersection. The item represents the new items, while the item RHS represents the like items. Both dimensions are ranged to only relevant positions. For instance, the item dimension only displays items that are considered new. And the item RHS dimension has only positions that were identified as like items for new items.
The Aggregate Level View view contains the following measure:
Aggregated Store Count
This measure displays the number of stores at which an item RHS position was identified as the most suitable like item for a new item. For instance, for new item A, item BA was identified to be the like item for 20 stores. For the rest of 42 stores, it was item CA. This can happen simply because the best fit - in this case item BA - is not sold in all stores. Item CA is the second best fit, but it's sold in more stores, and thus the subjective better fit.
After the high level like item recommendation was checked, you may want to review details about the recommended like items and the new item's attribute and weights. This step enables you to find this information in the views that it contains.
The available views are:
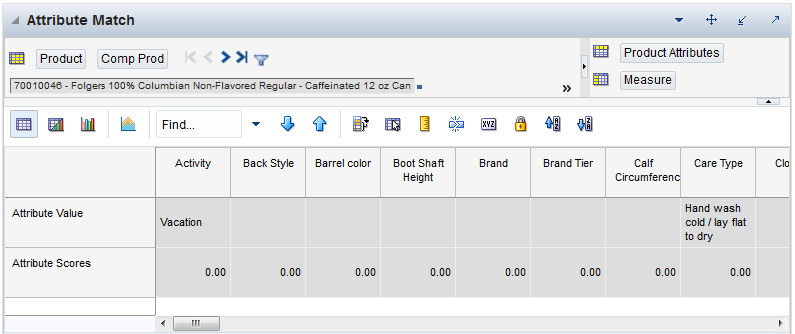
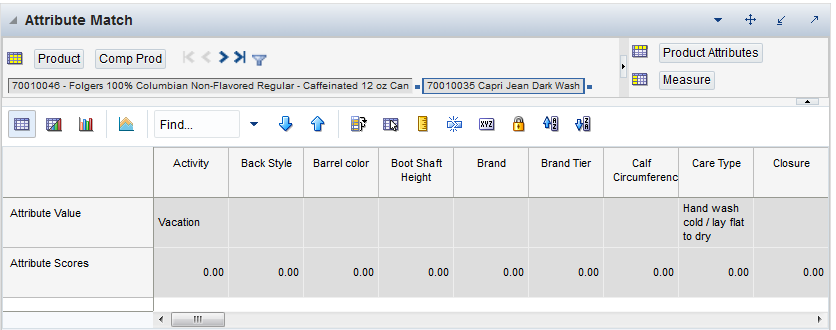
The Attribute Match view is at the item/item RHS/attribute intersection. The item dimension is ranged to new items, while the item RHS dimension is ranged to only relevant existing items. The two measures show the attribute values and how they match between the new and existing items.
The Attribute Match View view contains the following measures:
Attribute Value
This measure displays the content of the attribute. For instance the unit of measure (UOM) attribute can have different values. It can be inch or XL for fashion items. Or it can be ounce or grams for grocery items.
Attribute Scores
This measure displays the quantitative fit of the attribute values between new and existing items. For instance we can compare the UOM attribute between a coffee pack and a pair of jeans. The relevance of matching ounces and inches may not be very high, and the attribute score is likely zero. However, if we compare color attribute of a shirt and a t-shirt, the match be more relevant and the score is larger than zero.
This measure incorporates the goodness of the fit in attributes between new and existing items, as well as how important an attribute is for the new item. If the new item is a carbonated drink, the brand attribute may be much more relevant than the price tier, because the consumer is prepared to pay a higher price for a brand item
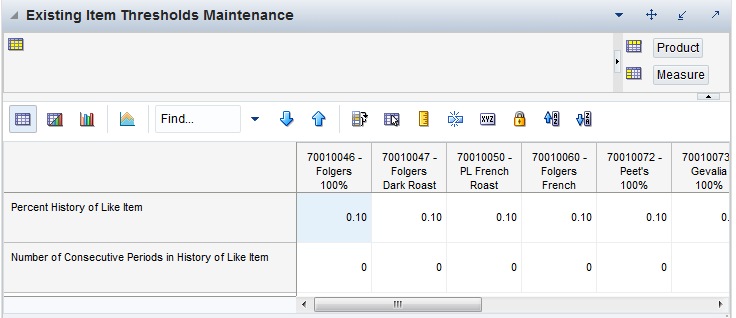
The Existing Item Thresholds Maintenance view is at the item intersection. The positions are ranged to only new items. The information in this view determines which existing items are eligible to be recommended for a certain new item. The decision is made using the included measures.
The Existing Item Thresholds Maintenance view contains the following measures:
Percent History Like Item
In this measure, you enter the threshold for the data density. If the actual density is larger than the threshold, the time series qualifies to serve as like item/location for a new/item/location. The data density is calculated as:
data density = number of periods with demand larger than zero / total length of demand
For a time series with the following demand values:
0,1,0,1,0,today
The data density is 2/4 = 50%
The information entered here is an override of the default value, specified in the New Item Administration task.
Number of Consecutive Periods in History of Like Item
In this measure, you enter a threshold for the number of consecutive periods in the most recent history, where the demand was positive. If the actual number is larger than the threshold, than the time series qualifies to serve as like item/location for a new/item/location. For instance, the threshold is set to three, and the demand pattern is: 0,2,3,1,2,1,0,1,2,2,1,today
The calculated number of consecutive periods with positive demand is 4, and the item/location qualifies as a possible like item/location.
The information entered here is an override of the default value, specified in the New Item Administration task.
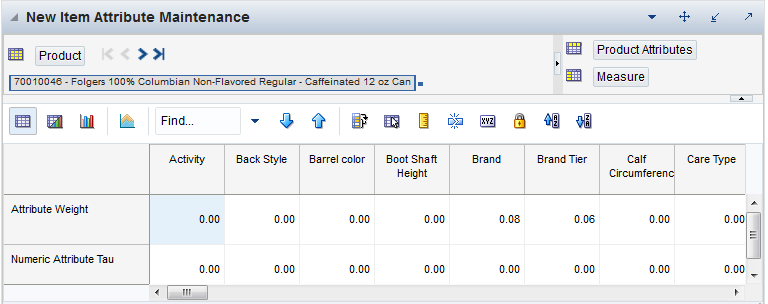
The New Item Attribute Maintenance view is used to review and adjust the attribute-related information for the new items.
The New Item Attribute Maintenance view contains the following measures:
Attribute Weight
This measure displays the relative importance of the attributes for a given new item. While the flavor family may not be important for a t-shirt, and the attribute has a weight of zero, the brand and color attributes definitely are. Their relative importance may be 0.2 for the color and 0.3 for the brand.
|
Note: That the sum of all attribute weights doesn't need to be 1 for every item. The automatic like item recommendation algorithm is taking care of it. The most likely scenario is that this measure is loaded, but it can be review and adjusted in this view. |
Numeric Attribute Tau
This measure helps decide the goodness of fit between to attribute values. If we compare the colors of two items, the values are either equal (red = red) or not (red!= black). However there are cases when two values are very close but not equal, and the user sets a threshold to help decide if the values should be a match or not.
For instance the size of a bottle of water is 16 fl. oz., which is roughly 473 ml. When comparing this item with another bottle of water which is 500 ml., the numbers are not matching. However, this may be a case where the user sets a value for tau, that allows the 500 ml. to be in the acceptable range of the 473 ml. The formula to decide if a match is acceptable is given below. If both attribute values are not Null, then
If abs(value1-value2) is less equal threshold tau * max(value1, value2)
Then the match=1
Otherwise the match is 0
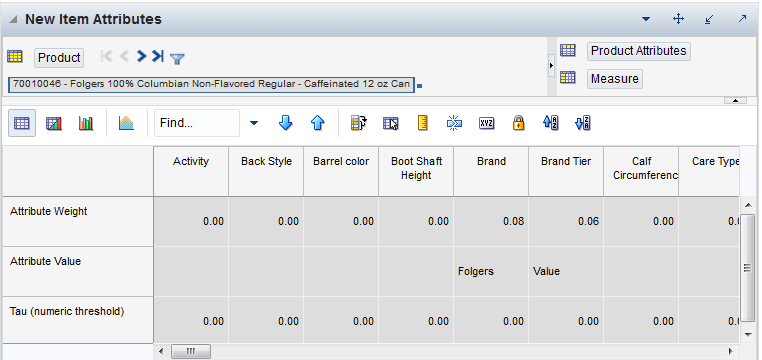
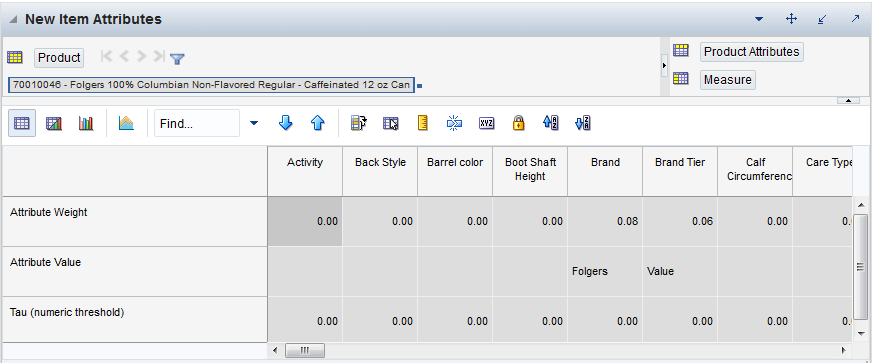
The New Item Attributes View is used to only review the attribute-related information for the new items.
The New Item Attributes View contains the following measures:
Attribute Weight
This measure displays the relative importance of the attributes for a given new item. While the flavor family may not be important for a t-shirt, and the attribute has a weight of zero, the brand and color attributes definitely are. Their relative importance may be 0.2 for the color and 0.3 for the brand.
|
Note: That the sum of all attribute weights doesn't need to be 1 for every item. The automatic like item recommendation algorithm is taking care of it. The most likely scenario is that this measure is loaded, but it can be review and adjusted in this view. |
Numeric Attribute Tau
This measure helps decide the goodness of fit between to attribute values. If we compare the colors of two items, the values are either equal (red = red) or not (red!= black). However there are cases when two values are very close but not equal, and the user sets a threshold to help decide if the values should be a match or not.
For instance the size of a bottle of water is 16 floz, which is roughly 473 ml. When comparing this item with another bottle of water which is 500 ml, the numbers are not matching. However, this may be a case where the user sets a value for tau, that allows the 500 ml to be in the acceptable range of the 473 ml. The formula to decide if a match is acceptable is given below. If both attribute values are not Null, then:
If abs(value1-value2) is less equal threshold tau * max(value1, value2)
Then the match=1
Otherwise the match is 0
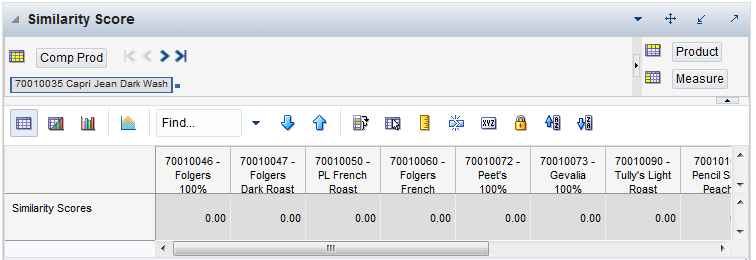
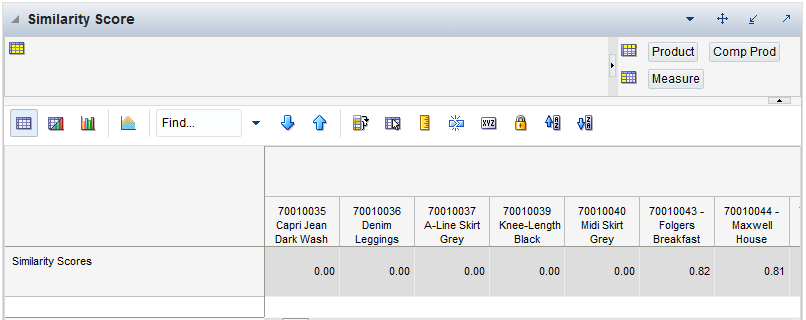
The Similarity Score view is at the item/item RHS/attribute intersection. The item dimension is ranged to new items, while the item RHS dimension is ranged to only relevant existing items. The two measures show the calculated similarity between new and existing items.
The Similarity Score view contains the following measure:
Similarity Scores
The Similarity Score is a measure of how well a new item's demand behavior can be modeled after a certain existing item's. The higher the score, the better the fit, and the better the chance that the existing item is going to be the like item
This step includes these available views:
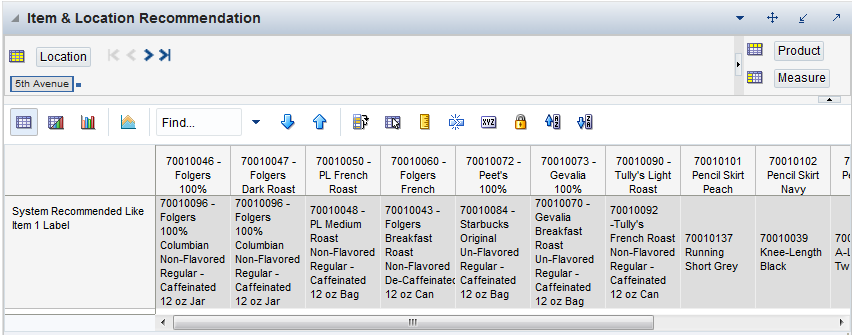
The Item & Location Recommendation view is at the item / store intersection. For new items it displays the top existing item for a certain store.
The Item & Location Recommendation view contains the following measure:
System Recommended Like Item 1
This measure displays the top like item (based on similarity and store ranging) for every store. For a given new item, the like item may be different by store. The reason is that for some stores, the existing item with the highest similarity is not available for sale. Then, the algorithm is picking the existing item with the highest score for that store.
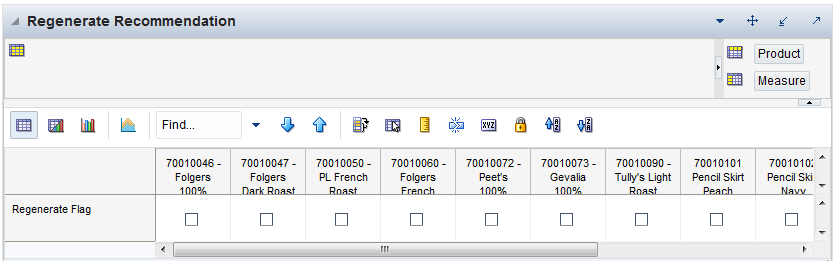
The Regenerate Like Item Assignment view is used to forecast a new item by modeling it after an existing item.
The Regenerate Like Item Assignment view contains the following measure:
Regenerate Flag
After reviewing and possibly adjusting the attribute-related measures, you can choose to rerun the like item recommendation. Do this by selecting this measure and committing the changes. The next time the batch is run, new like item recommendations are generated.
After reviewing all attributes, similarities, and like item recommendations, this step allows you to approve/override and setup the like item options.
The available view is:
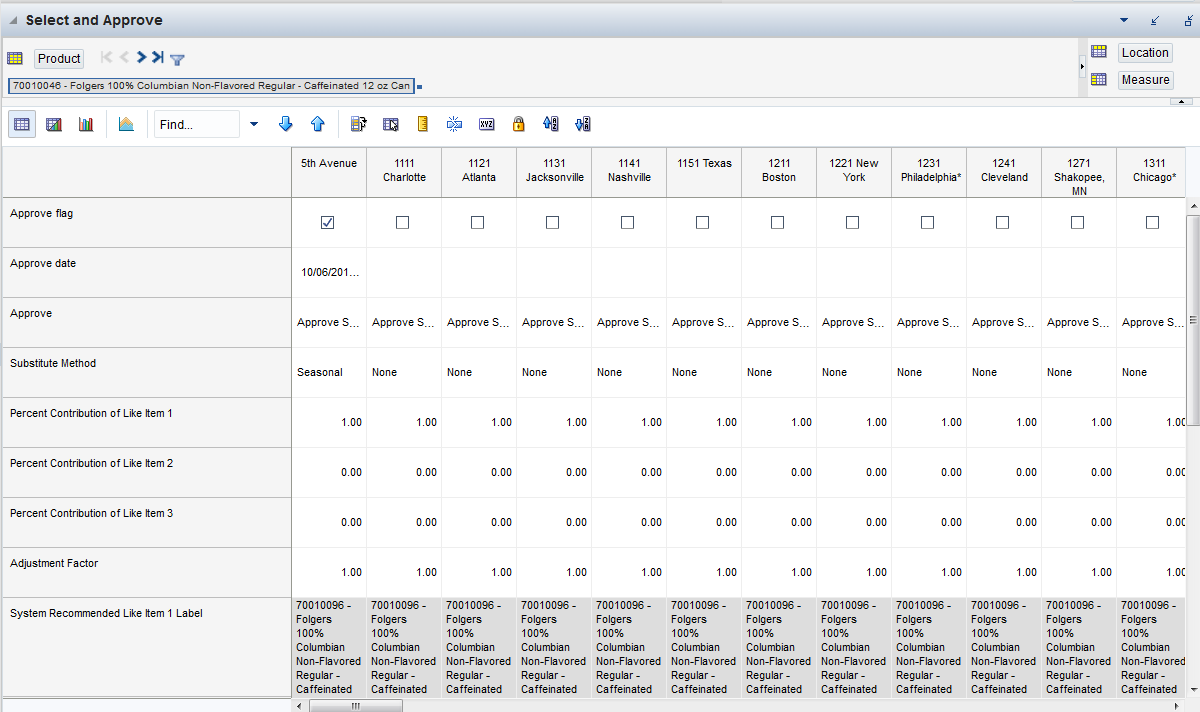
The Select and Approve view allows you to has the option to override the system recommendations, and/or trigger the approval, at the granular item / store intersection. This view has a custom menu, Approve New Items, and it approves the like items recommendations for new items. The recommendations are the system recommended or overrides, depending on the approve settings.
The Select and Approve view contains the following measures:
Approve Flag
Select this measure when you agree with the like item selections. These are either the system generated or the overrides. All approved item recommendations that have the measure checked are approved next time the custom menu is run.
Approve Date
This measure displays the date when the like item recommendation was approved by running the custom menu
Approve
This measure determines which recommendations are approved the next time the custom menu is run. The options are:
Null— no like item is recommended
Approve System — the system recommended like item is approved
Approve Override — your selected like item is approved. Note that if no user selections are available, then no like item is approved.
Substitute Method
This measure displays a list where you can select the substitute method. When a Substitute Method is used to forecast, the method set for an intersection is cleared once the Default Forecast Start Date is greater than the Forecast Start Date Override plus the Like TS Duration for the intersection. Valid options are:
| Substitute Method | Description |
|---|---|
| None | No Forecast is created for the time series (product location combination) |
| Seasonal | You provide a like item/location that has a similar seasonality pattern. The new time series' forecast is the like item/locations demand forecast with the applied adjustment. The forecast is set to zero (0) for all dates before the new product/location's start date. |
| Lifecycle | You provide a like item/location that had a similar lifecycle pattern as the new item/location. The new item/location's forecast is the like/location's actual historical demand with the applied adjustment shifted such that the like item/locations first sales matches the new item/location's forecast start date. |
| Cloning | You provide a like item/location that has a similar selling pattern as the new item/location. The historical demand of the like item/location is copied into the historical sales of the new item/location. During forecasting, the forecast of the new item/location is generated based on the new item/location's own, copied historical demand. |
| Base Rate of Sales | You provide a base rate of sales for a new item/store combination. The new product's forecast is a combination of the seasonality of the forecast at the corresponding source level and the base rate of sales. Specifically, the formula to calculate the forecast is:
Forecast at time t = source level forecast at time t divided by the average of the source level forecast times the base rate of sales. The base rate of sale is a convenient way to generate (seasonal) forecasts for a new item. No Like item or Clone item is needed. What is necessary is a value for how much the item is selling on average per period. That value works as the interim forecast used to spread the source level forecast down to final level. Because this item is new, the system knows that as you have specified a history start date. The base rate of sale forecast is generated until the TS duration is reached. The TS duration is the difference between forecast start date and history start date. Usually the default history start date is empty, which means it is the beginning of the calendar. If the history start date override is also empty, the forecast start date less the beginning of the calendar (>=2 years) is probably much more than the TS duration, so the item is not considered new. In this case base rate of sales or any new item method, will not work. |
Percent Contribution of Like Item 1
This measure determines the percentage of Like item 1's forecast that is going to be applied towards the forecast of the new item.
Percent Contribution of Like Item 2
This measure determines the percentage of Like item 2's forecast that is going to be applied towards the forecast of the new item.
Percent Contribution of Like Item 3
This measure determines the percentage of Like item 3's forecast that is going to be applied towards the forecast of the new item.
Adjustment Factor
This measure determines how much the combined forecasts are scaled up or down to create the forecast of the new item.
System Recommended Like Item 1
This measure displays the top like item for a given store
System Recommended Like Item 2
This measure displays the second like item for a given store
System Recommended Like Item 3
This measure displays the third like item for a given store
User Selected Like-Item 1
You can override in this measure the top like item for a given store
User Selected Like-Item 2
You can override in this measure the second like item for a given store
User Selected Like-Item 3
You can override in this measure the third like item for a given store
Base Rate of Sales
This measure represents the average sales of a new item/store combination. It is used when specifying 'Base Rate of Sales New SKU' as the Substitution Method to create a forecast for the new item/store combination. The measure can be generated in another application and loaded into RDF, or it can be manually entered by a user.
Forecast Start Date Override
This parameter represents the date to start forecasting for an item/location combination. This parameter can be set in the future if using like-item or Sister-Store functionality, and, upon reaching that time, the forecast is generated. If this date is set to the past, it is ignored in favor of the Forecast Start Date from the Forecast Administration Workbook. This means that the Forecast Start Date for this intersection needs to be edited once it is no longer in the future. For like-item or sister store, the Forecast Start Date and the History Start Date should be set to the same date. It is important to understand how Forecast Start Date should be used in conjunction with Forecast End Date. No value is in this measure if the system default set in the Forecast Administration Workbook is to be used.
|
Note: This measure can also be set in the Forecast Maintenance Workbook. Changes to this measure can be seen in the Forecast Maintenance task. The most recent commit (between either of the tasks) is the value used by the system. |
Forecast End Date Override
This parameter represents the last point in time for which the Forecasting Engine forecasts for an item/location combination. Should this parameter be set to a date less than the Forecast Start Date plus the Forecast Length (in the Forecast Administration Workbook), the engine forecasts zero (0) past this date. If Forecast End Date is more than Forecasting Start Date plus Forecasting Length, no forecast is generated outside Forecasting Start Date plus Forecasting Length window. In other words, both Forecast Start Date and Forecasting End Date are relevant for time periods within the forecast horizon set at the global level. No value is in this measure if the system default set in the Forecast Administration Workbook is to be used.
Forecast End Date can be used for new item or location forecasting if the item or location needs to be forecast for a period shorter than the Like TS Duration.
|
Note: This measure can also be set in the Forecast Maintenance Workbook. Changes to this measure can be seen in the Forecast Maintenance Workbook. The most recent commit (between either of the tasks) is the value used by the system. |
History Start Date Override
This parameter represents the first point in time from which the Forecasting Engine begins training and modeling (that is, if there are two years of history, but only one year is required, set the start date to a year ago). This parameter overrides at the item/store level from the global settings in the Forecast Administration Workbook. This can be used to level out past sales. For example, if there is a large spike in the first three weeks of sales for an item was on sale, set the Historical Start Date to one week past that period. Those first few weeks are not used when generating the forecast.
It is also important to note that the system ignores leading zeros that begin at the history start date. For example, if your history start date is January 1, 2011 and an item/location does not have sales history until February 1, 2011, the system considers the starting point in that item/location's history to be the first data point where there is a non-zero sales value.
The History Start Date for the new item or new store should be set with the same date as the Forecast Start Date.
|
Note: When using any of the Lifecycle Methods, the History Start Date for the substitute item or location must be set to the point in the sales history that the new item or location begins using as its sales. |
|
Note: This measure can also be set in the Forecast Maintenance Task workbook. Changes to this measure can be seen in the Forecast Maintenance Task workbook. The most recent commit (between either of the tasks) is the value used by the system. |
This workbook is intended for new items that have received like item recommendations, and were auto-approved. You can review recommendations, as well as metrics that support the recommendations. The recommendations are made by similarity of items, which in turns is based on how close a new item's attributes are compared to all existing items' attributes.
The workbook can be built two ways, either:
Use the approved items alert
Use the task flow, in which case a pre-range mask narrows down the product hierarchy to only the relevant items
To build the New Item Maintenance workbook, perform these steps:
Click the New Workbook icon in the New Item Maintenance task in the New Item & Locations activity.
The Workbook wizard opens. Select the domain for this workbook and click OK.
The New Item Maintenance workbook is built.
This step contains these available views:
The Attribute Match view is the same view as in the New Item Review workbook, but with different items. The new items included in this workbook have approved like item recommendations.
The Attribute Match view contains the following measures:
Attribute Value
This measure displays the content of the attribute. For instance the unit of measure (UOM) attribute can have different values. It can be inch or XL for fashion items. Or it can be ounce or grams for grocery items.
Attribute Scores
This measure displays the quantitative fit of the attribute values between new and existing items. For instance we can compare the UOM attribute between a coffee pack and a pair of jeans. The relevance of matching ounces and inches may not be very high, and the attribute score is likely zero. However, if we compare color attribute of a shirt and a t-shirt, the match be more relevant and the score is larger than zero.
This measure incorporates the goodness of the fit in attributes between new and existing items, as well as how important an attribute is for the new item. If the new item is a carbonated drink, the brand attribute may be much more relevant than the price tier, because the consumer is prepared to pay a higher price for a brand item
The New Item Attributes view displays attribute information about new items.
The New Item Attributes view contains the following measures:
Attribute Weight
This measure displays the relative importance of the attributes for a given new item. While the flavor family may not be important for a t-shirt, and the attribute has a weight of zero, the brand and color attributes definitely are. Their relative importance may be 0.2 for the color and 0.3 for the brand.
|
Note: That the sum of all attribute weights doesn't need to be 1 for every item. The automatic like item recommendation algorithm is taking care of it. The most likely scenario is that this measure is loaded, but it can be review and adjusted in this view. |
Numeric Attribute Tau
This measure helps decide the goodness of fit between to attribute values. If we compare the colors of two items, the values are either equal (red = red) or not (red!= black). However there are cases when two values are very close but not equal, and the user sets a threshold to help decide if the values should be a match or not.
For instance the size of a bottle of water is 16 floz, which is roughly 473 ml. When comparing this item with another bottle of water which is 500 ml, the numbers are not matching. However, this may be a case where the user sets a value for tau, that allows the 500 ml to be in the acceptable range of the 473 ml. The formula to decide if a match is acceptable as shown. If both attribute values are not Null, then
If abs(value1-value2) is less equal threshold tau * max(value1, value2)
Then the match=1
Otherwise the match is 0
Attribute Value
This measure displays the content of the attribute. For instance the unit of measure (UOM) attribute can have different values. It can be inch or XL for fashion items. Or it can be ounce or grams for grocery items.
The Similarity Score view is the same view as in the New Item Review workbook, but with different items. The new items included in this workbook have approved like item recommendations.
The Similarity Score view contains the following measure:
Similarity Scores
The Similarity Score is a measure of how well a new item's demand behavior can be modeled after a certain existing item's. The higher the score, the better the fit, and the better the chance that the existing item is going to be the like item
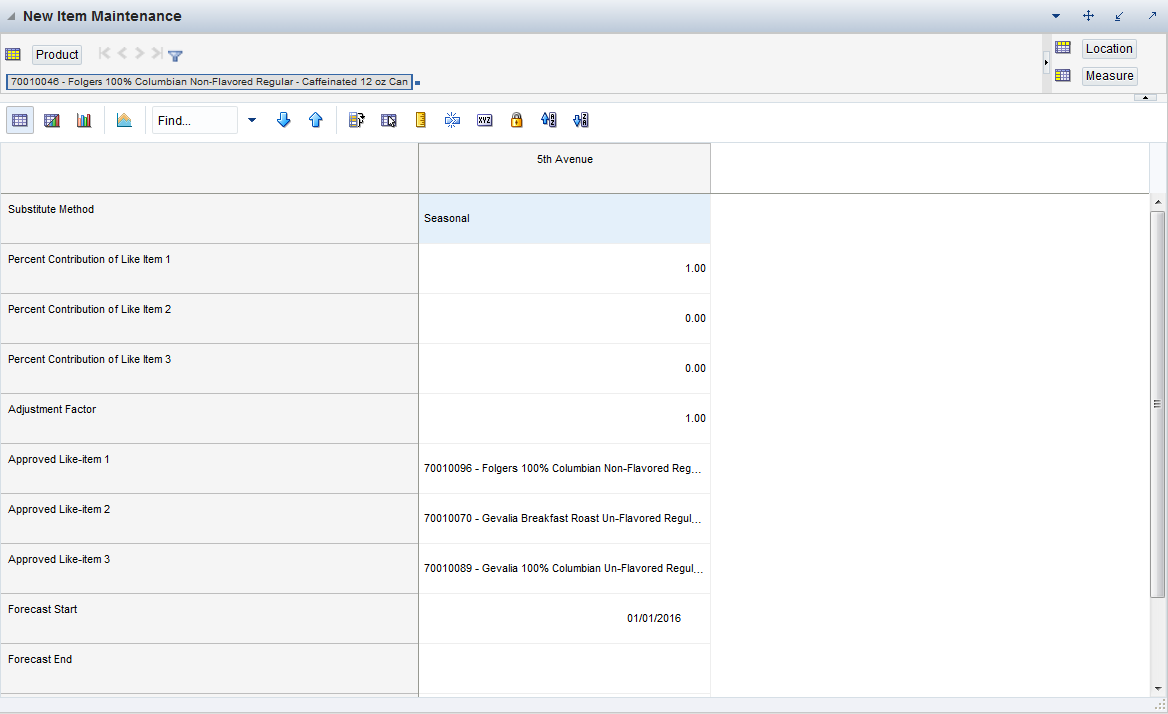
The New Item Maintenance view is a subset of a the Select and Approve view in the New Item Review workbook, but with different items. The new items included in this workbook have approved like item recommendations.
The New Item Maintenance view contains the following measures:
Substitute Method
This measure displays a list where you can select the substitute method. When a Substitute Method is used to forecast, the method set for an intersection is cleared once the Default Forecast Start Date is greater than the Forecast Start Date Override plus the Like TS Duration for the intersection. Valid options are:
| Substitute Method | Description |
|---|---|
| None | No Forecast is created for the time series (product location combination) |
| Seasonal | You provide a like item/location that has a similar seasonality pattern. The new time series' forecast is the like item/locations demand forecast with the applied adjustment. The forecast is set to zero (0) for all dates before the new product/location's start date. |
| Lifecycle | You provide a like item/location that had a similar lifecycle pattern as the new item/location. The new item/location's forecast is the like/location's actual historical demand with the applied adjustment shifted such that the like item/locations first sales matches the new item/location's forecast start date. |
| Cloning | You provide a like item/location that has a similar selling pattern as the new item/location. The historical demand of the like item/location is copied into the historical sales of the new item/location. During forecasting, the forecast of the new item/location is generated based on the new item/location's own, copied historical demand. |
| Base Rate of Sales | You provide a base rate of sales for a new item/store combination. The new product's forecast is a combination of the seasonality of the forecast at the corresponding source level and the base rate of sales. Specifically, the formula to calculate the forecast is:
Forecast at time t = source level forecast at time t divided by the average of the source level forecast times the base rate of sales. The base rate of sale is a convenient way to generate (seasonal) forecasts for a new item. No Like item or Clone item is needed. What is necessary is a value for how much the item is selling on average per period. That value works as the interim forecast used to spread the source level forecast down to final level. Because this item is new, the system knows that as you have specified a history start date. The base rate of sale forecast is generated until the TS duration is reached. The TS duration is the difference between forecast start date and history start date. Usually the default history start date is empty, which means it is the beginning of the calendar. If the history start date override is also empty, the forecast start date less the beginning of the calendar (>=2 years) is probably much more than the TS duration, so the item is not considered new. In this case base rate of sales or any new item method, will not work. |
Percent Contribution of Like Item 1
This measure determines the percentage of Like item 1's forecast that is going to be applied towards the forecast of the new item.
Percent Contribution of Like Item 2
This measure determines the percentage of Like item 2's forecast that is going to be applied towards the forecast of the new item.
Percent Contribution of Like Item 3
This measure determines the percentage of Like item 3's forecast that is going to be applied towards the forecast of the new item.
Adjustment Factor
This measure determines how much the combined forecasts are scaled up or down to create the forecast of the new item.
System Recommended Like Item 1
This measure displays the top like item for a given store
System Recommended Like Item 2
This measure displays the second like item for a given store
System Recommended Like Item 3
This measure displays the third like item for a given store
Base Rate of Sales
This measure represents the average sales of a new item/store combination. It is used when specifying 'Base Rate of Sales New SKU' as the Substitution Method to create a forecast for the new item/store combination. The measure can be generated in another application and loaded into RDF, or it can be manually entered by a user.
Forecast Start Date Override
This parameter represents the date to start forecasting for an item/location combination. This parameter can be set in the future if using like-item or Sister-Store functionality, and, upon reaching that time, the forecast is generated. If this date is set to the past, it is ignored in favor of the Forecast Start Date from the Forecast Administration Workbook. This means that the Forecast Start Date for this intersection needs to be edited once it is no longer in the future. For like-item or sister store, the Forecast Start Date and the History Start Date should be set to the same date. It is important to understand how Forecast Start Date should be used in conjunction with Forecast End Date. No value is in this measure if the system default set in the Forecast Administration Workbook is to be used.
|
Note: This measure can also be set in the Forecast Maintenance Workbook. Changes to this measure can be seen in the Forecast Maintenance task. The most recent commit (between either of the tasks) is the value used by the system. |
Forecast End Date Override
This parameter represents the last point in time for which the Forecasting Engine forecasts for an item/location combination. Should this parameter be set to a date less than the Forecast Start Date plus the Forecast Length (in the Forecast Administration Workbook), the engine forecasts zero (0) past this date. If Forecast End Date is more than Forecasting Start Date plus Forecasting Length, no forecast is generated outside Forecasting Start Date plus Forecasting Length window. In other words, both Forecast Start Date and Forecasting End Date are relevant for time periods within the forecast horizon set at the global level. No value is in this measure if the system default set in the Forecast Administration Workbook is to be used.
Forecast End Date can be used for new item or location forecasting if the item or location needs to be forecast for a period shorter than the Like TS Duration.
|
Note: This measure can also be set in the Forecast Maintenance Workbook. Changes to this measure can be seen in the Forecast Maintenance Workbook. The most recent commit (between either of the tasks) is the value used by the system. |
History Start Date Override
This parameter represents the first point in time from which the Forecasting Engine begins training and modeling (that is, if there are two years of history, but only one year is required, set the start date to a year ago). This parameter overrides at the item/store level from the global settings in the Forecast Administration Workbook. This can be used to level out past sales. For example, if there is a large spike in the first three weeks of sales for an item was on sale, set the Historical Start Date to one week past that period. Those first few weeks are not used when generating the forecast.
It is also important to note that the system ignores leading zeros that begin at the history start date. For example, if your history start date is January 1, 2011 and an item/location does not have sales history until February 1, 2011, the system considers the starting point in that item/location's history to be the first data point where there is a non-zero sales value.
The History Start Date for the new item or new store should be set with the same date as the Forecast Start Date.
|
Note: When using any of the Lifecycle Methods, the History Start Date for the substitute item or location must be set to the point in the sales history that the new item or location begins using as its sales. |
|
Note: This measure can also be set in the Forecast Maintenance Task workbook. Changes to this measure can be seen in the Forecast Maintenance Task workbook. The most recent commit (between either of the tasks) is the value used by the system. |
This workbook does not have an automated like store recommendation for new stores. The assignment is made manually. In this view the selection of the like store is for all products carried in a store. You must know which stores are new and select them in the wizard during the workbook build.
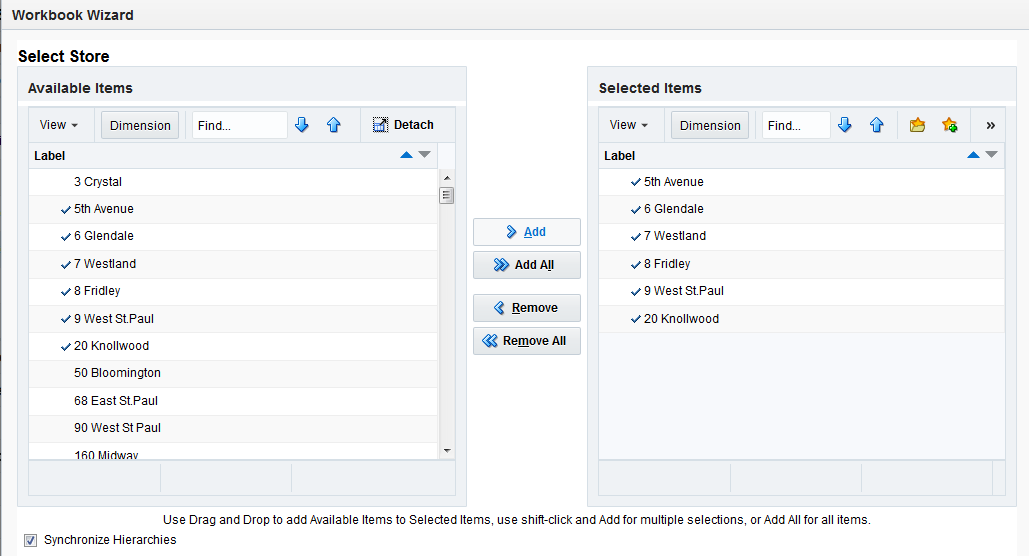
To build the Business Support Like Store workbook, perform these steps:
Click the New Workbook icon in the Business Support Like Store task in the New Items & Locations activity.
The Workbook wizard opens. Select the stores you want to work with and click and click Finish
The Business Support Like Store workbook is built.
This step contains views for like store assignments that must be made manually.
The available view is:
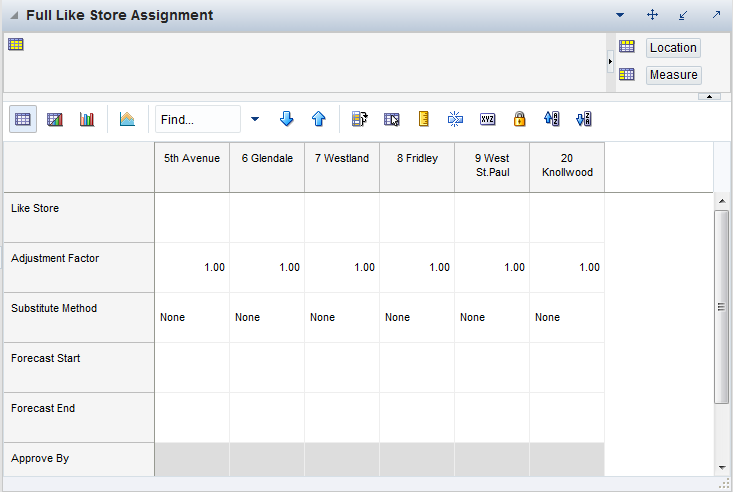
The Business Support Like Store Assignment view does not have an automated like store recommendation for new stores. The assignment is made manually. In this view the selection of the like store is for all products carried in a store. You must know which stores are new and select them in the wizard during the workbook build.
The Business Support Like Store Assignment view contains the following measures:
Like Store
In this measure, you can specify an existing store to serve as like store for all available products.
Adjustment Factor
This measure determines how much the combined forecasts are scaled up or down to create the forecast of the new item.
Substitute Method
This measure displays a list where you can select the substitute method. When a Substitute Method is used to forecast, the method set for an intersection is cleared once the Default Forecast Start Date is greater than the Forecast Start Date Override plus the Like TS Duration for the intersection. Valid options are:
| Substitute Method | Description |
|---|---|
| None | No Forecast is created for the time series (product location combination) |
| Seasonal | You provide a like item/location that has a similar seasonality pattern. The new time series' forecast is the like item/locations demand forecast with the applied adjustment. The forecast is set to zero (0) for all dates before the new product/location's start date. |
| Lifecycle | You provide a like item/location that had a similar lifecycle pattern as the new item/location. The new item/location's forecast is the like/location's actual historical demand with the applied adjustment shifted such that the like item/locations first sales matches the new item/location's forecast start date. |
| Cloning | You provide a like item/location that has a similar selling pattern as the new item/location. The historical demand of the like item/location is copied into the historical sales of the new item/location. During forecasting, the forecast of the new item/location is generated based on the new item/location's own, copied historical demand. |
| Base Rate of Sales | You provide a base rate of sales for a new item/store combination. The new product's forecast is a combination of the seasonality of the forecast at the corresponding source level and the base rate of sales. Specifically, the formula to calculate the forecast is:
Forecast at time t = source level forecast at time t divided by the average of the source level forecast times the base rate of sales. The base rate of sale is a convenient way to generate (seasonal) forecasts for a new item. No Like item or Clone item is needed. What is necessary is a value for how much the item is selling on average per period. That value works as the interim forecast used to spread the source level forecast down to final level. Because this item is new, the system knows that as you have specified a history start date. The base rate of sale forecast is generated until the TS duration is reached. The TS duration is the difference between forecast start date and history start date. Usually the default history start date is empty, which means it is the beginning of the calendar. If the history start date override is also empty, the forecast start date less the beginning of the calendar (>=2 years) is probably much more than the TS duration, so the item is not considered new. In this case base rate of sales or any new item method, will not work. |
Forecast Start Date Override
This parameter represents the date to start forecasting for an item/location combination. This parameter can be set in the future if using like-item or Sister-Store functionality, and, upon reaching that time, the forecast is generated. If this date is set to the past, it is ignored in favor of the Forecast Start Date from the Forecast Administration Workbook. This means that the Forecast Start Date for this intersection needs to be edited once it is no longer in the future. For like-item or sister store, the Forecast Start Date and the History Start Date should be set to the same date. It is important to understand how Forecast Start Date should be used in conjunction with Forecast End Date. No value is in this measure if the system default set in the Forecast Administration Workbook is to be used.
|
Note: This measure can also be set in the Forecast Maintenance Workbook. Changes to this measure can be seen in the Forecast Maintenance task. The most recent commit (between either of the tasks) is the value used by the system. |
Forecast End Date Override
This parameter represents the last point in time for which the Forecasting Engine forecasts for an item/location combination. Should this parameter be set to a date less than the Forecast Start Date plus the Forecast Length (in the Forecast Administration Workbook), the engine forecasts zero (0) past this date. If Forecast End Date is more than Forecasting Start Date plus Forecasting Length, no forecast is generated outside Forecasting Start Date plus Forecasting Length window. In other words, both Forecast Start Date and Forecasting End Date are relevant for time periods within the forecast horizon set at the global level. No value is in this measure if the system default set in the Forecast Administration Workbook is to be used.
Forecast End Date can be used for new item or location forecasting if the item or location needs to be forecast for a period shorter than the Like TS Duration.
|
Note: This measure can also be set in the Forecast Maintenance Workbook. Changes to this measure can be seen in the Forecast Maintenance Workbook. The most recent commit (between either of the tasks) is the value used by the system. |
Approve Date
This measure displays the date when the like store recommendation was approved by running the custom menu.
Approve By
This measure displays the user name who approved the like store recommendation by running the custom menu.
If the setup available in the Business Support view is not enough for some or all new stores, you can be more specific in this workbook.
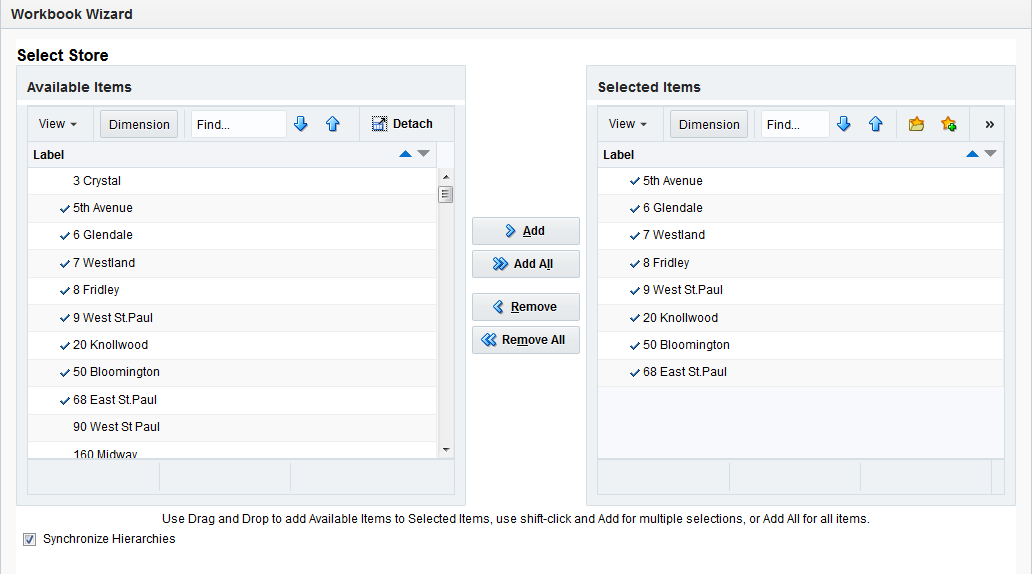
To build the Forecaster Like Store workbook, perform these steps:
Click the New Workbook icon in the Forecaster Like Store task in the New Items & Locations activity.
The Workbook wizard opens. Select the stores you want to work with and click and click Finish.
The Forecaster Like Store workbook is built.
This step contains views more specific than in the Business Support Like Store Assignment View.
The available view is:
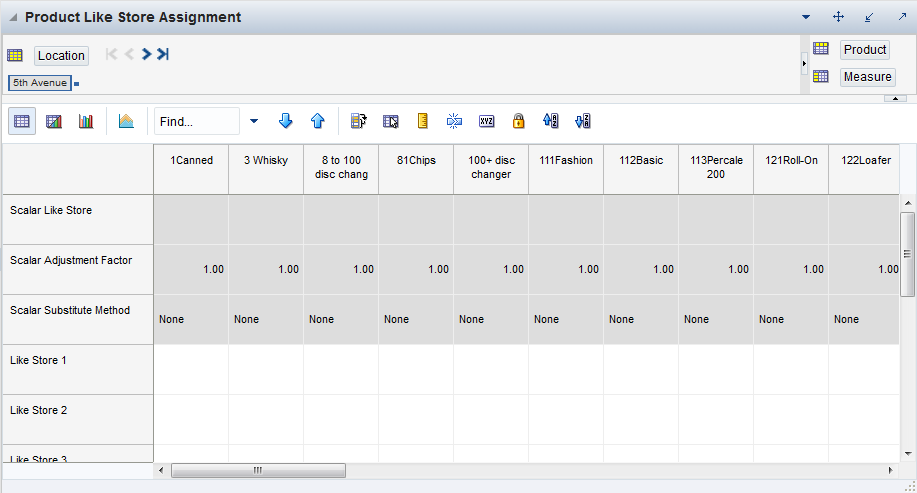
The Forecaster Like Store Assignment view is at the intersection of prod/location, so all parameters can vary by product. For instance a new store opening in the Midwest can have a like store from Alaska for items in the Shovels department. However, for Summer items, the like store is picked from the Northeast region.All measures can be adjusted by product, but there are some where a default value is available for all items.
The Forecaster Like Store Assignment view contains the following measures:
Scalar Like Store
This measure displays the like store that was selected in the Business Support step. The information is read only. The selection can be further refined by using other measures in this view.
Scalar Adjustment Factor
This measure displays the adjustment factor that was selected in the Business Support step. The information is read only. The selection can be further refined by using other measures in this view.
Scalar Substitution Method
This measure displays the substitute method that was selected in the Business Support step. The information is read only. The selection can be further refined by using other measures in this view.
Like Store 1
In this measure the user can specify the first like store. Note how the like store can be different by product. In RDF, a different first like store selection can be made for every subclass.
Like Store 2
In this measure the user can specify the second like store. Note how the like store can be different by product. In RDF, a different second like store selection can be made for every subclass.
Like Store 3
In this measure the user can specify the third like store. Note how the like store can be different by product. In RDF, a different third like store selection can be made for every subclass.
Adjustment Factor
This measure determines how much the combined forecasts are scaled up or down to create the forecast of the new item.
Substitute Method
This measure displays a list where you can select the substitute method. When a Substitute Method is used to forecast, the method set for an intersection is cleared once the Default Forecast Start Date is greater than the Forecast Start Date Override plus the Like TS Duration for the intersection. Valid options are:
| Substitute Method | Description |
|---|---|
| None | No Forecast is created for the time series (product location combination) |
| Seasonal | You provide a like item/location that has a similar seasonality pattern. The new time series' forecast is the like item/locations demand forecast with the applied adjustment. The forecast is set to zero (0) for all dates before the new product/location's start date. |
| Lifecycle | You provide a like item/location that had a similar lifecycle pattern as the new item/location. The new item/location's forecast is the like/location's actual historical demand with the applied adjustment shifted such that the like item/locations first sales matches the new item/location's forecast start date. |
| Cloning | You provide a like item/location that has a similar selling pattern as the new item/location. The historical demand of the like item/location is copied into the historical sales of the new item/location. During forecasting, the forecast of the new item/location is generated based on the new item/location's own, copied historical demand. |
| Base Rate of Sales | You provide a base rate of sales for a new item/store combination. The new product's forecast is a combination of the seasonality of the forecast at the corresponding source level and the base rate of sales. Specifically, the formula to calculate the forecast is:
Forecast at time t = source level forecast at time t divided by the average of the source level forecast times the base rate of sales. The base rate of sale is a convenient way to generate (seasonal) forecasts for a new item. No Like item or Clone item is needed. What is necessary is a value for how much the item is selling on average per period. That value works as the interim forecast used to spread the source level forecast down to final level. Because this item is new, the system knows that as you have specified a history start date. The base rate of sale forecast is generated until the TS duration is reached. The TS duration is the difference between forecast start date and history start date. Usually the default history start date is empty, which means it is the beginning of the calendar. If the history start date override is also empty, the forecast start date less the beginning of the calendar (>=2 years) is probably much more than the TS duration, so the item is not considered new. In this case base rate of sales or any new item method, will not work. |
Percent Contribution of Like Store 1
This measure determines the percentage of Like Store 1's forecast that is going to be applied towards the forecast of the new item.
Percent Contribution of Like Store 2
This measure determines the percentage of Like Store 2's forecast that is going to be applied towards the forecast of the new item.
Percent Contribution of Like Store 3
This measure determines the percentage of Like Store 3's forecast that is going to be applied towards the forecast of the new item.