| Oracle® Retail Demand Forecasting User Guide for the RPAS Fusion Client Release 16.0 E91109-03 |
|

 Previous |
 Next |
| Oracle® Retail Demand Forecasting User Guide for the RPAS Fusion Client Release 16.0 E91109-03 |
|
Previous |
Next |
This chapter describes how the preprocessing functionality is implemented in RDF using the Source Measure Maintenance Workbook.
The functionality in the Source Measure Maintenance Task is a superset of the functionality in the Preprocessing Administration Task. The purpose and functionality between the two is described inSource Measure Maintenance Functionality.
Use the Source Measure Maintenance Workbook to perform the steps for this task:
The Preprocess Administration Workbook and the Source Measure Maintenance Workbook have a large set of common content. The main difference is that while the Source Measure Maintenance Workbook has the calendar hierarchy, on top of the product and location, and the Preprocess Administration Workbook has only the product and location.The additional hierarchy allows the review of the time-phased preprocessing measures, as well as the calculated forecasting data sources.runs.
Due to their additional dimension of week, these measures add to the size of the workbook, and also make workbook operations slower. For instance, workbook build, refresh, commit, and so on, take longer than in the otherwise similar Preprocess Administration Workbook.
Preprocess Administration Workbook
The Preprocess Administration Workbook, described inChapter 5 is at the product/location intersection, so it can be built with a lot of positions, without experiencing poor performance. The purpose is to set preprocessing parameters, which are inputs to the special expression that is run in batch.
Source Measure Maintenance Workbook
The Source Measure Maintenance Workbook, described in this chapter, is at the product/location/calendar intersection, and is a lot more data intensive. The purpose is to set preprocessing parameters and run the data filtering online, with the ability to review the results without having to wait for an overnight batch. If the results are not as expected, or you want to experiment with different settings, you can make changes to the parameters and rerun the custom menus. To achieve this it is expected that only a small subset of the available product/locations is included in the workbook.
The following table lists the workbooks, steps, and views for the Preprocess Review and What-if task.
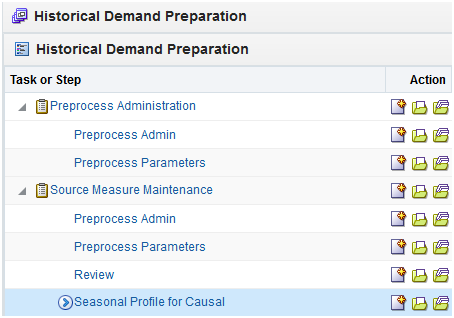
To build the Source Measure Maintenance workbook, perform these steps:
Click the New Workbook icon in the Source Measure Maintenance task in the Historical Demand Preparation activity.
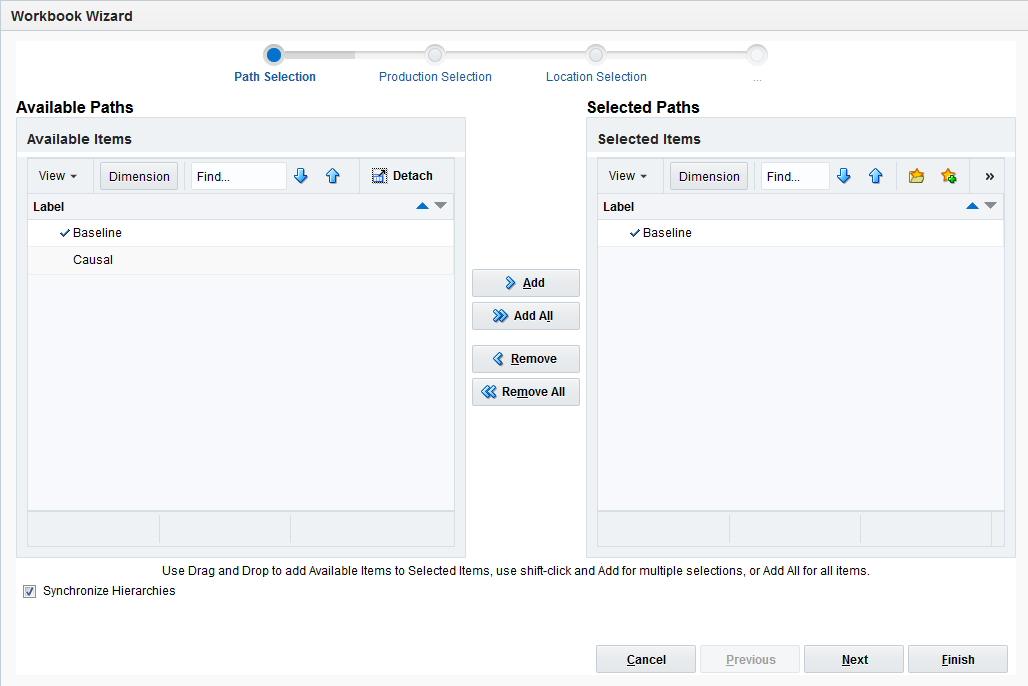
The Workbook wizard opens. Select your path and click Next.
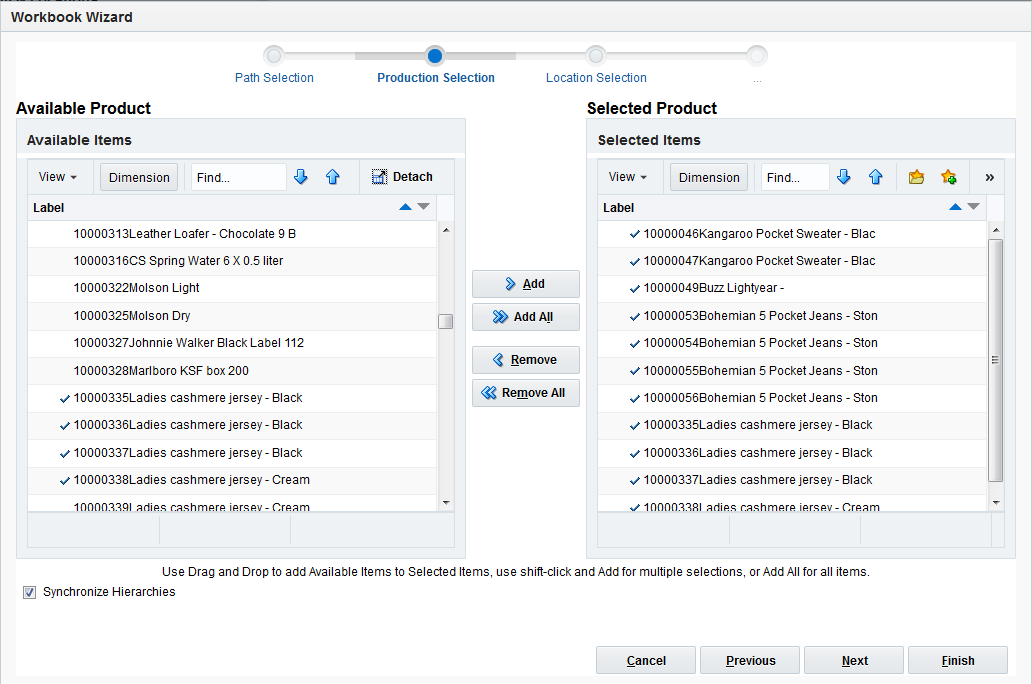
Select the products you want to work with and click Next.
|
Note: It is important to include all products that are members of the Merchandise dimensions in the forecast levels to be analyzed. For example, if you select to view a forecast level that is defined at subclass/store/week, you must include all items that are members of the particular subclass to be analyzed. It is recommended that Position Query functionality or selection from aggregate levels in the Merchandise hierarchy is employed if the task supports an AutoTask build. |
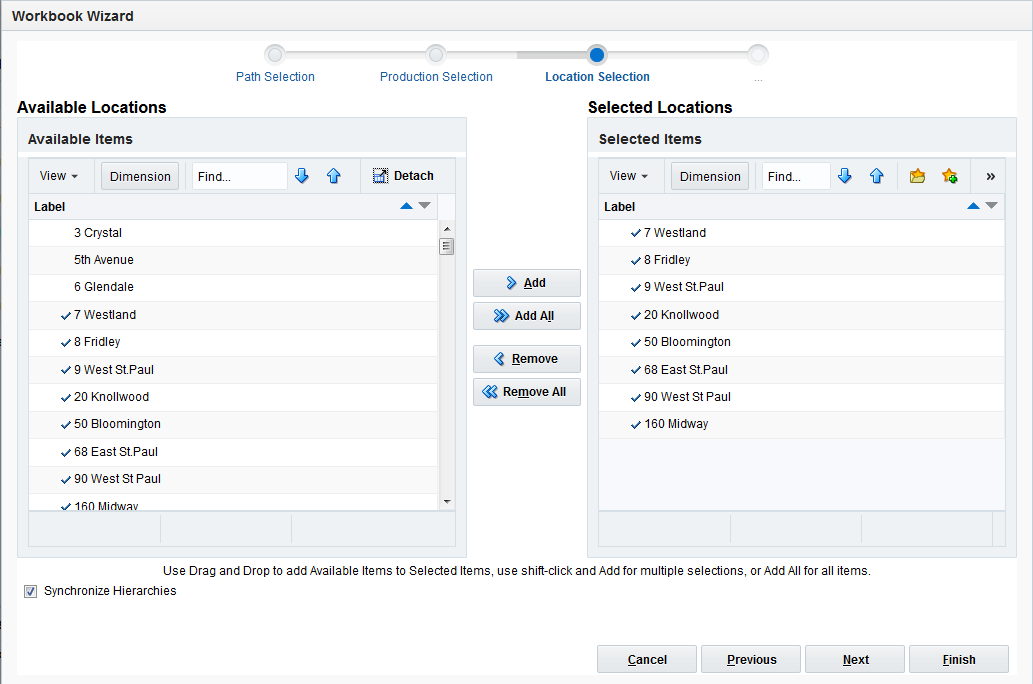
The Workbook wizard opens. Select the specific locations that you want to view and click Next.
|
Note: It is important to include all locations that are members of the location dimensions in the forecast levels to be analyzed. For example, if you select to view a forecast level that is defined at item/chain/week, you should include all locations that are members of the particular chain to be analyzed. It is recommended that Position Query functionality or selection from aggregate levels in the location hierarchy is employed if the task supports an AutoTask build. |
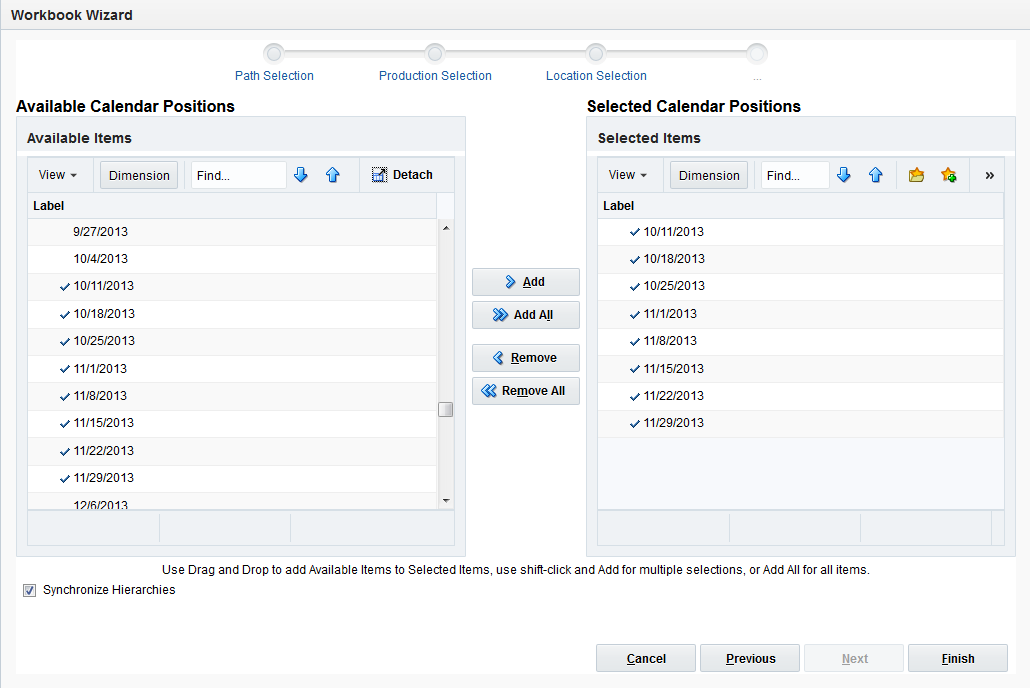
Select the weeks of the forecast you wish to review and click Finish:
The Source Measure Maintenance workbook is built.
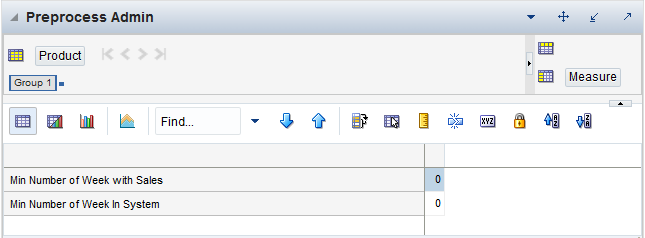
This step contains the Preprocess Admin view that allows you to define the scope of the preprocessing run, as well as filter out item/locations where preprocessing does not make sense because of lack of enough historical sales.
The Preprocessing Admin view displays the scope of the preprocessing run.
The Preprocessing Admin view contains the following measures:
Min Number of Weeks in System
This parameter defines the number of periods from when an item was introduced in the system. Usually the introduction time is considered to be the date when the item first sold. This check is also introduced to stop making data corrections for items that are very new, and where cleansing would be unreliable.
Min Number of Weeks with Sales
This parameter defines the number of weeks with sales that an item/store combination needs to have to qualify for data cleansing. The reasoning behind this check is that for items without enough data, corrections may not be reliable. Once there is enough data, and trends become clearer, corrections can be made.
This step has this view:
Depending on your wizard selection for either baseline or causal, the view shows the preprocessing parameters for each relevant run. For example if baseline is selected, the view displays preprocessing information for the four runs that are configured. If causal is selected, the view shows preprocessing parameters for three runs.
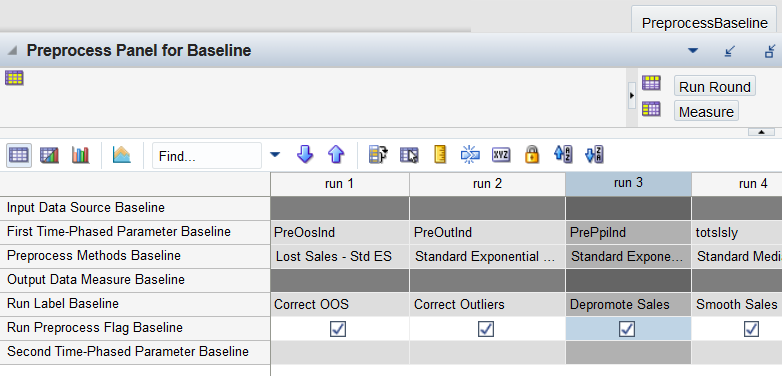
Baseline View
The baseline view displays the measures necessary to create the data source for baseline forecasting. This involves four rounds of preprocessing that run in batch or online in this order:
Correcting for stockouts
Correcting for outliers
Depromoting sales
Smooth sales
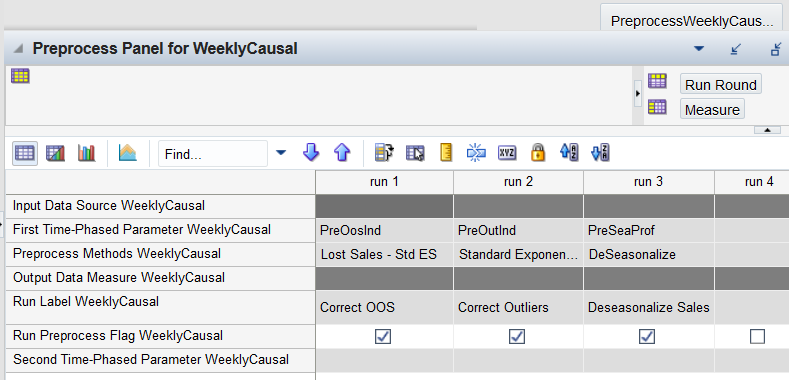
Causal View
The causal view displays the measures necessary to create the data source for causal forecasting. This involves three rounds of preprocessing that are run in batch:
Correcting for stockouts
Correcting for outliers
Deseasonalizing the measure to create the causal data source
|
Note: In Figure 6-8, baseline was the selected wizard option when building the Source Measure Maintenance Workbook. |
The Preprocessing Panel (for Baseline or Causal)view contains the following measures:
Input Data Source
Indicates the measure that will be corrected. This is the input to the first preprocessing run. There are no inputs available for other runs other than the first run.
First Time-Phased Parameter Causal
This measure stores the first time-phased measure that is required for some preprocessing methods. For instance, for the STD ES LS method, this measure would store the measure name of the outage flag. Or for the STD ES method, it could store the name of the outlier flag.
Preprocess Method
Name of the preprocessing method to be used for each run. This method is selected in the Configuration Tools.
Output Data Measure
Indicates the measure that stores the result of the last configured preprocessing run. For instance, for the Preprocess Panel for Causal, the output comes from run 3.
Run Label
A label denoting the purpose of the preprocessing run, for example, Correct Outliers, or Smooth Sales.
Run Preprocess Flag
Boolean measure indicating if this run should be enabled or skipped.
Second Time-Phased Parameter Causal
This measure stores the second time-phased measure that is required for some preprocessing methods. For instance, for the Forecast Sigma method, this measure would store measure name of the confidence intervals. Or for the Override method it could store the measure name of the outage flag.
Preprocess Simulation Baseline or Causal
Depending on the level selected, the custom menu is called either Preprocess Baseline or Preprocess Causal and performs the following actions:
Correcting for stockouts
Correcting for outliers
Depromoting sales (only applies to Preprocess Baseline)
Deseasonalize Sales (only applies to Preprocess Causal)
Smooth sales (only applies to Preprocess Baseline)
The ultimate goal for Preprocess Simulation is to create the source data for generating forecasts:
Baseline Sales: source data for baseline forecast generation
Deseasonalized Sales: source data for causal forecast generation
The main purpose of this step is to display time-phased measures that represent input and output to the preprocessing stages, run in batch based on the settings selected in the Preprocessing Admin tasks.
This view displays measures that represent input and output of the preprocessing runs, in table format.
The Source Maintenance view contains the following measures:
User Adjustment
In this measure, you can enter values that are going to be added to the preprocessing adjustments to create the data sources.
The logic is: data source = weekly sales + preprocessing adjustments + user adjustment
This measure is read/write.
Weekly Sales
This measure stores the raw sales loaded in RDF. This is the input to the first run of preprocessing. This measure is read only.
Data Source
This measure represents the output of the preprocessed raw sales, as well as incorporates the user adjustments according to the formula:
data source = weekly sales + preprocessing adjustments + user adjustments.
Out of Stock Indicator
This measure is either loaded or calculated by the rules in the custom menu. It is used during the pre-processing run that corrects sales for lost sales.
Outliers Indicator
This measure is either loaded or calculated by the rules in the custom menu. It is used during the pre-processing run that corrects the sales for outliers.
Promotion Indicator
This measure is usually calculated as the or of all available Boolean promotional variables. It is used during the preprocessing run that removes promotional sales.
This view displays measures that represent input and output of the preprocessing runs, in table format. The measures are the same as in the Source Maintenance View, but displayed in chart form.
The Source Maintenance Plot view contains the following measures:
User Adjustment
In this measure, you can enter values that are going to be added to the preprocessing adjustments to create the data sources.
The logic is: data source = weekly sales + preprocessing adjustments + user adjustment
This measure is read/write.
Weekly Sales
This measure stores the raw sales loaded in RDF. This is the input to the first run of preprocessing. This measure is read only.
Data Source
This measure represents the output of the preprocessed raw sales, as well as incorporates the user adjustments according to the formula:
data source = weekly sales + preprocessing adjustments + user adjustments.
Out of Stock Indicator
This measure is either loaded or calculated by the rules in the custom menu. It is used during the pre-processing run that corrects sales for lost sales.
Outliers Indicator
This measure is either loaded or calculated by the rules in the custom menu. It is used during the pre-processing run that corrects the sales for outliers.
Promotion Indicator
This measure is usually calculated as the or of all available Boolean promotional variables. It is used during the preprocessing run that removes promotional sales.
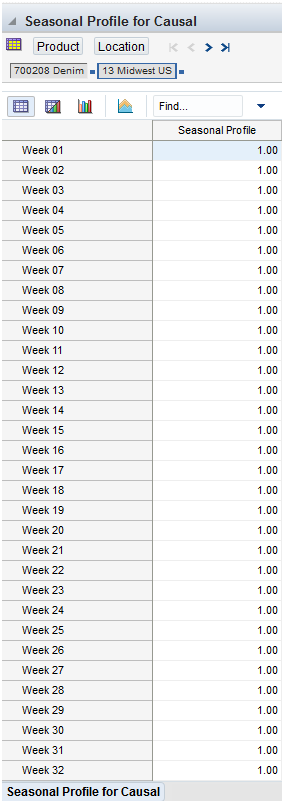
The purpose of this step is to display and allow for editing a week-of-year profile, that can be used during the preprocessing run to de-seasonalize the demand that is used as data source for the causal run.
This step is only available if the workbook is built for the baseline level.
The view displays the seasonal profile that can be used to deseasonalize the data source for the causal run. One of the options is to load the profile, and the user can review and adjust it in this view. If the profile is not available the user can manually key in the values. Since a profile is usually higher than the forecast intersection, e.g., item/store, this view is at subclass/region. However, the user can roll up the view to an even higher intersection, for instance, department/chain, and there enter the values, which are evenly replicated to subclass/region by clicking Calculate.