| Oracle® Retail Demand Forecasting User Guide for the RPAS Fusion Client Release 16.0 E91109-03 |
|

 Previous |
 Next |
| Oracle® Retail Demand Forecasting User Guide for the RPAS Fusion Client Release 16.0 E91109-03 |
|
Previous |
Next |
This chapter describes the purpose and content of the Forecast Scorecard and the steps required in order to create and access this task. This chapter also discusses the two types of views contained in the Forecast Scorecard task, as well as the definitions of parameters that exist in each. Evaluating forecast accuracy through the use of error statistics is discussed, as is the process of comparing historical forecasts to actual sales data.
The purpose of the Forecast Scorecard is to monitor the accuracy of both approved system forecasts and approved final forecasts. Once a forecast has been generated and actual point-of-sale data is received for the forecast period, statistical information can be reviewed to help you analyze the accuracy of forecasting models and methods.
The Forecast Scorecard consists of a wizard and these views:
Based on your selections in the wizard, the Forecast Scorecard provides statistical information and comparison data that allow you to monitor the accuracy of system-generated forecasts and final approved forecasts.
To build the Forecast Scorecard workbook, perform these steps:
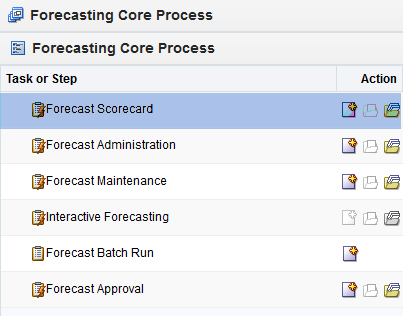
Click the New Workbook icon in the Forecast Scorecard task in the Forecasting Core Process activity.
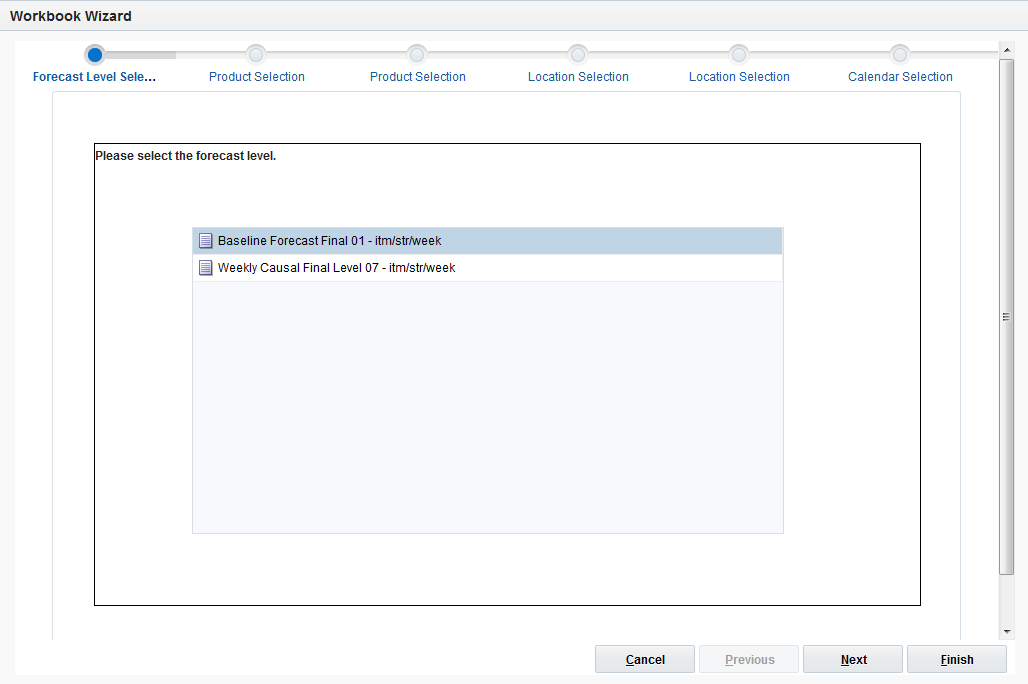
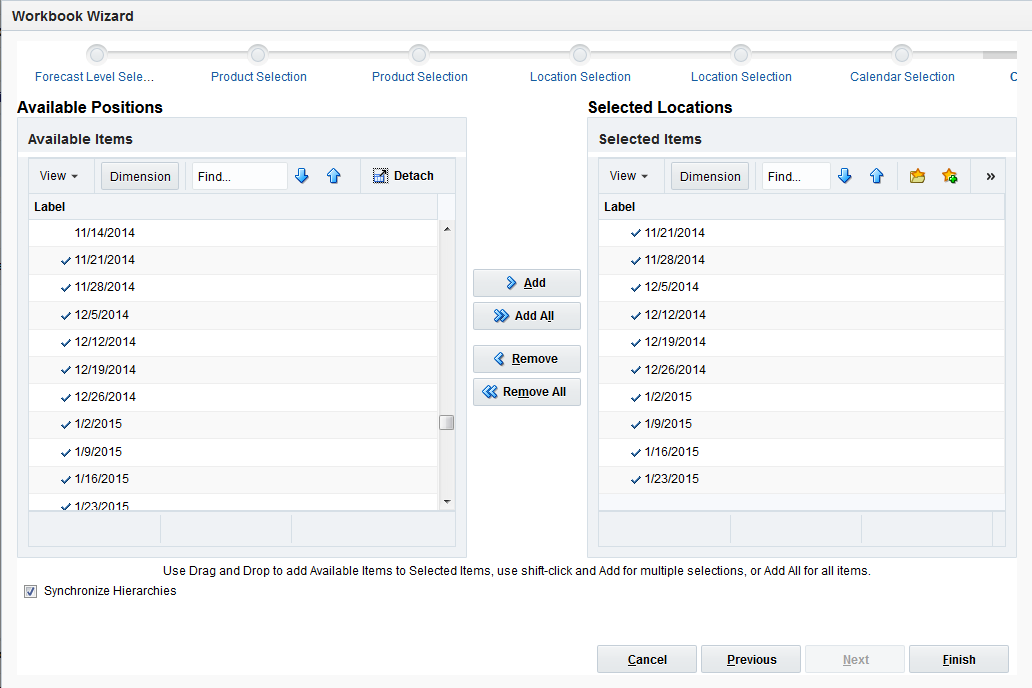
The Workbook wizard opens. Select the final forecast level that you want to evaluate and click Next.
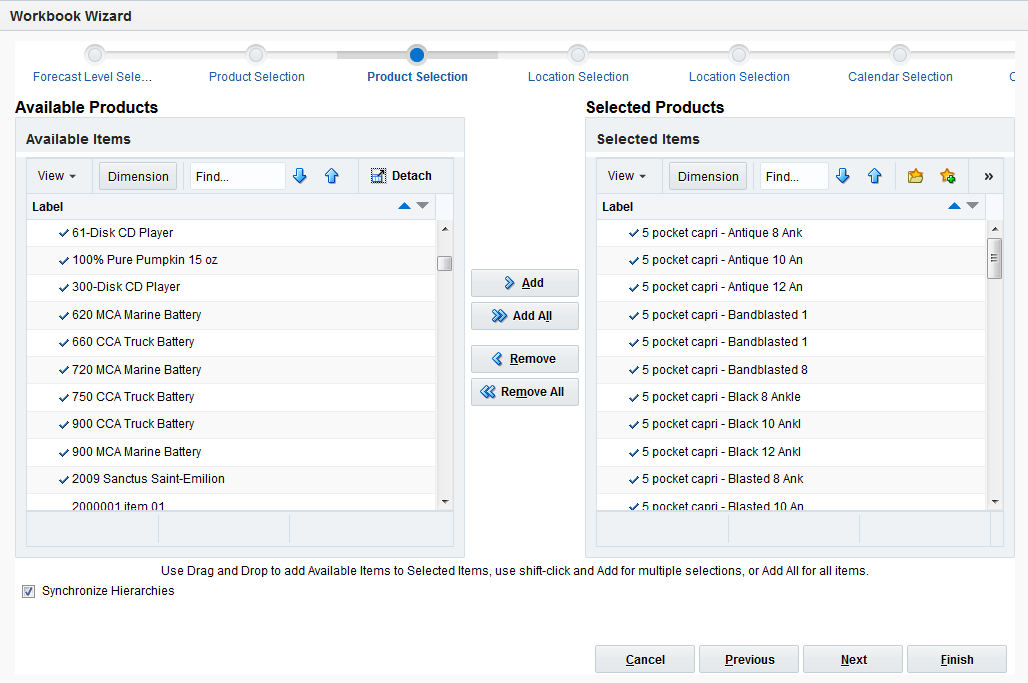
Select the products you want to work with and click Next.
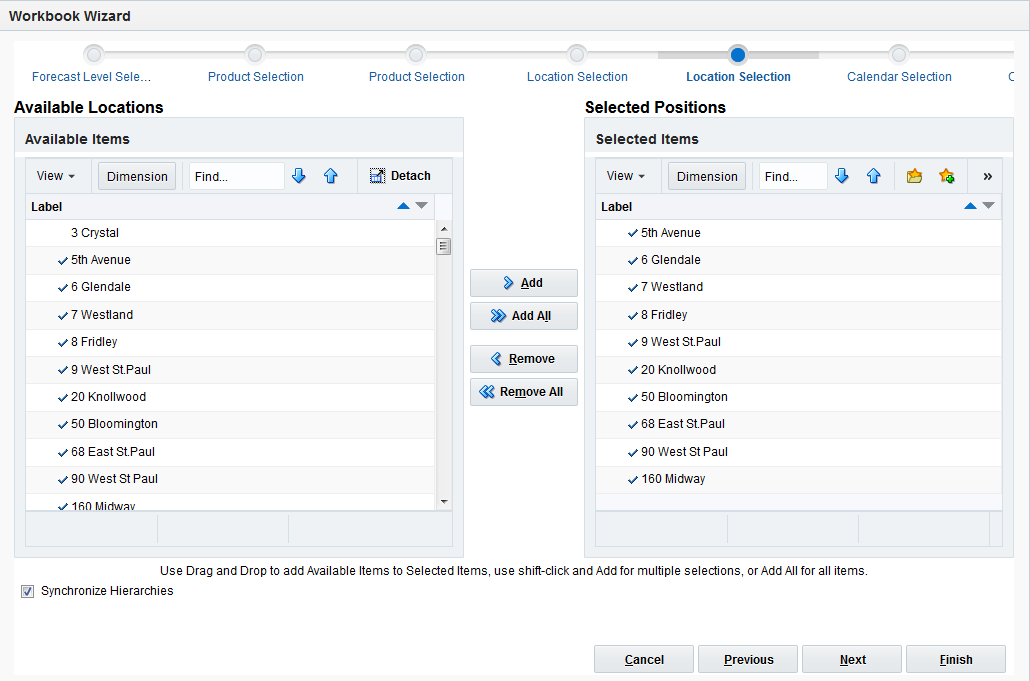
Select the specific locations that you want to view and click Next.
Select the weeks of the forecast you wish to review and click Finish:
The Forecast Scorecard workbook is built.
There are four Error Measure views within the low and aggregate levels:
Forecast Errors - Low Level Views
Approved Forecast Errors - Low Level
Approved System Forecast Errors - Low Level
Forecast Errors - Aggregate Level Views
Approved Forecast Errors - Aggregate Level
Approved System Forecast Errors - Aggregate Level
The intersection of the view, as well as the contents are identical. They are at the same low level product/location intersection, for instance item/store. Multiple views are available to users for the purpose of analysis.
These views display statistical information that reflects the accuracy of the forecast measures selected in the wizard process. You may need to evaluate a variety of such statistics to verify and compare forecast accuracy.
Given the situation, different levels of forecast accuracy can be useful. For example, in a situation with noisy data and no forecast previously available, a 200% error can be considered excellent and useful. In another situation with smooth data, if an old method of forecasting provided forecasts with a 10% error, a new method of forecasting with a 20% error would not be considered useful.
Different levels of forecasting accuracy are obtained at different levels of product aggregation. Item level forecasts with a 200% error can roll up into division-level forecasts with a 10% error. Therefore, the error measures are most useful when comparing different methods of forecasting or when looking at a particular model's accuracy over time. Accurate forecasts should lead to a reduction in inventory holding costs or to an increase in customer service levels; forecast errors should be converted into dollars saved.
|
Note: All error statistics are calculated over periods in the calendar that were selected in the wizard process. |
There are two Forecast Error views at the Low Level:
Approved Forecast Errors - Low Level
Approved System Forecast Errors - Low Level
These views are intended to report on the errors at the final forecast intersection. Ultimately, this is the level where the user wants the accuracy criteria to be met.
The Forecast Errors - Low Level views contain the following measures:
History Data for Forecast Window
The sum of the forecast data source for the selected time periods. For example, during the wizard process when the following calendar periods are selected: week 1, week 3 and week 10 for year 2015. Then the history data measure displays - at the item store level - the sum of the demand for the three selected weeks.
Forecast Measures
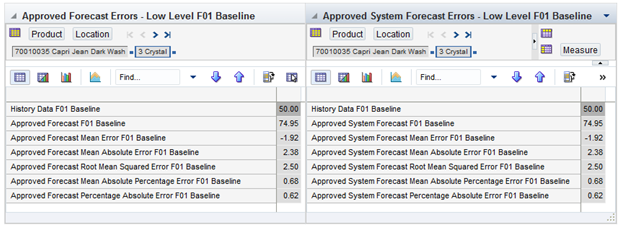
The forecast errors are calculated between the historical demand, and two forecast metrics: the approved forecast and the approved system forecast. The errors between historical demand and each forecast measure are displayed in two views which can be arranged side by side as in Figure 7-7. The error of the approved forecast takes into account adjustments of the forecast user, while the error of the approved system forecast truly reflects the quality of the forecasts generated by the system, without human intervention.
Mean Error
The error of a forecast observation is the difference between the forecast value and the actual POS value. The Mean Error statistic is a measure of the average error over time. This is calculated by summing the errors for all observations, and then dividing by the number of observations to obtain the average. It measures forecast accuracy by calculating the error in units. Because a positive error in one period can cancel out a negative error in another period, this measure is useful when you are interested in how well the forecast predicts over the forecast horizon rather than on a period-to-period basis. Mean error is useful as a measure of forecast bias. A negative mean error suggests that overall the forecasting model overstates the forecast, while a positive mean error indicates forecasts that are generally too low.
Mean Absolute Error
The absolute error of a forecast observation is the absolute value of the difference between the forecast value and the actual POS value. The Mean Absolute Error statistic is a measure of the average absolute error. This is calculated by summing the absolute errors for all observations and then dividing by the number of observations to obtain the average. Mean Absolute Error gives you a better indication of how the forecast performed period by period because the absolute value function ensures that negative errors in one period are not canceled out by positive errors in another. Mean Absolute Error is most useful for comparing two forecast methods for the same series.
Root Mean Squared Error
This is the square root of the Mean Squared Error. The Root Mean Squared Error is one of the most commonly used measures of forecast accuracy because of its similarity to the basic statistical concept of a standard deviation. It evaluates the magnitude of errors in a forecast on a period-by-period basis, and it is best used to compare alternative forecasting models for a given series.
Mean Absolute Percentage Error
The percentage error of a forecast observation is the difference between the actual POS value and the forecast value, divided by the actual POS value. The result of this calculation expresses the forecast error as a percentage of the actual value. The Mean Absolute Percentage Error statistic measures forecast accuracy by taking the average of the sum of the absolute values of the percentage error calculations across all observations. This method is useful when comparing the accuracy of forecasts for different volume products (it normalizes error by volume).
Percentage Absolute Error
The absolute error of a forecast observation is the absolute value of the difference between the forecast value and the actual POS value. The Percentage Absolute Error statistic measures forecast accuracy by calculating the total absolute error as a percentage of the total actual POS. It is calculated by summing the absolute errors for all observations, dividing this value by the absolute value of the sum of all Actuals, and dividing the result by the number of observations in the series. Finally, multiply the total by 100 to obtain a percentage result.
There are two Forecast Error views at the Aggregate Level:
Approved Forecast Errors - Aggregate Level
Approved System Forecast Errors - Aggregate Level
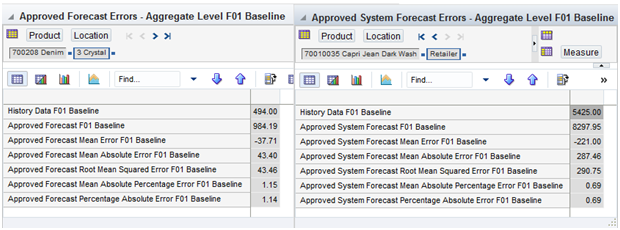
In these views, although the data is still at the low level, it can be rolled up to any intersection, and the error metrics are recalculated. This information can be useful in several scenarios, For example, if you decide that the forecast accuracy at the low level is inadequate, then you can roll up to different intersections, and check at what level, the forecast accuracy starts to deteriorate. Or the rolled-up level can be preset, and you first check the aggregate level accuracy. You can expect that the low level accuracy will be at most on par with the accuracy at the aggregate level.
Figure 7-7 Approved Forecast Errors - Aggregate Level View versus Approved Forecast Errors - Aggregate Level
The Forecast Errors - Aggregate Level views contains the following measures:
History Data for Forecast Window
The sum of the forecast data source for the selected time periods. For example, during the wizard process when the following calendar periods are selected: week 1, week 3 and week 10 for year 2015. Then the history data measure displays - at the item store level - the sum of the demand for the three selected weeks.
Forecast Measures
The forecast errors are calculated between the historical demand, and two forecast metrics: the approved forecast and the approved system forecast. The errors between historical demand and each forecast measure are displayed in two views which can be arranged side by side. The error of the approved forecast takes into account adjustments of the forecast user, while the error of the approved system forecast truly reflects the quality of the forecasts generated by the system, without human intervention.
Mean Error
The error of a forecast observation is the difference between the forecast value and the actual POS value. The Mean Error statistic is a measure of the average error over time. This is calculated by summing the errors for all observations, and then dividing by the number of observations to obtain the average. It measures forecast accuracy by calculating the error in units. Because a positive error in one period can cancel out a negative error in another period, this measure is useful when you are interested in how well the forecast predicts over the forecast horizon rather than on a period-to-period basis. Mean error is useful as a measure of forecast bias. A negative mean error suggests that overall the forecasting model overstates the forecast, while a positive mean error indicates forecasts that are generally too low.
Mean Absolute Error
The absolute error of a forecast observation is the absolute value of the difference between the forecast value and the actual POS value. The Mean Absolute Error statistic is a measure of the average absolute error. This is calculated by summing the absolute errors for all observations and then dividing by the number of observations to obtain the average. Mean Absolute Error gives you a better indication of how the forecast performed period by period because the absolute value function ensures that negative errors in one period are not canceled out by positive errors in another. Mean Absolute Error is most useful for comparing two forecast methods for the same series.
Root Mean Squared Error
This is the square root of the Mean Squared Error. The Root Mean Squared Error is one of the most commonly used measures of forecast accuracy because of its similarity to the basic statistical concept of a standard deviation. It evaluates the magnitude of errors in a forecast on a period-by-period basis, and it is best used to compare alternative forecasting models for a given series.
Mean Absolute Percentage Error
The percentage error of a forecast observation is the difference between the actual POS value and the forecast value, divided by the actual POS value. The result of this calculation expresses the forecast error as a percentage of the actual value. The Mean Absolute Percentage Error statistic measures forecast accuracy by taking the average of the sum of the absolute values of the percentage error calculations across all observations. This method is useful when comparing the accuracy of forecasts for different volume products (it normalizes error by volume).
Percentage Absolute Error
The absolute error of a forecast observation is the absolute value of the difference between the forecast value and the actual POS value. The Percentage Absolute Error statistic measures forecast accuracy by calculating the total absolute error as a percentage of the total actual POS. It is calculated by summing the absolute errors for all observations, dividing this value by the absolute value of the sum of all Actuals, and dividing the result by the number of observations in the series. Finally, multiply the total by 100 to obtain a percentage result.
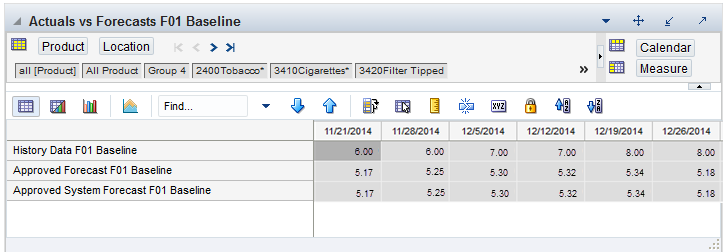
This view displays forecast results and actual demand values for each product, location, and time period specified in the wizard. This view allows you to compare the results of both system-approved forecasts and final approved forecasts to historical demand quantities.
The Actuals versus Forecasts view contains the following measures:
History Data
History Data displays the actual demand quantities for the product, location, and calendar combinations displayed.
Approved Forecast
This is the reviewed/adjusted forecast approved by the user.
Approved System Forecast
This forecast is wholly system generated.