Skip navigation.

User's Guide

  Previous Next vertical dots separating previous/next from contents/index/pdf Contents View as PDF  
Get
Adobe Reader

SLEE and SLEE Service Operation

The following sections describe SLEE and SLEE service operation:


About the SLEE and SLEE services

SLEE

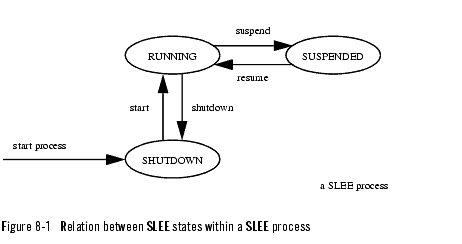
BEA WebLogic Network Gatekeeper is built with a modular software architecture where most functions run as services in a Service Logic Execution Environment (SLEE). When a SLEE process is started, the SLEE is put in the state SHUTDOWN, see Figure 8-1.


Before the SLEE can start executing services, its state has to be changed to RUNNING. That is, to its normal executing state. When changing the state from SHUTDOWN to RUNNING, all autostarted services installed in the SLEE will be automatically started and activated.

If the SLEE state is changed from RUNNING to SHUTDOWN, all services executing in the SLEE will be stopped.

The state SUSPENDED is used when you temporarily want to stop all request sent to and from the SLEE without stopping the started or activated SLEE services.

SLEE services

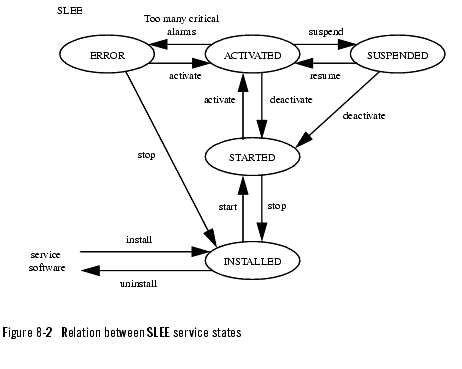
All software modules installed and run in the SLEE are regarded as SLEE services. An installed SLEE service can have one of the following states (see also Figure 8-2):

In case of a SLEE restart, the services' restart order and previous operating states are retrieved from the database.


Starting a SLEE process and a SLEE agent (command window)

Follow the instruction below to start a SLEE and SLEE agent process.

  1. Log in as root on the BEA WebLogic Network Gatekeeper server.
  2. Open a command window.
  3. Go to the /usr/local/slee/bin/ directory.
  4. Start the SLEE agent. Enter command:
  5. ./runAgent.sh&

    The SLEE agent will automatically start the SLEE process.

    In the command prompt window you can see how the SLEE agent and the SLEE processes are starting up.

    Note: Do not close the command prompt window. If you do so, the SLEE process will be terminated.


Starting a SLEE process (Network Gatekeeper Management Tool)

Follow the instruction below to start a SLEE process. To start a SLEE process through an Network Gatekeeper Management Tool, the SLEE agent process related to the SLEE must be running. That is, this instruction can only be used to start a SLEE process that has been temporary stopped through an Network Gatekeeper Management Tool as described in Stopping a SLEE process (Network Gatekeeper Management Tool).

  1. Start an Network Gatekeeper Management Tool and log in.
  2. Select the SLEE to work with.
  3. Right-click on the selected SLEE.
  4. This displays a menu where you can start and stop the SLEE process and change the SLEE's state.

  5. Click Start SLEE Process in the menu.
  6. The icon in front of the SLEE name in the SLEE pane is changed to .

  7. Change the SLEE state to the desired state, see Changing SLEE state.


Stopping a SLEE agent (command window)

Follow the instruction below to stop the SLEE agent, and related, processes.

Note: This instruction should only be used when stopping a SLEE process completely, for instance when performing a system upgrade. The SLEE needs to be in state SHUTDOWN to perform this operation.
To start the SLEE again, follow the instructions in Starting a SLEE process and a SLEE agent (command window).

  1. Log in as root on the BEA WebLogic Network Gatekeeper server.
  2. Open a command window.
  3. Change directory to:
  4. <installation directory>/bin

  5. Stop the processes. Enter:
  6. stopAgent.sh <username> <password>

    Replace <username> with a SLEE username with administrative privileges. Replace <password> with the password.


Stopping a SLEE process (Network Gatekeeper Management Tool)

Follow the instruction below to stop a SLEE process.

Note: This instruction should only be used when stopping a SLEE process temporarily. If the SLEE process shall be stopped for a system upgrade, the SLEE and SLEE agent processes must be stopped, see Stopping a SLEE agent (command window).

  1. Start an Network Gatekeeper Management Tool and log in.
  2. Select the SLEE to work with.
  3. Right-click on the selected SLEE.
  4. This displays a menu where you can start and stop the SLEE process and change the SLEE's state.

  5. Click StopSLEE Process in the menu.
  6. The icon in front of the SLEE name in the SLEE pane is changed to .


Viewing SLEE name

Follow the instruction below to view a SLEE's name as specified in the file slee_properties.xml at installation.

  1. Start an Network Gatekeeper Management Tool and log in.
  2. Select the SLEE to view name for.
  3. Double-click the SLEE service.
  4. Double-click the getName method.
  5. Click Invoke.
  6. The SLEE's name is displayed.


Viewing SLEE state

Follow the instruction below to view a SLEE's state. For more information about the SLEE states, see About the SLEE and SLEE services.

  1. Start an Network Gatekeeper Management Tool and log in.
  2. Select the SLEE to view state for.
  3. Double-click the SLEE service.
  4. Double-click the getSLEEState method.
  5. Click Invoke.
  6. The SLEE's state is displayed.


Changing SLEE state

Follow the instruction below to change a SLEE's state. For more information about the SLEE states, see About the SLEE and SLEE services.

  1. Start an Network Gatekeeper Management Tool and log in.
  2. Select the SLEE to change state for.
  3. Double-click the SLEE service.
  4. View current state

  5. Double-click the getSLEEState method.
  6. Click Invoke.
  7. The SLEE's current state is displayed.

    Set new state

  8. Double-click a method according to the table below:

    To change from state:

    To state:

    Use the following method:

    SHUTDOWN

    RUNNING

    start

    RUNNING

    SHUTDOWN

    shutdown

    RUNNING

    SUSPENDED

    suspendAccess

    SUSPENDED

    RUNNING

    resumeAccess

  9. Click Invoke.
  10. The new SLEE state is displayed.


Viewing memory and disk space utilization

Follow the instruction below to view a SLEE's resource utilization.

  1. Start an Network Gatekeeper Management Tool and log in.
  2. Select the SLEE to view resource utilization for.
  3. Double-click the SLEE service.
  4. Double-click a method according to the table below:

    To view:

    Use the following method:

    The amount of free RAM (Mb) in the Java virtual machine the SLEE can use

    getFreeMemory

    The total amount of RAM (Mb) in the Java virtual machine where the SLEE executes

    getTotalMemory

    The available disk space (Kb) on a specific partition on the SLEE host

    getFreeDiskSpace

    Use the path parameter to specify the partition

  5. Click Invoke.
  6. The selected resource utilization data is displayed.


Viewing SLEE load and resource utilization

Follow the instruction below to view the SLEE load. It is possible to view:

These load values are presented as a percentage of the maximum load.

In addition, it is possible to view a more detailed resource utilization data for the whole SLEE, the JVM and the defined load share contexts. This data includes:

  1. Start an Network Gatekeeper Management Tool and log in.
  2. Select the SLEE to view load for.
  3. Double-click the SLEE service.
  4. Double-click a method according to the table below:

    To view:

    Use the following method:

    The current load.

    getLoad

    Average load.

    getAverageLoad

    The time format is specified according to the system time settings. Default format is: YYYY-MM-DD hh:mm

    If endTime is left empty, the average for an hour beginning at startTime is displayed.

    Load history

    listLoadAverages

    The time format is specified according to the system time settings. Default format is: YYYY-MM-DD hh:mm

    If endTime is left empty, the average for an hour beginning at startTime is displayed.

    Detailed SLEE load

    getLoadParameters

  5. Click Invoke.
  6. The load is displayed.


Deleting SLEE load data

Follow the instruction below to delete SLEE load data from the database. The procedure has to be performed once for each SLEE.

  1. Start an Network Gatekeeper Management Tool and log in.
  2. Select the SLEE to delete load for.
  3. Double-click the SLEE service.
  4. Double-click the deleteLoadAverages method.
  5. Enter end date.
  6. All the load data older then the entered date will be deleted. The time format is specified according to the system time settings. Default format is:
    YYYY-MM-DD hh:mm

  7. Click Invoke.
  8. The load data is deleted.


Listing resource sharing contexts

Follow the instruction below to list the existing resource sharing contexts in a SLEE.

  1. Start an Network Gatekeeper Management Tool and log in.
  2. Select the SLEE to list resource sharing contexts for.
  3. Double-click the SLEE service.
  4. Double-click the listResourceShares method.
  5. Click Invoke.
  6. The existing resource sharing contexts are displayed.


Viewing resource utilization for a resource sharing context

Follow the instruction below to view the resource utilization for a resource sharing contexts.

  1. Start an Network Gatekeeper Management Tool and log in.
  2. Select the SLEE to list resource sharing contexts for.
  3. Double-click the SLEE service.
  4. List existing resource sharing contexts

  5. Double-click the listResourceShares method.
  6. Click Invoke.
  7. The existing resource sharing context names are displayed.

    View resource utilization

  8. Double-click a method according to the table below:

    To view:

    Use the following method:

    The SLEE task pool size.

    getResourceShareTaskPoolSize

    The number of active SLEE tasks.

    getResourceShareNoActiveTasks

    The active SLEE tasks.

    listResourceShareActiveTasks

    The SLEE task queue size.

    getResourceShareTaskQueueSize

    The number of SLEE tasks in the queue

    getResourceShareTasksInQueue

    If the SLEE task queue is stable.

    isResourceShareTaskQueueStable

    The number of active SLEE tasks.

    listNumberOfResourceShareTaskQueueSize

    The ORB thread pool size.

    getResourceShareOrbPoolSize

    The number of ORB threads used.

    getResourceShareNoCORBARequests

  9. Enter the desired resource sharing context name.
  10. Click Invoke.
  11. The selected resource utilization data is displayed.


Listing SLEE services in a resource sharing context

Follow the instruction below to list SLEE service in a specific resource sharing contexts. Two types of listings are possible:

The difference between the two is that a SLEE service has to be started (or restarted) after it has been configured to belong to a resource sharing context to be an active part of, that is, running in the resource sharing context.

  1. Start an Network Gatekeeper Management Tool and log in.
  2. Select the SLEE where the resource sharing contexts are defined.
  3. Double-click the SLEE service.
  4. List existing resource sharing contexts

  5. Double-click the listResourceShares method.
  6. Click Invoke.
  7. The existing resource sharing context names are displayed.

    List SLEE services

  8. Double-click a method according to the table below:

    To view:

    Use the following method:

    All configured SLEE service.

    listResourceShareServices

    The running SLEE service.

    listResourceShareRunningServices

  9. Enter the resource sharing context name.
  10. Click Invoke.
  11. The services within the specified resource sharing contexts are displayed.


Viewing resource sharing context for a SLEE service

Follow the instruction below to view which resource sharing context a SLEE service belongs to.

  1. Start an Network Gatekeeper Management Tool and log in.
  2. Select the SLEE where the service is installed.
  3. Double-click the SLEE service.
  4. Double-click the getServiceResourceShare method.
  5. Enter the SLEE service name.
  6. Click Invoke.
  7. The resource sharing context the SLEE service belongs to is displayed.


Listing installed SLEE services

Follow the instruction below to list the SLEE services installed in a SLEE. The services can be listed on a per state basis or regardless of state.

  1. Start an Network Gatekeeper Management Tool and log in.
  2. Select the SLEE to list services for.
  3. Double-click the SLEE service.
  4. Double-click the getServices method.
  5. Enter a digit according to the table below:

    To list:

    Enter the following digit:

    All services in state UNINSTALLED

    -1

    All services in state INSTALLED

    0

    All services in state STARTED

    1

    All services in state ACTIVE

    2

    All services in state UNKNOWN

    3

    All services in state SUSPENDED

    4

    All services in state ERROR

    5

  6. Note: You list services in a certain state. That is, a service in the state STARTED is not displayed when listing services in the state INSTALLED, even if a started service is, of course, installed in the SLEE.

  7. Click Invoke.
  8. The names of the SLEE services fulfilling the criteria specified in the previous step are displayed.


Viewing SLEE service state

Follow the instruction below to view a specific SLEE service's state. For more information about the SLEE service states, see About the SLEE and SLEE services.

  1. Start an Network Gatekeeper Management Tool and log in.
  2. Select the SLEE where the desired service is installed.
  3. Double-click the SLEE service.
  4. Double-click the getServiceState method.
  5. Enter the service name.
  6. For service names, see Listing installed SLEE services.

  7. Click Invoke.
  8. The service state is now displayed.


Changing SLEE service state

Follow the instruction below to change a specific SLEE service's state. For more information about the SLEE service states, see About the SLEE and SLEE services.

  1. Start an Network Gatekeeper Management Tool and log in.
  2. Select the SLEE where the desired service is installed.
  3. View current state

  4. Double-click the SLEE service.
  5. Double-click the getServiceState method.
  6. Enter the service name.
  7. For service names, see Listing installed SLEE services.

  8. Click Invoke.
  9. The service state is now displayed.

    Set new state

  10. Double-click the SLEE_deployment service.
  11. Select one of the following methods to change the service state.

    Current state:

    Desired state:

    Use the following method:

    INSTALLED

    STARTED

    start

    STARTED

    INSTALLED

    stop

    STARTED

    ACTIVATED

    activate

    ACTIVATED

    STARTED

    deactivate

    ACTIVATED

    SUSPENDED

    suspend

    SUSPENDED

    STARTED

    deactivate

    SUSPENDED

    ACTIVATED

    resume

  12. Note: Before going from SUSPENDED to STARTED using the deactivate method, the method getServiceActivity can be used to verify that the activity on the suspended service has ceased.

  13. Enter the service name.
  14. Click Invoke.
  15. The new service state is now displayed.


Viewing SLEE service version

Follow the instruction below to view a specific SLEE service's version.

  1. Start an Network Gatekeeper Management Tool and log in.
  2. Select the SLEE where the desired service is installed.
  3. Double-click the SLEE service.
  4. Double-click the getServiceVersion method.
  5. Enter the service name.
  6. For service names, see Listing installed SLEE services.

  7. Click Invoke.
  8. The service version is displayed.


About trace

If a SLEE service is suspected to be faulty, the trace service can be used to locate the fault in the code.

The trace information is written to file. There can be several trace files stored for one SLEE service. If the trace is currently active for the SLEE service, the active trace file is named <service_name>.log where <service_name> is the name of the SLEE service. When a trace file has reached its maximum size the file is given a time stamp telling when it was closed for writing. Closed trace files have the following format <service_name>_YYYY-MM-DD_hh-mm-ss.log.

The different types of trace information (trace groups) that it is possible to trace on are explained in Table 8-1 below.

Table 8-1

Trace Group

Value

Description

METHOD IN

1

Writes trace information at entry of a method.

METHOD OUT

2

Writes trace information at exit of a method.

USER DEF 1

4

Writes trace information of type 1 as defined for the service.

USER DEF 2

8

Writes trace information of type 2 as defined for the service.

USER DEF 3

16

Writes trace information of type 3 as defined for the service.

USER DEF 4

32

Writes trace information of type 4 as defined for the service.

USER DEF 5

64

Writes trace information of type 5 as defined for the service.

USER DEF 6

128

Writes trace information of type 6 as defined for the service.

RAW DATA

256

Writes trace information in the form of a byte array as defined for the service.

EXCEPTIONS

512

Writes trace information at exceptions.

TRAFFIC FLOW

1024

Writes trace information when traffic related requests (both application and network initiated) are received by and sent from the service.

Trace Groups

The usage of the USER DEF trace groups is different in different SLEE services.

The trace for a SLEE service is specified using the setTraceFilterGroupsForService method. The number to enter is the sum of the values representing the trace groups you want to use, see Table 8-1 on page 18. For example, if you want to use METHOD OUT (2), USER DEF 4 (32), and RAW DATA (256) you have to enter the number 290 (2+32+256=290).

Note: For performance reasons is it recommended to activate trace only for individual services and not for all services in the SLEE. Setting trace filter groups for a service to 0 does not deactivate trace for that service. Use the methods activateTraceForService and deactivateTraceForService to activate and deactivate trace for individual services. See instructions below.


Enabling trace for a SLEE

Follow the instruction below to enable trace for a SLEE. That is, make it possible for the SLEE services to write trace information to the trace file. Only SLEE services that have the trace activated will generate trace information.

  1. Start an Network Gatekeeper Management Tool and log in.
  2. Select the SLEE you want to enable trace for.
  3. Double-click the SLEE_trace service.
  4. Double-click the enableTracing method.
  5. Click Invoke.
  6. Trace is enabled for the SLEE.


Specifying type of trace for a SLEE service

Follow the instruction to specify which type of trace information that shall be written to the trace file.

  1. Start an Network Gatekeeper Management Tool and log in.
  2. Select the SLEE where the desired service is installed.
  3. Double-click the SLEE service.
  4. Double-click the setTraceFilterGroupsForService method.
  5. Enter the service name and the number representing the desired trace groups.
  6. For service names, see Listing installed SLEE services and for trace groups and how to calculate the number representing the desired trace groups, see About trace.

  7. Click Invoke.
  8. The type of trace information to be written to the trace file is specified. Note that trace have to be activated for the service before any trace information is actually written to the trace file.


Activating trace a SLEE service

Follow the instruction below to activate trace for a single SLEE service. That is, all SLEE service will generate trace information. If trace is enabled for the SLEE, this information will also be written to file.

  1. Start an Network Gatekeeper Management Tool and log in.
  2. Select the SLEE where the desired service is installed.
  3. Double-click the SLEE service.
  4. Double-click the activateTraceForService method.
  5. Enter the service name.
  6. For service names, see Listing installed SLEE services.

  7. Click Invoke.
  8. Trace is activated for the specified SLEE service.


Activating trace for all services in SLEE

Follow the instruction below to activate trace for all services in a SLEE. That is, all SLEE services will generate trace information. If trace is enabled for the SLEE, this information will also be written to file.

  1. Start an Network Gatekeeper Management Tool and log in.
  2. Select the SLEE you want to activate trace for.
  3. Double-click the SLEE service.
  4. Double-click the activateTraceForAllService method.
  5. Click Invoke.
  6. Trace is activated for all services in the SLEE.


Deactivating trace for a SLEE service

Follow the instruction below to deactivate trace for a single SLEE service. That is, the SLEE service will stop generating trace information.

  1. Start an Network Gatekeeper Management Tool and log in.
  2. Select the SLEE where the desired service is installed.
  3. Double-click the SLEE service.
  4. Double-click the deactivateTraceForService method.
  5. Enter the service name.
  6. For service names, see Listing installed SLEE services.

  7. Click Invoke.
  8. Trace is deactivated for all services in the SLEE.


Deactivating trace for all services in SLEE

Follow the instruction below to deactivate trace for all services in a SLEE. That is, all SLEE service in the SLEE will stop generating trace information.

  1. Start an Network Gatekeeper Management Tool and log in.
  2. Select the SLEE you want to deactivate trace for.
  3. Double-click the SLEE service.
  4. Double-click the deactivateTraceForAllService method.
  5. Click Invoke.
  6. Trace is deactivated for all services in the SLEE.


Disabling trace for a SLEE

Follow the instruction below to disable trace for a SLEE. That is, SLEE services will not be able to write trace information to file.

  1. Start an Network Gatekeeper Management Tool and log in.
  2. Select the SLEE you want to disable trace for.
  3. Double-click the SLEE_trace service.
  4. Double-click the disableTracing method.
  5. Click Invoke.
  6. Trace is disabled for the SLEE.


Upgrading a SLEE service

How to upgrade a SLEE service is dependant on the service and service version you upgrade to. Specific upgrading instructions are provided with new service versions.
 

Skip navigation bar  Back to Top Previous Next