

|

|
|
|
|
Getting Started
The following topics are provided about using WebLogic Integration - Business Connect applications.
Procedures
Starting Administrator or Tracker
Use this procedure to start the Administrator or Tracker application.
In a client-server configuration, start the Server application before you log on to Administrator or Tracker.
On some UNIX operating systems, occasional X windows scroll bar exceptions might occur in the normal use of the Administrator and Tracker X windows clients. These exceptions display in the terminal window where the clients were launched and are of no consequence. For example:
 Warning:
  Name: HorScrollBar
  Class: XmScrollBar
  The specified scrollbar value is greater than the maximum
  scrollbar value minus the scrollbar slider size.
Steps
On the Windows Start menu, select Programs
On UNIX, ensure you have X Windows connectivity to the system where WebLogic Integration - Business Connect is installed. Log in to the account you created during the installation process. Run the following command:
installation_directory/bin/admin
Starting the Server Application
The Server application must be running before you can exchange documents with your partners. Although you can start and stop Server at any time, we recommend you run the application continuously.
It is highly recommended that you have only one instance of WebLogic Integration - Business Connect on a computer. You should not have two or more instances installed at the same time on the same computer. The only exception is when you temporarily have two instances installed while upgrading the application. But even in that case, you should not run two applications at the same time on the same computer.
The Server application synchronizes with your system's time for time-stamping transactions. If you change the system time on the system where the Server application is running, you must re-start the Server application for the Server to recognize the change.
If you are already running WebLogic Integration - Business Connect Server as a Windows service, you should not start it from your desktop.
On UNIX computers you can set up the Server application as a system service. See "Initialization and Termination Scripts for UNIX" in "Installing on UNIX" in Using WebLogic Integration - Business Connect.
The following topics are provided:
Starting the Server on Windows
To start the Server application on Windows, select Start
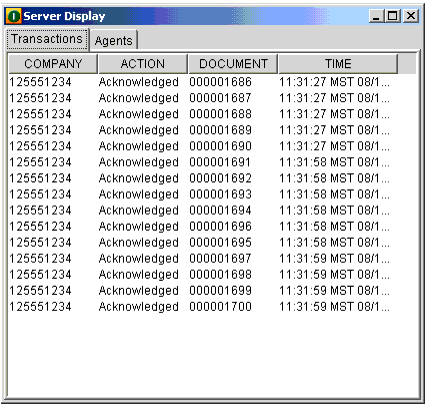
On the Agents tab, the displays for outbound and inbound polling show three numbers following each active transport or document type. These are, in order, the document polling rate in seconds, the documents per cycle and the maximum threads. The polling rate is the interval when WebLogic Integration - Business Connect polls for inbound or outbound documents. The documents per cycle is the maximum number of documents the application can retrieve at each polling interval. The maximum threads are packaging threads for outbound documents and unpackaging threads for inbound documents.
Now you can:
Figure 6-1 \Server Display Window Transactions Tab
Figure 6-2 Server Display Window Agents Tab
Starting the Server on UNIX
To start the Server application on UNIX, ensure you have X Windows connectivity to the system where WebLogic Integration - Business Connect is installed. Log in to the account you created during the installation process. Run the following command:
installation_directory/bin/start_server
In Administrator or Tracker, select Tools
Monitoring the Server Application
The following topics are provided for monitoring activity on the Server application.
Viewing the server.log File in Windows and UNIX
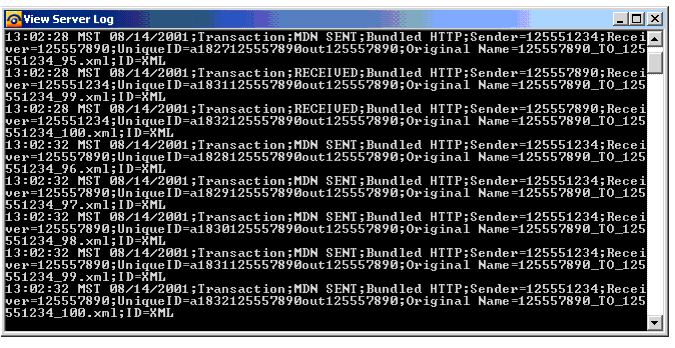
You can use the View Server Log utility to view real-time activity on the Server application. The activity you view is recorded in the server.log file in the logs subdirectory under the directory where WebLogic Integration - Business Connect is installed. You can use the View Server Log utility only on the computer where you have installed the Server application. All Server actions display as they occur.
Note: If the View Server Log window is open when archiving occurs, the file you are viewing is archived and no further Server activity displays. When this occurs, the following line appears at the bottom of the window: Archiving console logs [date and time]. Open a new View Server Log window to continue monitoring activity.
Windows
On the Windows Start menu select Programs
Figure 6-3 View Server Log Window
UNIX On UNIX, log in to the account you created during the installation process. Run the following command: tail -f installation_directory/logs/server.log Viewing Processes on UNIX To view a snapshot of all WebLogic Integration - Business Connect components, you can use the processes command. The output of this command identifies each WebLogic Integration - Business Connect process that is running. This can be helpful in troubleshooting the application. Run the following command: installation_directory/bin/processes For definitions of the column headings displayed with the processes command, use the man ps command. Monitoring the Server with a Browser Use this procedure to view Server application activity on a web page. You access the page with a browser such as Internet Explorer or Netscape Navigator that is on the same computer as WebLogic Integration - Business Connect Server or on a client computer with access to the Server. The Server application must be running for activity to display on the web page. The web page by default refreshes once a minute, but you can change the refresh rate. The web page provides summary-level information not available in Tracker, such as totals for documents packaged, sent and received. It also shows whether server agents are active or idle and reports recent activity for transactions and alerts. The information on the web page is for the current session of the Server application. If you stop and restart Server, the page display resets. You also can use the reset button to restart the counters in the summary section without restarting the application. Steps
Alternately, to access the web page outside of Administrator or Tracker, open a browser and type a URL in the following format:
http://server_name:port_number/status/summary.html
Substitute the name of the computer running the Server application for server_name. The default port_number is 4080. If the computer name or port number has been changed, select Tools
Press Enter to display the web page.
Figure 6-4 Partial View of the Server Monitor Web Page
Description of Web Page
The follow list describes the information on the server monitor web page. To access the page, see Steps.
Closing Applications
You can close and restart Administrator, Tracker and the Server application independently of each other.
You can close the Server application only on the computer where you have installed it and not from a client computer.
The following topics are provided.
Closing the Server on Windows
To close the Server application on Windows, do one of the following:
Closing the Server on UNIX
To close the Server application on UNIX, log in to the account you created during the installation process. Run the following command:
installation_directory/bin/stop_server
If shutdown is successful, the following messages are displayed:
$ bin/stop_server
starting shutdown process ...
found local registry
found server
shutting server down ...

Server successfully shutdown.
Stopping All Processes on UNIX
Unlike the stop_server command, which only closes the Server application, the kill_app command on UNIX shuts down all WebLogic Integration - Business Connect processes. These include the Server, Administrator and Tracker applications. You might want to use this command only after trying other steps to resolve issues such as not being able to close or open Administrator or Tracker or having multiple Java processes running.
To use the kill_app command, log in to the account you created during the installation process and run the following command:
installation_directory/bin/kill_app
Closing Administrator or Tracker
Select File
Printing Administrator Records
You can print a list of the records in the currently active information viewer by selecting File
The application prints the data as displayed on the current information viewer, so maximizing the window size before you print yields longer horizontal printed records. Although the records print in landscape format, you might have to adjust the column widths in the information viewers to print the columns of data you want. This is necessary to account for differences in fonts and printers.
You can adjust column widths by placing the cursor over the lines between the columns to make a double-arrow appear. Click and hold the left button to adjust the column widths. You also can click and drag columns to change their locations.

|

|

|
|
|
|
Copyright © 2002 BEA Systems, Inc. All rights reserved.
|