

|
|
|
|
| |
Using Log Messages to Manage WebLogic Servers
This section includes the following topics:
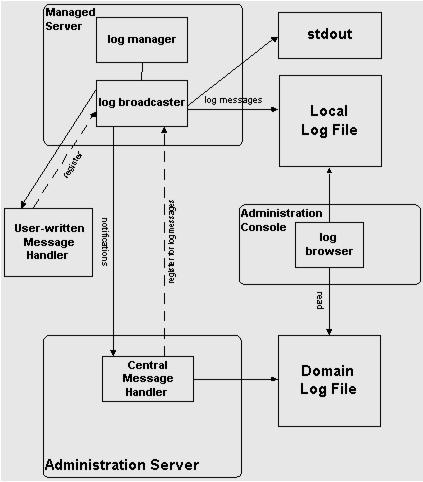
Log messages are a useful tool for managing systems. They allow you to detect problems, track down the source of a fault, and track system performance. Log messages generated by the WebLogic Server software are stored in two locations:
Java Management Extension (JMX) facilities, embedded in the WebLogic Server, are used to transmit log messages from WebLogic Servers to the Administration Server. A message forwarded to other entities on the initiative of a local WebLogic Server is called a notification in JMX terminology.
When a WebLogic server starts, the Administration Server's message handler registers with that server to receive log messages. At the time of registration, a user-modifiable filter is provided that is used by the local server to select the messages to be forwarded to the Administration Server. These messages are collected in the domain log.
By default, only the most important log messages (as determined by Message Severity) are forwarded from the local servers to the domain log. The domain log gives you an overall view of the entire domain while focusing on just the most critical messages.
If you want to modify the filter, to receive a different subset of logged messages from a local server, you can do so dynamically, using the Administration Console. You do not need to restart the local server for your changes to take effect. (See Creating Domain Log Filters.)
Developers can also build custom message handlers that can register with a WebLogic Server to receive log messages via JMX notifications.
Figure 5-1 WebLogic Server Logging Subsystem
In previous versions of WebLogic Server, a new log file is created once the log file reaches a maximum log file size. This type of automatic log file creation is called log rotation. In the current release, you have the option of basing log file rotation either on size or on time. To configure rotation, open the Administration Console and do the following:
![]() Logging.
Logging.
If the value in this field is none, no log rotation occurs. If you base log file rotation on time, a new log file is created once the specified time interval (File Time Span) has elapsed.
By default, the local server log file is called servername.log (where servername is the name of the server) and is created in the directory where you started the WebLogic Server. You can set the file name also on the Configuration![]() Logging page for the server.
Logging page for the server.
You can specify the maximum number of rotated files that can accummulate by setting an appropriate value for the File Count field. Once the number of log files reaches this number, the oldest log file is deleted each time a log file rotation occurs. The rotated log files are numbered in order of creation filenamennnnn, where filename is the name configured for the log file. For example: weblogic.log00007.
The local server log always has all the messages that have been logged.
Configuring logging by the local server also includes the ability to specify which messages are logged to stdout. You can exclude messages of lower severity by specifying the lowest severity to be logged. You can also enable or disable logging of debug messages to stdout.
Startup Log
When a WebLogic Server is starting, if any errors occur before initialization is complete, these errors are logged to stdout and to a local server startup log file called weblogic-startup.log. If startup is successful, the last message in this log points to the location of the local server log file where normal logging occurs.
Client Logging
Java clients that use the WebLogic logging facility may also generate log messages. However, messages logged by clients are not forwarded to the domain log. You configure logging properties of a client by entering the appropriate argument on the command line:
-Dweblogic.log.attribute=value
where attribute is any LogMBean attribute. By default, logging to a log file is turned off for clients and messages are logged to stdout. You can turn on logging to a file and set the file name by using the following argument on the command line:
-Dweblogic.log.FileName=logfilename
where logfilename is the name of the log file.
The following command line arguments can also be used for client logging:
-Dweblogic.StdoutEnabled=boolean
-Dweblogic.StdoutDebugEnabled=boolean
-Dweblogic.StdoutSeverityLevel = [64 | 32 | 16 | 8 | 4 | 2 | 1 ]
where boolean is either true or false and the numeric values for StdoutSeverityLevel correspond to the following severity levels:
INFO(64) WARNING(32), ERROR(16), NOTICE(8), CRITICAL(4), ALERT(2) and EMERGENCY(1).
Log File Format
The first line of each message in a log file begins with #### followed by the message header. The message header provides the run-time context of the message. Each attribute of the message is contained between angle brackets.
Lines following the message body are only present for messages logging an exception and display the stack trace for the exception. If a message is not logged within the context of a transaction, the angle brackets (separators) for Transaction ID are present even though no Transaction ID is present.
The following is an example of a log message:
####<Jun 2, 2000 10:23:02 AM PDT> <Info> <SSL> <bigbox> <myServer>
    <SSLListenThread> <harry> <> <004500> <Using exportable strength SSL>
In this example, the message attributes are: Timestamp, Severity, Subsystem, Machine Name, Server Name, Thread ID, User ID, Transaction ID, Message ID, and Message Text.
Note: Log messages logged by clients do not have the attributes Server Name or Thread ID.
Note: The character encoding used in writing the log files is the default character encoding of the host system.
Each log message saved in a server log file the attributes listed in the following table may be defined. The Message Id may also associate the message with additional attributes (such as Probable Cause and Recommended Action) contained in the Message Catalog.
|
Attribute |
Description |
|---|---|
|
Timestamp |
The time and date when the message originated, in a format that is specific to the locale. |
|
Severity |
Indicates the degree of impact or seriousness of the event reported by the message. See Message Severity. |
|
Subsystem |
This attribute denotes the particular subsystem of WebLogic Server that was the source of the message. For example, EJB, RMI, JMS. |
|
Server Name |
These four attributes identify the origins of the message. Transaction ID is present only for messages logged within the context of a transaction. Note: Server Name and Thread ID are not present in log messages generated by a Java client and logged to a client log. |
|
User ID |
The user from the security context when the message was generated. |
|
Message ID |
A unique six-digit identifier. Message IDs through 499999 are reserved for WebLogic Server system messages. |
|
Message Text |
For WebLogic Server messages, this contains the Short Description as defined in the system message catalog. (See Message Catalog.) For other messages, this is text defined by the developer of the program. |
In addition to the information contained in a log message, messages generated by WebLogic Server system components (or possibly by user-written code) include additional pre-defined or canned information that is stored in a message catalog. The additional attributes stored in the message catalog are described below.
You can access these additional message attributes from log views in the Administration Console.
WebLogic Server log messages have an attribute called severity which reflects the importance or potential impact on users of the event or condition reported in the message.
Defined severities are described below. Severities are listed in order of severity with Emergency being the highest severity.
Messages with a severity of debug are a special case. Debug messages are not forwarded to the domain log. Debug messages may contain detailed information about an application or the server. These messages should only occur when the application is running in debug mode.
The log browsing capabilities of the Administration Console allow you to do the following:
When viewing either the domain log or the local server log, you can:
You can access both the domain log and the local server log files from the Administration Console. How to do these tasks is discussed in the Console online help:
The log messages forwarded by WebLogic Servers to the domain log are, by default, a subset of messages logged locally. You can configure a log filter that selects log messages for forwarding based on message severity, subsystem, or user ID. (Debug messages are a special case and are not forwarded to the domain log.) You can create or modify domain log filters from the domain log filters table. The domain log filters table is accessible from the domain monitoring tab page. See the Administration Console online help for more information on creating domain log filers.
|
|
|
Copyright © 2000 BEA Systems, Inc. All rights reserved.
|