

|
|
|
|
| |
Monitoring a WebLogic Domain
This section explains how to monitor your WebLogic domain, including:
The tool for monitoring the health and performance of your WebLogic domain is the Administration Console. The Administration Console allows you to view status and statistics for WebLogic resources such as servers, HTTP, the JTA subsystem, JNDI, security, CORBA connection pools, EJB, JDBC, and JMS.
Monitoring information is presented in the right pane of the Administration Console. You access a page by selecting a container or subsystem, or a particular entity under a container, on the hierarchical domain tree, in the left pane.
The Administration Console provides three types of page that contain monitoring information:
The Administration Console obtains information about domain resources from the Administration Server. The Administration Server, in turn, is populated with Management Beans (MBeans), based on Sun's Java Management Extension (JMX) standard, which provides the scheme for management access to domain resources.
The Administration Server contains both configuration MBeans, which control the domain's configuration, and run-time MBeans. Run-time MBeans provide a snapshot of information about domain resources, such as JVM memory usage or the status of WebLogic Servers. When a particular resource in the domain (such as a Web application) is instantiated, an MBean instance is created which collects information about that particular resource.
When you access a monitoring page for particular resources in the Administration Console, the Administration Server performs a GET operation to retrieve the current attribute values.
The following sections describe some of the monitoring pages that are useful for managing a WebLogic domain. These pages have been selected simply to illustrate the facilities provided by the Administration Console.
The servers table and the monitoring tab pages for individual servers enable you to monitor WebLogic Servers. The servers table provides a summary of the status of all servers in your domain. If only a small subset of the log messages from the server are forwarded to the domain log, accessing the local server log may be useful for troubleshooting or researching events.
For more information about the log files and the logging subsystem, see Using Log Messages to Manage WebLogic Servers.
You can access monitoring data for each WebLogic server from the monitoring tabs for that server. The Logging tab provides access to the local log for the server (that is, the log on the machine where the server is running).
The Monitoring![]() General tab page indicates the current status and provides access to the JNDI tree, the Execute Queues table, the Active Sockets table, and the Connections table. The Execute Queues table provides performance information such as the oldest pending request and the number of requests currently pending.
General tab page indicates the current status and provides access to the JNDI tree, the Execute Queues table, the Active Sockets table, and the Connections table. The Execute Queues table provides performance information such as the oldest pending request and the number of requests currently pending.
Shutting down or Suspending a Server
The Monitoring![]() General tab also enables you to shut down or suspend a server. If a server is suspended, it accepts requests only from the Administration Server. Client requests are ignored.
General tab also enables you to shut down or suspend a server. If a server is suspended, it accepts requests only from the Administration Server. Client requests are ignored.
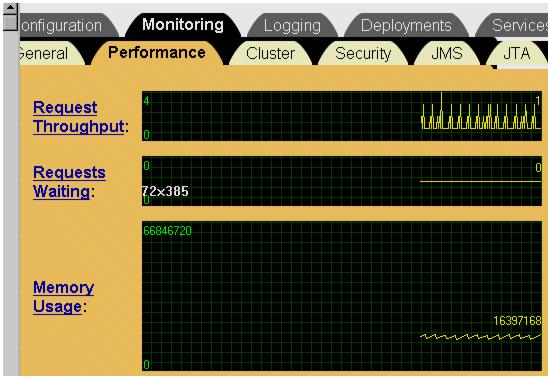
The Monitoring![]() Performance tab graphs real-time data on JVM memory heap usage, request throughput, and waiting requests. This tab page also enables you to force the JVM to perform garbage collection on the memory heap.
Performance tab graphs real-time data on JVM memory heap usage, request throughput, and waiting requests. This tab page also enables you to force the JVM to perform garbage collection on the memory heap.
Figure 4-1 Service Performance Graphs
The Java heap is a repository for Java objects (live and dead). Normally you do not need to perform garbage collection manually because the JVM does this automatically. When the JVM begins to run out of memory, it halts all execution and uses a garbage collection algorithm to free up space no longer used by Java applications.
On the other hand, developers debugging applications may have occasion to force garbage collection manually. Manual garbage collection may be useful, for example, if they are testing for memory leaks that rapidly consume JVM memory.
Cluster Data
The Monitoring![]() Cluster tab provides information about the cluster that the selected server is a participant in (such as the number of servers in the cluster that are currently alive).
Cluster tab provides information about the cluster that the selected server is a participant in (such as the number of servers in the cluster that are currently alive).
The Monitoring![]() Security tab provides statistics about invalid login attempts and locked and unlocked users.
Security tab provides statistics about invalid login attempts and locked and unlocked users.
JMS
The Monitoring![]() JMS tab provides statistics on JMS servers and connections. This page also provides links to the tables of active JMS connections and active JMS servers, which monitor such attributes as total current sessions.
JMS tab provides statistics on JMS servers and connections. This page also provides links to the tables of active JMS connections and active JMS servers, which monitor such attributes as total current sessions.
JTA
The Monitoring![]() JTA tab provides statistics on the Java Transactions subsystem such as total transactions and total rollbacks. The page provides links to tables that list transactions by resource and name, and a table of in-flight transactions.
JTA tab provides statistics on the Java Transactions subsystem such as total transactions and total rollbacks. The page provides links to tables that list transactions by resource and name, and a table of in-flight transactions.
Monitoring JDBC Connection Pools
Java Database Connectivity (JDBC) subsystem resources can also be monitored via the Administration Console. The Monitoring tab for a JDBC connection pool allows you to access a table listing statistics for the instances of that pool. As with other entity tables in the Administration Console, you can customize the table to select which attributes you want to be displayed.
A number of these attributes provide important information for managing client database access.
The Waiters High field indicates the highest number of clients waiting for a connection at one time. The Waiters field tells you how many clients are currently waiting for a connection. The Connections High field indicates the highest number of connections that have occurred at one time. The Wait Seconds High field tells you the longest duration a client has had to wait for a database connection. These attributes allow you to gauge the effectiveness of the current configuration is in responding to client requests.
If the Connections High field value is close to the value of the Maximum Capacity field (set on the Configuration Connections tab), you might consider increasing the value of Maximum Capacity (the maximum number of concurrent connections). If the value in the Waiters High field indicates that clients are subject to a long wait for database access, then you might want to increase the size of the pool.
The value in the Shrink Period field is the length of time the JDBC subsystem waits before shrinking the pool from the maximum. When the subsystem shrinks the pool, database connections are destroyed. Creating a database connection consumes resources and can be time-consuming. If your system has intermittent bursts of client requests, a short shrink period might mean that database connections are being recreated continually, which may degrade performance.
Summary of Monitoring Pages in the Administration Console
|The following table lists all tables and monitoring tab pages available in the Administration Console.
|
Page |
Path to Page |
Monitoring Data |
|---|---|---|
|
Monitoring Tab Pages |
||
|
General Server Information |
servername |
State and activation time |
|
Server Performance |
servername |
Real-time graphs of request throughput, JVM memory usage, and waiting requests |
|
Cluster Statistics |
servername |
Statistics about clusters such as the number of alive servers and sent and received fragments. |
|
Server Security |
servername |
Number of invalid login attempts, total locked and unlocked users, and other security statistics |
|
Server Version Information |
servername |
JDK, WebLogic, and operating system versions |
|
Cluster |
Clusters |
Information about participating servers |
|
Entity Tables |
||
|
Servers |
Servers |
Server-specific data, such as memory usage, startup time, state, cluster participation, invalid login attempts, heap status, sockets counts, and total restarts |
|
Execute Queues |
servername |
Information about serviced and pending requests and other attributes |
|
Execute Sockets |
servername |
Protocol and other attributes of active sockets |
|
Connections |
servername |
Connect time, remote address, bytes sent and received and other attributes of connections |
|
Clusters |
Clusters |
Data such as default load algorithm and multicast address |
|
Transactions By Name |
servername |
Data about transactions organized by name |
|
Transactions By Resource |
servername |
Data about transactions organized by resource |
|
Active Transactions |
servername |
Data about in-flight transactions on this server |
|
Machines |
Machines |
Address and other attributes of machines |
|
Applications |
Applications |
List of applications |
|
EJB Deployments |
Deployments |
URL, application name, and other attributes for each EJB |
|
Web Applications |
Deployments |
Data such as URL and default servlet for each Web application |
|
Active Web Applications |
Deployments |
Data about deployed copies of this Web application |
|
Web Application Servlets |
Deployments |
Statistics for the selected Web application, such as maximum pool capacity and execution time |
|
Startup and Shutdown Classes |
Deployments |
List of registered startup and shutdown classes |
|
JDBC Connection Pools |
Services |
Initial capacity, capacity increment and other attributes of JCBC Connection Pools |
|
JDBC Multipools |
Services |
Load balancing and other attributes of JDBC Multipools |
|
JDBC Data Sources |
Services |
Pool name, JNDI name and other attributes of JDBC data sources |
|
JDBC Tx Data Sources |
Services |
Pool name, JNDI name and other attributes of JDBC Tx data sources |
|
JMS Connection Factories |
Services |
JNDI name, client ID, default priority and other attributes of JMS connection factories |
|
JMS Templates |
Services |
Data about JMS templates |
|
JMS Destination Keys |
Services |
Key type and other attributes of JMS destination keys |
|
JMS Stores |
Services |
Descriptions of JMS stores |
|
JMS Servers |
Services |
Data about JMS servers |
|
Active JMS Services |
Services |
High water mark of connections and other data about active JMS services |
|
Active JMS Servers |
Services |
Statistics about sessions, messages pending, and other data |
|
Active JMS Destinations |
Services |
Consumers, messages received and other attributes of active JMS destinations |
|
Active JMS Session Pools |
Services |
High water mark of consumers and other monitoring data |
|
JMS Destinations |
Services |
JNDI name and other data |
|
JMS Session Pools |
Services |
Acknowledge mode, maximum sessions, and other attributes of JMS session pools |
|
XML Registries |
Services |
Lists of DocumentBuilderFactories and SAXParserFactories |
|
WLEC Connection Pools |
Services |
WebLogic Enterprise (WLE) domain name, failover addresses, maximum and minimum pool size, and other information |
|
Jolt Connection Pools |
Services |
Failover addresses, maximum and minimum pool size and other attributes of Jolt connection pools |
|
Active Jolt Connection Pools |
Services |
Maximum capacity, current connections, and other data about instances of a Jolt connection pool |
|
Virtual Hosts |
Services |
Format, logfile name and other attributes of virtual hosts |
|
Mail Sessions |
Services |
Name and properties of mail sessions |
|
File T3 |
Services |
Name and path of files |
|
Users |
Security |
List of users |
|
Groups |
Security |
List of groups |
|
Access Control Lists |
Security |
List of ACLs |
|
Caching Realms |
Security |
Lists caching realms |
|
Realms |
Security |
Describes realms |
|
Domain Log Filters |
Domain Log Filters |
Servers on which the filter is registered and attributes used for filtering log messages |
|
|
|
Copyright © 2000 BEA Systems, Inc. All rights reserved.
|