|
|
This chapter describes the PTE’s Java Swing-based GUI. It provides an easy to use access point to the many parts of the Platform Test Environment. Any changes made to the GUI are saved on exit. The GUI consists, broadly, of:
The chapter also covers The SLA Editor and The Budget Monitor, general purpose tools included in the PTE.
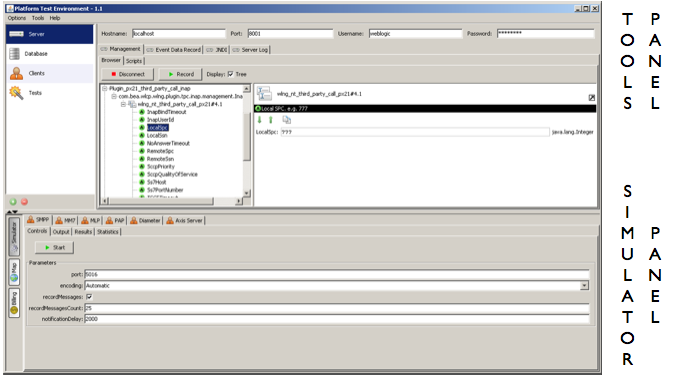
The Tools Panel is divided into two main sections:
Use this panel to select the tool you wish to use:
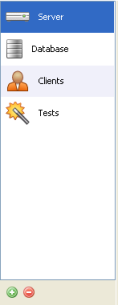
Notice the Plus and Minus icons in the lower left. You can use these to create multiple versions of the tools. For example, you could create a server tool to correspond to each server instance you are running.
The Tool Action Panel displays the actions you can do in that particular tool.
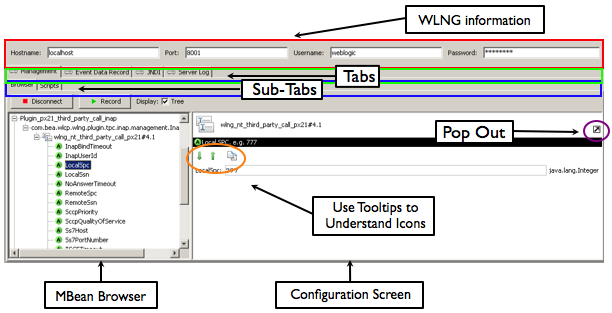
At the top of the panel, you specify the server with which you wish to interact and your administrative username and password.
Below that are the three main tabs:
| Note: | In order to run the PTE, you must have set up application and service provider accounts in Oracle Communications Services Gatekeeper, associated them with appropriate groups, and attached SLAs. You must also have done any necessary configuration of the communications services that you will be using and created instances for those communication services that require it. For a detailed description of these and other Oracle Communications Services Gatekeeper management tasks, see the System Administration Guide and Managing Accounts and SLAs, separate documents in this set. |
If you want to record a script so that you can automate the management tasks you need to do more than once, use the Record button. Once you have begun recording, simply do the tasks you wish to automate. When you are finished, click the Recording button to stop. You will get a prompt asking you to name the script. The script will automatically be saved when you close the PTE.
| Note: | Many windows display convenience functions in the form of icons, as is shown above in the orange circle. Hover your mouse over the icon, and a tooltip explaining its function will appear. |
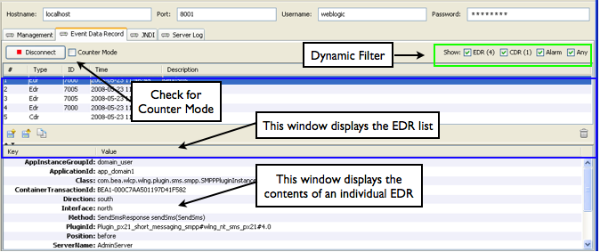
Click Connect to establish the JMS connection between the PTE EDR (and CDRs and Alarms) listener and the server instance. Select the sort of records you are interested in receiving using the Dynamic Filter, shown above in the green box. The list of EDRs displays in the window outlined in blue. Selecting a particular EDR in the list causes the contents of that record to be shown in the box outlined in red.
To export, import, or copy to the clipboard a list of EDRs, use the convenience icons in the bottom left of the EDR list window.
To save memory in situations where you are expecting a large number of EDRs, check Counter Mode. This will count the number of records, but will not display the contents.
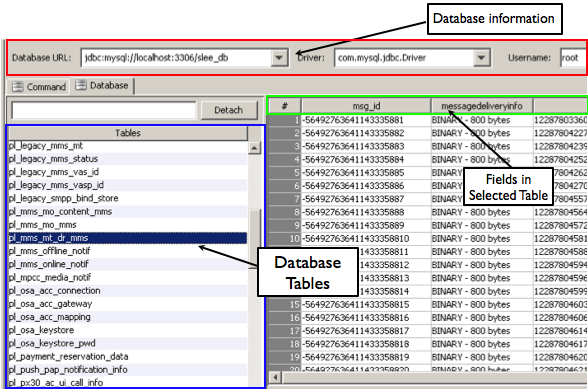
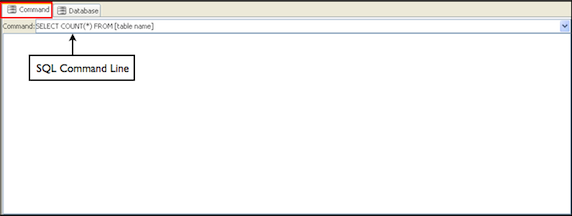
The Database tool lets you scan your database tables and manipulate them directly.
At the top of the panel you enter your database information, including your database username and password. Click the Connect button to connect to the database.
Below that are the two main tabs:
The Clients Tool Action Panel is the most complex of the UIs for the Platform Test Environment. The display is divided into three hierarchical groups:
Clients for Short Messaging, Multimedia Messaging, WAP Push, SMPP, and MM7
Clients for Audio Call, Third Party Call (PX 2.1 and 3.0), and Call Notification
Clients for Terminal Location and Presence
Clients for OP and SP Partnership Relationship Management types
Clients for Session Management, Subscriber Profile, Payment, and the example communication service
| Note: | There are RESTful versions of many of the clients. To use them instead of the SOAP versions, check the box as shown in Figure 2-9. |
| Note: | This particular client also happens to include modules that belong to the Extended Web Services Binary SMS interface. This is because the two sets of interfaces share a common network node and are bundled together in the same.EAR file in Oracle Communications Services Gatekeeper. |
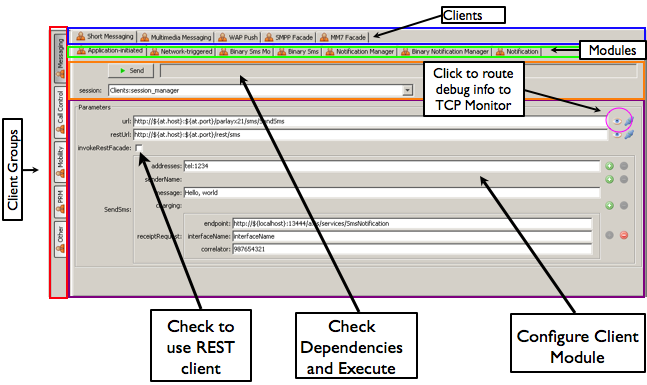
SendSms. If you wanted to test the operation SendSmsLogo, you would need to create an additional module.Once you have selected the module you wish to use, the display shows two windows. In the lower window, you configure the client module, setting any required parameters. In the upper right corner you will notice a small eye icon. Clicking this will route debug information to the TCP Monitor.
In the upper window, outlined in orange, dependencies are shown. In this case, the operation requires that the client acquire a session ID before sending the command. If you attempt to execute a command and the dependencies have not been set up, the PTE will offer to open the requisite modules for you. See Figure 2-14 below for more information on running sessions.
Once the dependencies are taken care of, you can simply click the Send button if you wish to execute the operation at that moment.
| Note: | This assumes you have already completed provisioning your user and associating that user with appropriate groups and SLAS, and have started the simulator to receive the request. |
You can also choose to string several tests together into an automated set. See the The Tests Tool section below for more information.
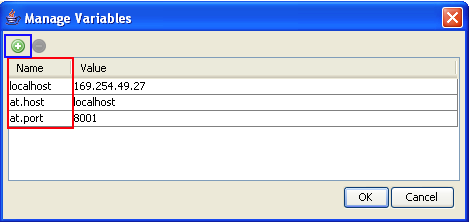
| Note: | In some module configuration windows, you will see URLs written out with variable values. |

| Note: | To set those variables, or to add others that are of use to you as you create and run tests, use the Manage Variables window. Click Tools -> Variable Manager. The default variables are shown outlined in red. To add a variable, click the plus button, outlined in blue. When you are finished editing, click the OK button. |
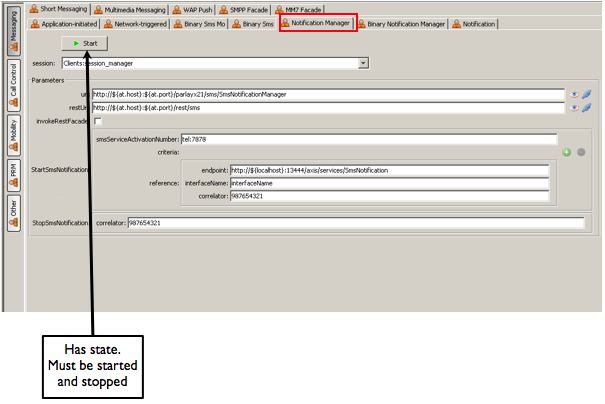
Most client modules are stateless. When you click Send, the operation is executed and it completes. But some modules have state. They are started, and they run until they are stopped. The Short Messaging Notification Manager is such a module. As shown in Figure 2-12, it has a Start button, rather than a Send button.
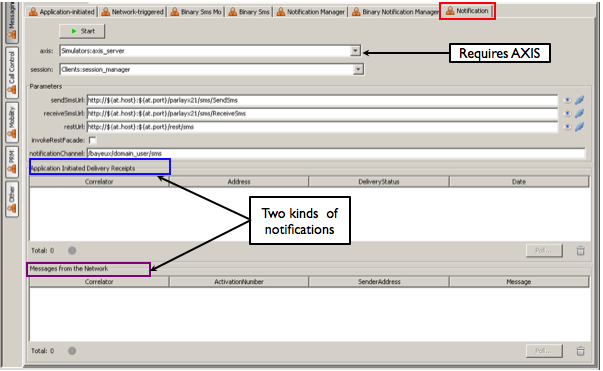
When you set up notifications, that is, when you tell Gatekeeper that your client is interested in receiving asynchronous messages from the network, the client must provide a web service to which the notifications can be delivered. These client-based web services also show up in the PTE GUI as client modules. In Figure 2-13 below, the Notifications tab is selected. This module runs the web service to which both kinds of Short Messaging notifications can be returned: Delivery Receipts for Application-initiated messages and actual SMSs sent from the network to the client application. Notice the dependency on the Axis web server. It must be running for the web service to function.Also note that the RESTful facades use Bayeux protocol channels, running in the OWLS Publish-Subscribe Server instead of SOAP-based Web Services. for more information on the OWLS pub-sub server, see “Using the HTTP Publish-Subscribe Server” in Developing Web Applications, Servlets, and JSPs For Oracle WebLogic Server at http://download.oracle.com/docs/cd/E12840_01/wls/docs103/webapp/.
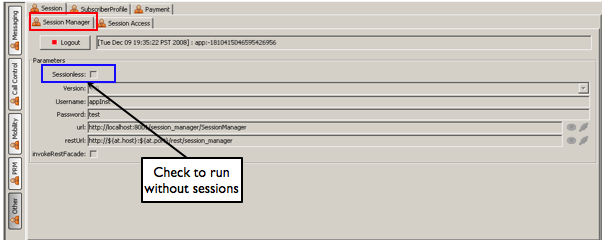
Finally there is the question of session management. The default setting in Gatekeeper is to require applications to start a session and get a Session ID before they send traffic through the system. But this requirement is configurable in Gatekeeper, and so the PTE makes it possible to turn the session requirement on and off. By selecting the Other client group and the Session client, the Session Manager module, you can simply check the Sessionless option, shown below in Figure 2-14, and your clients will not be required to acquire or use a Session ID in order to run traffic.
Once you have created your test, click the plus icon at the top of the right column to add operations. The Select an Operation window opens, as in Figure 2-16 below.
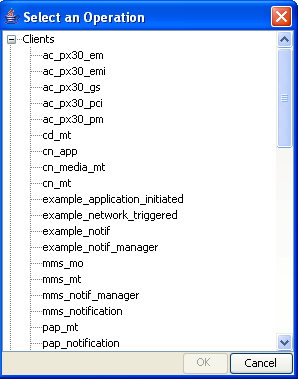
This window shows all operations available in every module in the PTE: clients, simulators, and even duration tests. Select your first operation, and then continue adding until you have completed the desired test sequence.
| Note: | If you have multiple clients that might be able to perform a particular operation, a popup window will appear and allow you to choose the one you wish to use. |
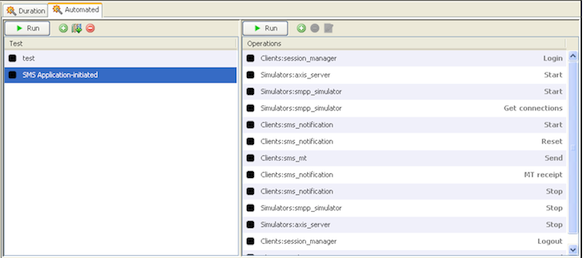
Each test sequence that you create is automatically persisted when the PTE is shut down, so that you only need to create a test once. To run a single test from the GUI, click the Run button on the top of the right column. To run the entire test sequence from the GUI, click the Run button on the top of the left column. The status of the tests is indicated by the color of the box next to the individual test item names: see Figure 2-17 below.
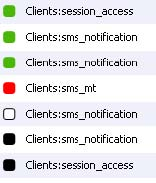
Green boxes indicate success; red boxes indicate failure; white boxes indicate an in-progress test; and black boxes indicate tests that have not yet run.
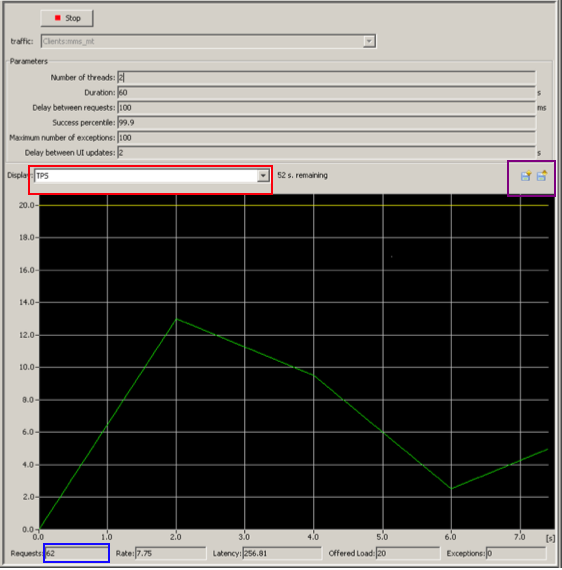
Create a new test by clicking the plus icon in the lower left corner. You are prompted for a name for the test. Configure the test in the upper portion of the right column. Select the type of traffic you wish to run, based on the client type, from the dropdown Traffic menu. Select what you wish to see graphed (Transactions Per Second, Exceptions, or Latency) in the Display dropdown menu outlined in red in the graphic above. Current statistics appear in the boxes at the bottom of the graph, like the Requests box, outlined in blue.
Make sure the appropriate simulator is running and start the test by clicking the Start button. The test runs in the background, so it is possible to run multiple tests in parallel.
Because duration test results are not saved across PTE sessions, you can choose to export results to be saved in a file and then import them back into the tool later, using the icons outlined in purple above.
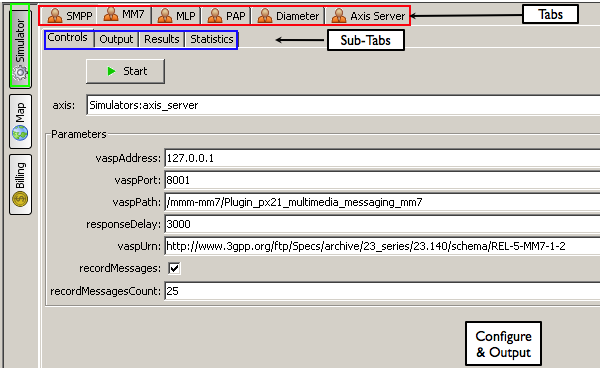
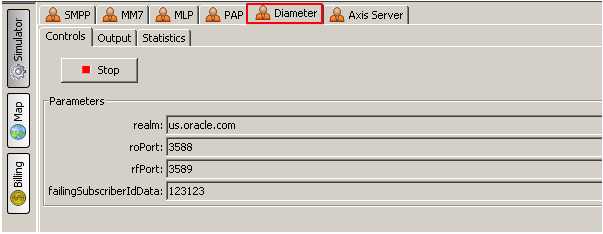
Like the Clients Tool, the Simulator panel is set up as a hierarchy. On the extreme left there are three buttons: Simulator, Map and Billing. Under the Simulator button is a set of tabs and sub-tabs. The tabs list the available simulator modules, including a simulator for the example communication service (Netex), and a separate tab and module for the Axis Server, which is required to run traffic over HTTP based protocols like MM7. See Figure 2-19 above. Under the row of tabs is the row of sub-tabs. The number of sub-tabs depends on the module selected. In all cases, there is a Control tab in which you can set up any necessary configurations. This area is also where the Start button is for each of the modules. The other tabs may allow you to see the actual content of a message or show you the statistics associated with traffic.
The Maps panel is a variant of a tool which was originally developed as part of the Application Developers SDK. It provides a map on which you can place phone terminals. This offers visual support for testing Parlay X 2.1 SMS, MMS, and Terminal Location traffic. Note the Customize button on the bar above the left side of the map. Clicking this button opens a dialog box that allows you to change the map you are using.
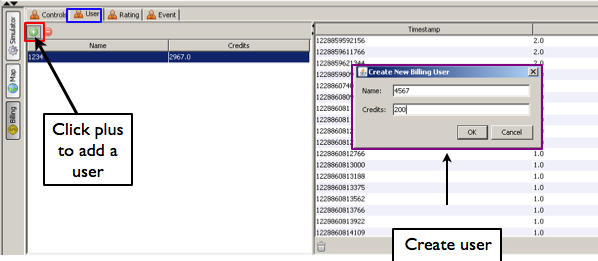
The Billing panel allows you to set up and run a billing simulator. Oracle Communications Services Gatekeeper can be integrated with billing systems that use the Diameter protocol. So to use the billing simulator with the Payment communication service, for example, you would need to create a user in the billing simulator that corresponds to the endUserIdentifier in the Payment client and then send a request from the client through the Diameter simulator to the Billing simulator
| Note: | Do not use a value of “localhost” when you are configuring the Diameter Origin Host parameter in the Payment communication service. You must use the actual name of the host. |
Managing large XML files can be difficult, particularly in a test environment where you may wish to change small details multiple times for various iterations of testing. To help you manage your SLAs, the PTE ships with an SLA editor, which manages the tags and validation so that you can focus on setting appropriate values. To access the SLA editor, first make sure you have selected the Server Tool and are connected to the server. Then click Tools -> SLA Manager in the Menu Bar. The SLAs are fetched from the file system and the SLA Browser window opens. See Figure 2-23.
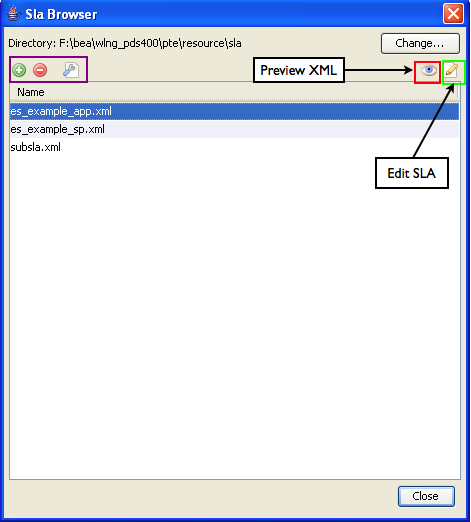
The SLA files that were fetched from the file system are listed in the main window. By default, the PTE looks in the pte/reource/sla directory. This directory has SLAs that model the various options for SLA construction. If you want to search for other files that may be on your system, click the Change... button and a file browser appears. To create an entirely new SLA, click the Plus button in the upper left corner, outlined in purple. You can also delete or rename SLAs using buttons in the same area.
To edit an SLA, select the one you are interested in and then click the pencil icon in the upper right corner, outlined in green. The SLA Editor window opens. See Figure 2-24.
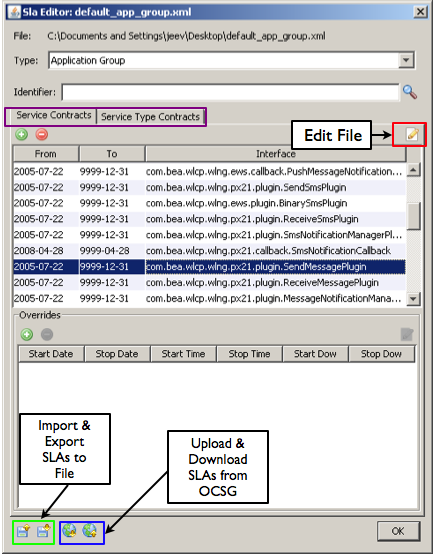
Select the SLA type using the dropdown menu and specify the group identifier. If you wish to import a different SLA from the file system, or to save changes out, use the import and export icons on the bottom left. To upload the SLAs to, or download them from, the repository in the running instance of Oracle Communications Services Gatekeeper, use the icons outlined in blue on the bottom left.
There are three basic kinds of editing you can do - the main Service Contracts and Service Type Contracts are tabs in the upper window and any Overrides you have specified appear in the lower. To edit a Service Contract, select the item you are interested in and click the pencil icon in the upper right corner. This opens the Contract Editor. See Figure 2-25.
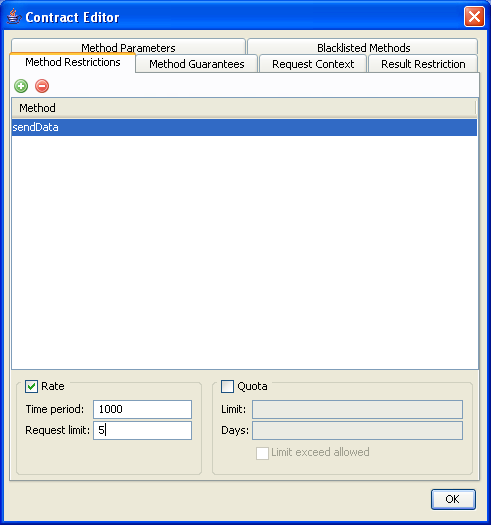
The tags that can be edited appear as tabs at the top of the window. For more information on these tags, see the “Defining Service Provider Group and Application Group SLAs” chapter in Managing Accounts and SLAs a separate document in this set.
In the figure, a rate limit method restriction is being added to the sendData operation of the sample communication service. When you have made your edits, click the OK button and the window closes. Click OK once again (on Figure 2-24) the window closes. To preview the edits you have made in XML format, click the Eye icon at the top left of the SLA Browser (Figure 2-23). The Preview SLA window opens. See Figure 2-26.
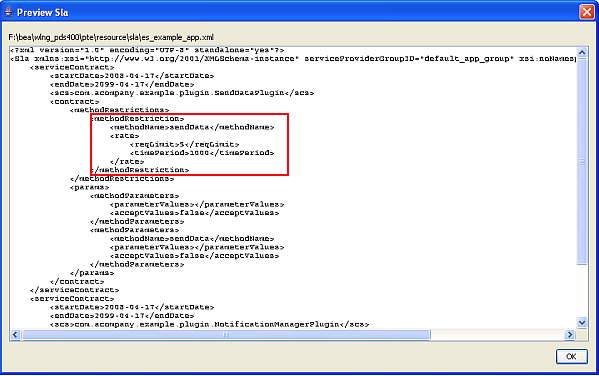
The Method Restriction rate limit that was added in Figure 2-25 is shown outlined in red.
When you have completed your edits, simply click the Close button on the SLA Browser window.
One of the key concepts to understand in dealing with Oracle Communications Services Gatekeeper is that of the budget. Based on rates, restrictions, and quotas set up in SLAs, the budget measures the level of access an application has to Oracle Communications Services Gatekeeper over time. The budget is continuously being decremented based on the application’s use of Oracle Communications Services Gatekeeper while, at the same time, it is being incremented based on the contract between the service provider and the operator. If the application’s use of Oracle Communications Services Gatekeeper exactly matches the SLA values, the budget level remains the same. In order to help developers visualize this process, the PTE includes a budget monitoring tool that tracks the state of budget usage over time.To access the budget monitor, first make sure you have selected the Server Tool and are connected to the server. Then click Tools -> Budget Monitor in the Menu Bar. The Budget Monitor window pops up. See Figure 2-27.
Select the type of budget you wish to monitor from the Budget drop down list. Select the interface type by clicking the magnifying glass icon. The Selector appears. See Figure 2-28.
Select the Service Type and the specific Service Interface you are interested in monitoring and then click OK.
| Note: | You must create instances of certain communication services to use them in Oracle Communications Services Gatekeeper. For these communication services, only Service Types that have been instantiated show up in the Selector tool. |
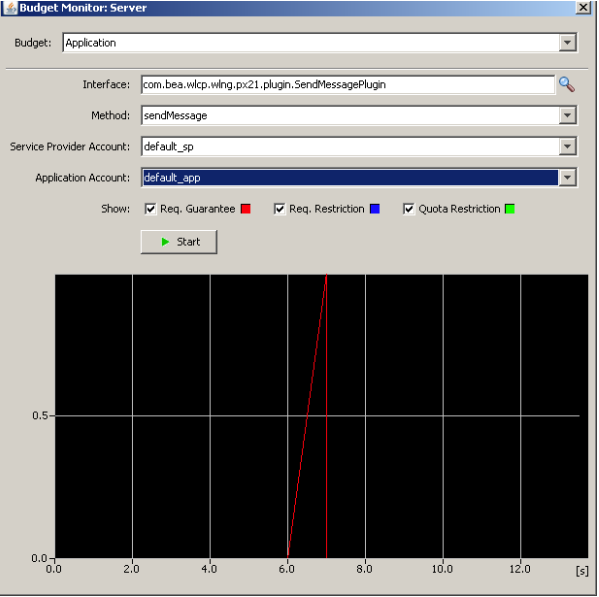
When the Selector window is closed, you return to the Budget Monitor window. Select the Method, associated Service Provider Account and Application Account information from the drop down lists. Click the Start button to begin monitoring.
The X-axis indicates time in seconds and the Y-axis the amount of budget that is available. The number of units in the Y-axis depends on values assigned in the SLA for the selected budget. Rates, quotas, and restrictions can all be mapped.


|