ndb_top displays running information in the terminal about CPU usage by NDB threads on an NDB Cluster data node. Each thread is represented by two rows in the output, the first showing system statistics, the second showing the measured statistics for the thread.
ndb_top is available in MySQL NDB Cluster 7.6 (and later).
Usage
ndb_top [-hhostname] [-tport] [-uuser] [-ppass] [-nnode_id]
ndb_top connects to a MySQL Server running as
an SQL node of the cluster. By default, it attempts to connect
to a mysqld running on
localhost and port 3306, as the MySQL
root user with no password specified. You can
override the default host and port using, respectively,
--host (-h) and
--port (-t). To
specify a MySQL user and password, use the
--user (-u) and
--passwd (-p)
options. This user must be able to read tables in the
ndbinfo database
(ndb_top uses information from
ndbinfo.cpustat and related
tables).
For more information about MySQL user accounts and passwords, see Section 6.2, “Access Control and Account Management”.
Output is available as plain text or an ASCII graph; you can
specify this using the --text
(-x) and
--graph (-g)
options, respectively. These two display modes provide the same
information; they can be used concurrently. At least one display
mode must be in use.
Color display of the graph is supported and enabled by default
(--color or -c
option). With color support enabled, the graph display shows OS
user time in blue, OS system time in green, and idle time as
blank. For measured load, blue is used for execution time,
yellow for send time, red for time spent in send buffer full
waits, and blank spaces for idle time. The percentage shown in
the graph display is the sum of percentages for all threads
which are not idle. Colors are not currently configurable; you
can use grayscale instead by using
--skip-color.
The sorted view (--sort,
-r) is based on the maximum of the measured
load and the load reported by the OS. Display of these can be
enabled and disabled using the
--measured-load
(-m) and
--os-load (-o)
options. Display of at least one of these loads must be enabled.
The program tries to obtain statistics from a data node having
the node ID given by the
--node-id (-n)
option; if unspecified, this is 1. ndb_top
cannot provide information about other types of nodes.
The view adjusts itself to the height and width of the terminal window; the minimum supported width is 76 characters.
Once started, ndb_top runs continuously until
forced to exit; you can quit the program using
Ctrl-C. The display updates once per second;
to set a different delay interval, use
--sleep-time
(-s).
ndb_top is available on macOS, Linux, and Solaris. It is not currently supported on Windows platforms.
The following table includes all options that are specific to the NDB Cluster program ndb_top. Additional descriptions follow the table.
Table 21.45 Command-line options used with the program ndb_top
| Format | Description | Added, Deprecated, or Removed |
|---|---|---|
| Show ASCII graphs in color; use --skip-colors to disable | ADDED: NDB 7.6.3 |
|
| Read given file after global files are read | (Supported in all NDB releases based on MySQL 5.7) |
|
| Read default options from given file only | (Supported in all NDB releases based on MySQL 5.7) |
|
| Also read groups with concat(group, suffix) | (Supported in all NDB releases based on MySQL 5.7) |
|
| Display data using graphs; use --skip-graphs to disable | ADDED: NDB 7.6.3 |
|
| Show program usage information | ADDED: NDB 7.6.3 |
|
| Host name or IP address of MySQL Server to connect to | ADDED: NDB 7.6.3 |
|
| Read given path from login file | (Supported in all NDB releases based on MySQL 5.7) |
|
| Show measured load by thread | ADDED: NDB 7.6.3 |
|
| Do not read default options from any option file other than login file | (Supported in all NDB releases based on MySQL 5.7) |
|
| Watch node having this node ID | ADDED: NDB 7.6.3 |
|
| Show load measured by operating system | ADDED: NDB 7.6.3 |
|
| Connect using this password (same as --password option) | ADDED: NDB 7.6.3 REMOVED: NDB 7.6.4 |
|
| Connect using this password | ADDED: NDB 7.6.6 |
|
|
Port number to use when connecting to MySQL Server | ADDED: NDB 7.6.3 |
| Print program argument list and exit | (Supported in all NDB releases based on MySQL 5.7) |
|
| Time to wait between display refreshes, in seconds | ADDED: NDB 7.6.3 |
|
| Socket file to use for connection | ADDED: NDB 7.6.6 |
|
| Sort threads by usage; use --skip-sort to disable | ADDED: NDB 7.6.3 |
|
|
Display data using text | ADDED: NDB 7.6.3 |
| Show program usage information; same as --help | ADDED: NDB 7.6.3 |
|
| Connect as this MySQL user | ADDED: NDB 7.6.3 |
Additional Options
Command-Line Format --colorShow ASCII graphs in color; use
--skip-colorsto disable.Command-Line Format --defaults-extra-file=pathType String Default Value [none]Read given file after global files are read.
Command-Line Format --defaults-file=pathType String Default Value [none]Read default options from given file only.
Command-Line Format --defaults-group-suffix=stringType String Default Value [none]Also read groups with concat(group, suffix).
Command-Line Format --graphDisplay data using graphs; use
--skip-graphsto disable. This option or--textmust be true; both options may be true.Command-Line Format --helpShow program usage information.
Command-Line Format --host=stringType String Default Value localhostHost name or IP address of MySQL Server to connect to.
Command-Line Format --login-path=pathType String Default Value [none]Read given path from login file.
Command-Line Format --measured-loadShow measured load by thread. This option or
--os-loadmust be true; both options may be true.Command-Line Format --no-defaultsDo not read default options from any option file other than login file.
Command-Line Format --node-id=#Type Integer Default Value 1Watch the data node having this node ID.
Command-Line Format --os-loadShow load measured by operating system. This option or
--measured-loadmust be true; both options may be true.Connect to a MySQL Server using this password and the MySQL user specified by
--user. Synonym for--password.This password is associated with a MySQL user account only, and is not related in any way to the password used with encrypted
NDBbackups.Command-Line Format --password=passwordType String Default Value NULLConnect to a MySQL Server using this password and the MySQL user specified by
--user.This password is associated with a MySQL user account only, and is not related in any way to the password used with encrypted
NDBbackups.Command-Line Format --port=#Type Integer Default Value 3306Port number to use when connecting to MySQL Server.
(Formerly, the short form for this option was
-t, which was repurposed as the short form of--text.)Command-Line Format --print-defaultsPrint program argument list and exit.
Command-Line Format --sleep-time=#Type Integer Default Value 1Time to wait between display refreshes, in seconds.
Command-Line Format --socket=pathType Path name Default Value [none]Use the specified socket file for the connection.
Command-Line Format --sortSort threads by usage; use
--skip-sortto disable.Command-Line Format --textDisplay data using text. This option or
--graphmust be true; both options may be true.(The short form for this option was
-xin previous versions of NDB Cluster, but this is no longer supported.)Command-Line Format --usageDisplay help text and exit; same as
--help.Command-Line Format --user=nameType String Default Value rootConnect as this MySQL user. Normally requires a password supplied by the
--passwordoption.
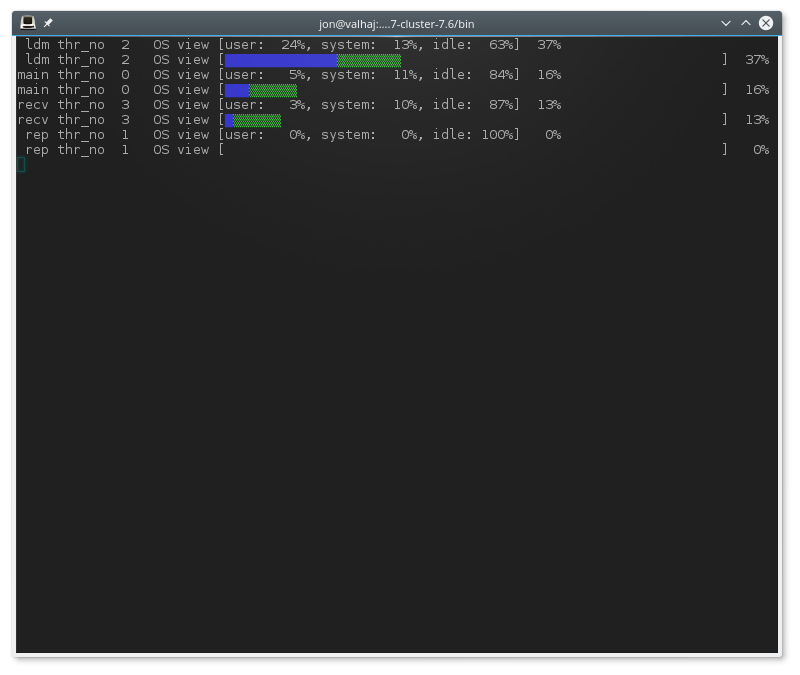
Sample Output.
The next figure shows ndb_top running in a
terminal window on a Linux system with an
ndbmtd data node under a moderate load.
Here, the program has been invoked using
ndb_top
-n8
-x to provide
both text and graph output: