Viewing the Exalogic System
Viewing the Exalogic system details how you view the virtual Exalogic system in Exalogic Control's BUI using the four tabs on the Center pane, namely Dashboard, Details, Controls, and Networks. You can also perform relative actions by clicking the respective actions on the Actions pane. The actions that are allowed to be performed from the Actions pane are context sensitive to the selected assets on the Navigation pane. The actions are also role based, not all users will be able to perform all actions. For more information about roles, see User Profiles.
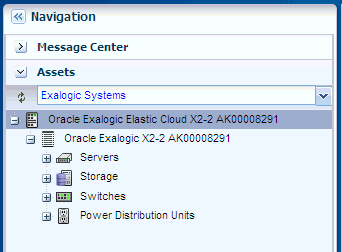
To view the Exalogic system in Exalogic Control's BUI, complete the following steps:
Viewing System Summary, Membership Graph, and Status
You can click the Dashboard tab on the center pane to view the following information about your Exalogic machine:
-
System summary
-
Membership graph
-
System status
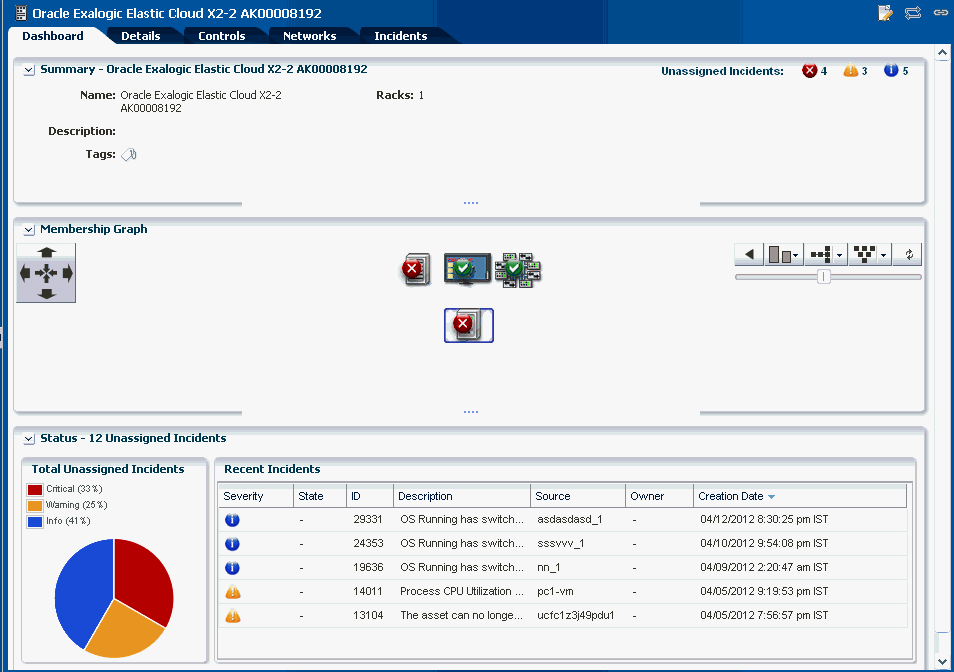
When you click the Dashboard tab, three sections (Summary, Membership Graph, and Status) are displayed, as shown in Figure 8-4.
Table 8-1 Information Displayed in Dashboard View
| Section | Description |
|---|---|
|
Summary |
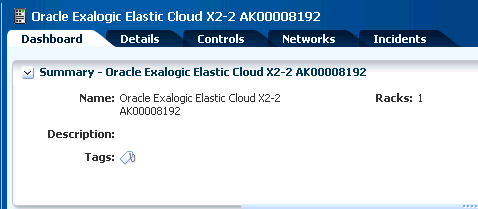
The Summary section displays the name of the Exalogic system, description or name of the system identifier, number of racks that are part of the system, and also the number of unassigned incidents. The Unassigned Incidents icon in the summary pane includes incidents resulting from hardware faults. The three icons depict Critical Incidents, Warnings, and Information Incidents respectively. These incidents are from the assets that belong to all Exalogic racks. |
|
Membership Graph |
The Membership Graph pane displays the Exalogic system as a hierarchy of its components. It shows the relationship between the OVM Manager, physical InfiniBand fabric, and the hardware that is grouped in the rack. You can instantly navigate to any asset by double clicking on the asset in the membership graph. Using the controls on the top right of the graphic pane, you can change the view of the graph to either a horizontal or a vertical orientation. You can also refresh the view by clicking the Refresh icon. You can also change the graph depths or size of the images. |
|
Status |
The Status Pane displays the total unassigned incidents in chart format as well as the recent incidents encountered by the Exalogic system. In the Recent Incidents section, the following details are displayed:
|
Viewing Exalogic System Information
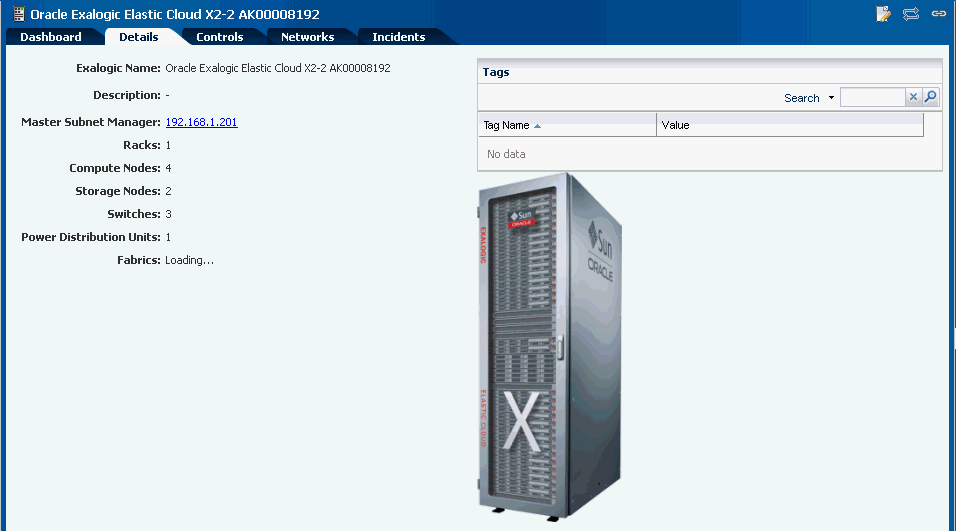
You can click the Details tab on the center pane to view the following information about your Exalogic machine:
-
Machine name
-
Description
-
The IP address of the IB switch on which the master subnet manager is running
-
Number of racks
-
Number of compute nodes
-
Number of storage nodes
-
Number of switches
-
Number of power distribution units
-
Number of fabrics
In the Tags pane, the tag names and their respective values are displayed. You can search for a particular tag using the Search feature.
Viewing Exalogic Control Information
You can click the Controls tab on the center pane to view the following information about Exalogic Control:
-
Names and version numbers of Exalogic Control software components
-
Names of virtual machines hosting Exalogic Control components
-
Names of the Oracle VM Server hosting these virtual machines
You can select any Exalogic Control component in the table and double-click to view the dashboard for each component. This table helps you identify where the Exalogic Control software components are running in your Exalogic machine. Use the Refresh icon on the Exalogic Control Software pane to refresh the list, when needed.
Viewing Infrastructure Networks
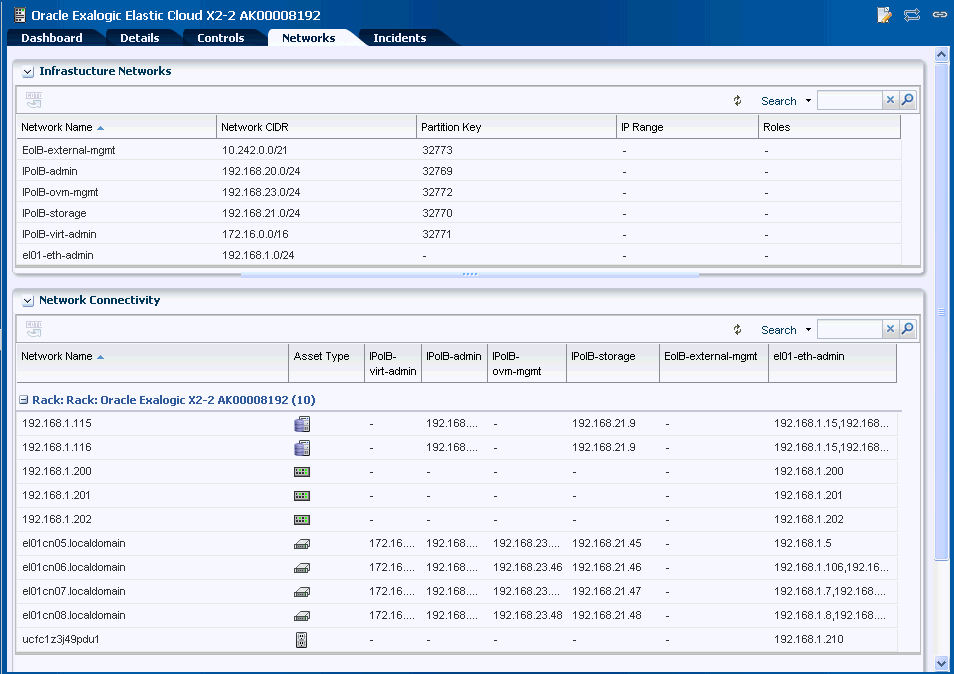
You can click the Networks tab on the center pane to view information about infrastructure networks and network connectivity.
Figure 8-7 Infrastructure Networks and Network Connectivity
Description of "Figure 8-7 Infrastructure Networks and Network Connectivity"
The Infrastructure Networks section displays the infrastructure networks that are used in the Exalogic machine for communication between Exalogic control components, and vServers in the Exalogic vDC.
For each infrastructure network, the following information is displayed:
-
Network Name - displays the name of the managed network.
-
Network CIDR - displays the type of the asset.
-
Partition Key - displays the partition of the port.
-
IP Range - specifies the minimum and maximum boundaries of the IP addresses assigned to the network.
-
Roles - displays the role.
The Network Connectivity section displays the infrastructure networks with IPs assigned to the individual hardware components of Exalogic system.
-
Network Name
-
Asset Type
Viewing Unassigned Incidents and Alerts
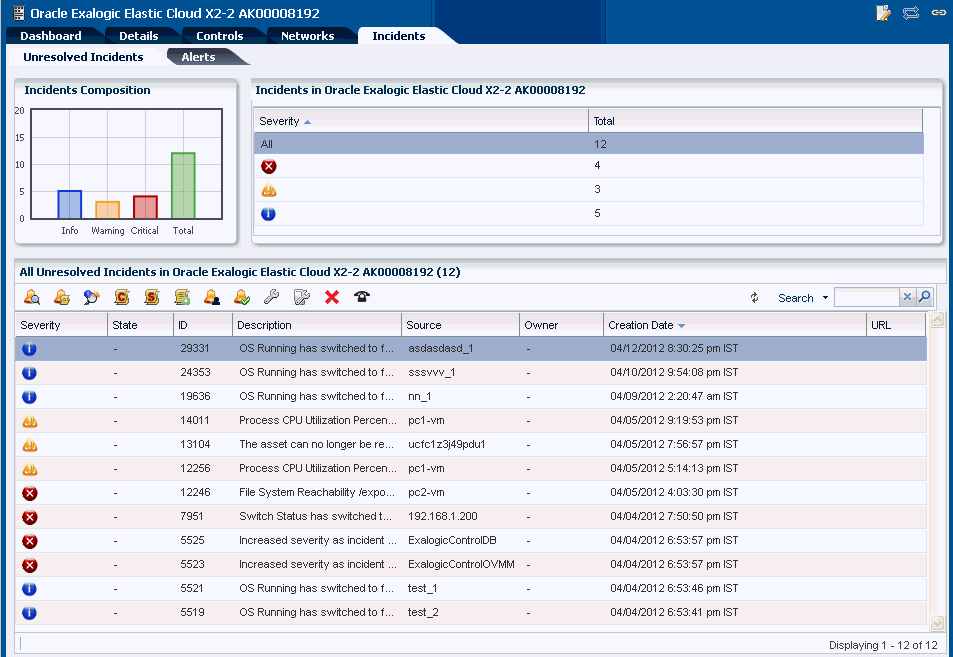
You can click the Incidents tab on the center pane to view all unassigned incidents and alerts in your Exalogic system.
Figure 8-8 Unresolved Alerts and Incidents
Description of "Figure 8-8 Unresolved Alerts and Incidents"
In addition to viewing such alerts and incidents, you can take actions to resolve them.
