9 Monitoring the Topology Using Oracle Enterprise Manager Cloud Control
Oracle Enterprise Manager Cloud Control 12c with Oracle WebLogic Server Management Pack Enterprise Edition's capabilities include Exalogic Elastic Cloud-specific management tools to manage and monitor Oracle software deployed in physical and virtual Exalogic Elastic Cloud environments.
These monitoring capabilities expand on the existing Oracle WebLogic Server management features that span the following:
-
Application performance management
-
Configuration management
-
Service-level management and operations
-
Access full management capabilities with dedicated dashboards for Oracle Exalogic Elastic Cloud targets to easily monitor overall health, availability, and performance and manage Exalogic hardware and software, including hosts, Oracle WebLogic domains, application deployments, and Coherence clusters running on Oracle Exalogic Elastic Clouds.
-
Drill down into application deployments to identify metrics and set thresholds.
-
Display alerts, status, and incidents hierarchically across the Exalogic Elastic Cloud environment and provide operations with notifications in relation to service levels and thresholds.
-
Drill down from the Exalogic Elastic Cloud dashboard and underlying menus into the detailed component and JVM-level performance metrics, configuration management, and provisioning and cloning that provide end-to-end management for operations and administrators.
-
Use the Exalogic Topology View to immediately identify cross-tier relationships between components, middle-tier platforms, and the underlying hosts and hardware that make up an Exalogic Elastic Cloud system.
-
Make use of additional Exalogic dashboard enhancements, including:
-
Integrated hardware and software schematics
-
Hardware-software topology views
-
Hardware targets monitoring (Compute, ZFA appliance, Infiniband Fabric, ILOM)
-
Oracle Traffic Director (OTD) monitoring
-
Support for virtual and non-virtual configurations
-
Monitoring of Exalogic vServer guest Virtual Machines (VMs)
-
Health checks
-
Trusted partition/Virtual Central Processing Unit (vCPU) licensing report
-
Performance and filtering optimizations
-
-
Manage hardware and software incidents from a single pane of glass using Enterprise Manager Cloud Control’s incident management system, including hardware alarms and alerts from Enterprise Manager Ops Center.
This chapter includes the following topics:
- Accessing Oracle Enterprise Manager Cloud Control 12c
Refer to this topic for information on accessing the Oracle Enterprise manager cloud control 12c. - Discovering an Oracle Exalogic Elastic Cloud Target
To monitor and manage your Oracle Exalogic Elastic Cloud machine using Oracle Enterprise Manager Cloud Control 12c, you must prepare the Exalogic Elastic Cloud environment for discovery and then discover the related system targets. - Using Exalogic-Specific Pages in Oracle Enterprise Manager Cloud Control 12c
Refer to the topic for procedure to navigate to the Exalogic Elastic Cloud-specific pages in Oracle Enterprise Manager Cloud Control 12c.
Parent topic: Managing an Exalogic Appliance
9.1 Accessing Oracle Enterprise Manager Cloud Control 12c
Refer to this topic for information on accessing the Oracle Enterprise manager cloud control 12c.
https://hostname.domain[:port]/em.
For example:
https://exalogicem.mycompany.com:1159/em
9.2 Discovering an Oracle Exalogic Elastic Cloud Target
To monitor and manage your Oracle Exalogic Elastic Cloud machine using Oracle Enterprise Manager Cloud Control 12c, you must prepare the Exalogic Elastic Cloud environment for discovery and then discover the related system targets.
- If your configuration is physical, follow the steps in Discovering Exalogic Machine - Physical Configuration in Oracle Enterprise Manager Cloud Control Managing and Monitoring an Exalogic Elastic Cloud Machine
- If your configuration is virtual, follow the steps in Discovering Exalogic Machine - Virtual Configuration in Oracle Enterprise Manager Cloud Control Managing and Monitoring an Exalogic Elastic Cloud Machine.
9.3 Using Exalogic-Specific Pages in Oracle Enterprise Manager Cloud Control 12c
Refer to the topic for procedure to navigate to the Exalogic Elastic Cloud-specific pages in Oracle Enterprise Manager Cloud Control 12c.
Oracle Enterprise Manager displays comprehensive metrics for Oracle Exalogic. When these metrics are displayed in tabular format, you can sort them in ascending or descending order. This feature enables you to find highest and lowest values easily.
This section contains the following topics:
- Management and Monitor Features for Exalogic Configurations
You can select software components directly from the Exalogic Elastic Cloud menu and can access hardware components by first selecting members. - Management and Monitor Features for Exalogic Virtual Configurations
Additional monitoring and management features are available in Enterprise Manager Cloud Control 12c for an Exalogic Elastic Cloud in a virtual configuration.
9.3.1 Management and Monitor Features for Exalogic Configurations
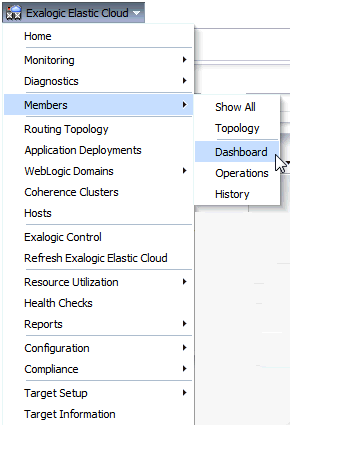
You can select software components directly from the Exalogic Elastic Cloud menu and can access hardware components by first selecting members.
Figure 9-1 Exalogic Elastic Cloud Menu

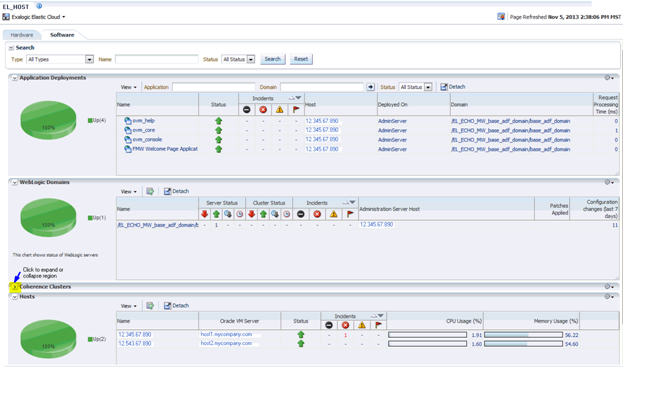
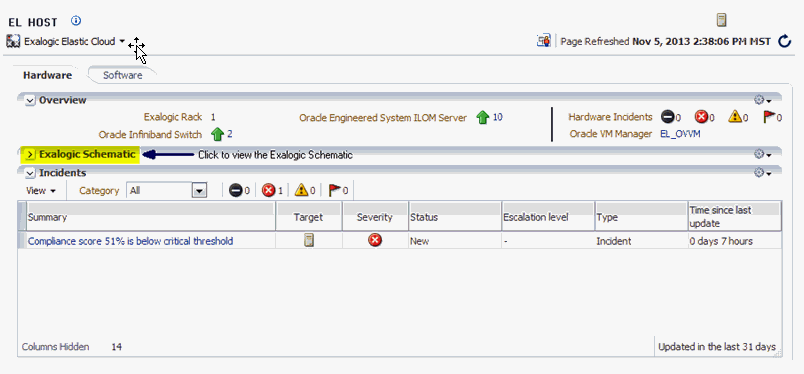
The Exalogic Elastic Cloud Dashboard is comprised of two tabs, Software tab and the Hardware tab.
-
Application Deployments
-
WebLogic Domains
-
Coherence Clusters
-
Hosts
Figure 9-2 Exalogic Elastic Cloud Dashboard Software Tab

Figure 9-3 Exalogic Elastic Cloud Dashboard Hardware Tab

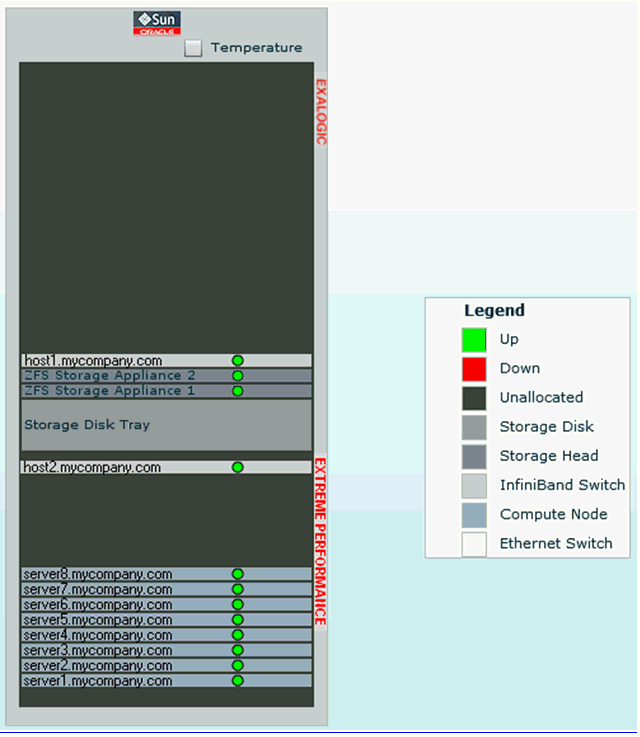
Figure 9-4 Exalogic Elastic Cloud Schematic

-
See Monitoring and Managing Exalogic in Oracle Enterprise Manager Cloud Control Managing and Monitoring an Oracle Exalogic Elastic Cloud Machine for further information on the Exalogic Elastic Cloud Dashboard and for details on the following:
-
Monitoring the Hardware Components of Exalogic Elastic Cloud
-
Visualizing Relationships Between Exalogic Software and Hardware Components
-
Analyzing the Impact of Component Failures
-
-
See Monitoring Hosts and Applications in Oracle Enterprise Manager Cloud Control Managing and Monitoring an Oracle Exalogic Elastic Cloud Machine for details on the following:
-
Viewing Hosts
-
Viewing Application Deployments
-
Viewing WebLogic Domains
-
Viewing Coherence Clusters
-
Creating Exalogic Reports
-
9.3.2 Management and Monitor Features for Exalogic Virtual Configurations
Additional monitoring and management features are available in Enterprise Manager Cloud Control 12c for an Exalogic Elastic Cloud in a virtual configuration.
-
See Monitoring Tasks for Exalogic Virtual Configurations in Oracle Enterprise Manager Cloud Control Managing and Monitoring an Oracle Exalogic Elastic Cloud Machine for details on the following:
-
Exalogic Control Stack Monitoring
-
Viewing and Managing Exalogic Consumption Tracking
-
Viewing Incidents and Status Changes Created for an Exalogic System in Ops Center as Incidents in Cloud Control
-
Viewing the vCPU Consumption Report
-
Viewing the Resource Consumption Trend
-
Exporting the vCPU Consumption Report
-
-
See Management Tasks for Exalogic Virtual Configurations in Oracle Enterprise Manager Cloud Control Managing and Monitoring an Oracle Exalogic Elastic Cloud Machine for details on the following:
-
Configuring the Exalogic Guest Base Template
-
Creating an Exalogic Control VM
-
Configuring the Exalogic Network
-