Release 7.3
Part Number E05179-08
Contents
Previous
Next
| Oracle Demantra Demand Management User Guide Release 7.3 Part Number E05179-08 | Contents | Previous | Next |
This chapter covers the following topics:
To manage or view forecasts and demand, you start in the Collaborator Workbench and launch any of the relevant Demand Management worksheets. Worksheets with the necessary series for analysis and modification of the forecast are available for the analyst at the beginning of each cycle.


The first step in the Demand Management process is to look at your previous cycle and determine how accurate your forecasts were. Using the Waterfall Analysis worksheets you can compare actual versus forecast demand for individual product categories, organizations, and regions (zones). By comparing actuals to forecast, demand planners can identify problem areas, and deduce why forecast demand did better (or worse) than planned.
For example, a retailer notices that some of their seasonal product categories did not perform well during December. Using this data, your demand analyst deduces that an unseasonably mild winter was to blame. Since this anomaly was restricted to December, the demand analyst decides to not make any changes in future demand for those products. Based on the results in the Forecast Accuracy worksheet, demand analysts can make the required adjustments and take those lessons learned and apply them to the next forecast.
The Waterfall Analysis worksheet is aggregated to the following levels, which allows you to view and slice data depending on the details in which you’re interested:
Product Category and Zone
Product Category and Organization
The following archived forecasts are used in these worksheets:
4 Week Lag Forecast: The forecast series for the four weeks prior to the current week.
8 Week Lag Forecast: The forecast series for the eight weeks prior to the current week.
12 Week Lag Forecast: The forecast series for the 12 weeks prior to the current week.
4, 8, and 12-Week Lag Absolute Percentage Error: A measure of forecast accuracy, which is calculated as actual demand minus forecast demand, and displayed as a percentage.
4, 8, and 12-Week Lag Absolute Deviation: A measure of forecast accuracy, and represents the average amount that the actual demand varies from forecast demand.
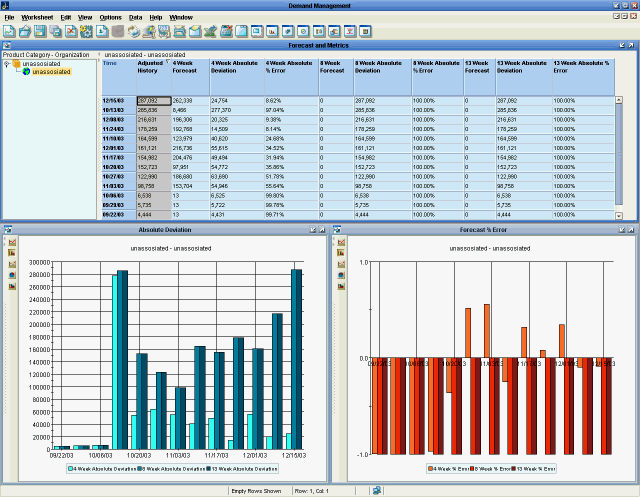
The Forecast and Metrics view displays a table showing demand and forecast values for individual products, broken down by weekly time buckets.

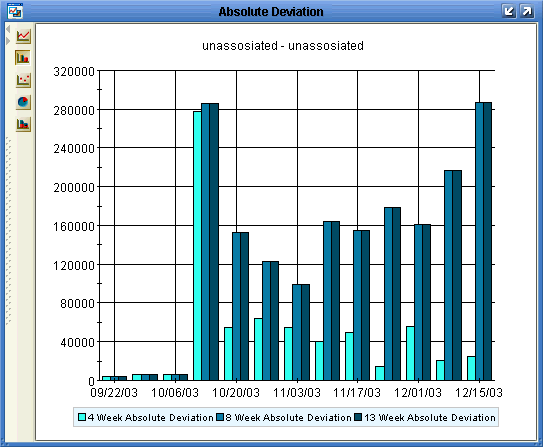
The Absolute Deviation view graphically represents the amount of deviation that exists in your forecast at the four, eight and 13 week level, represented as total units. Use the Absolute Deviation view to determine how much real demand differs from the forecast.

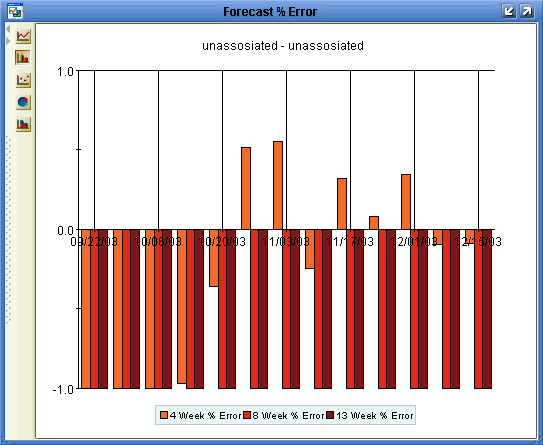
The Forecast Percentage view graphically represents the amount of deviation that exists in your forecast at the four, eight and 13 week level, represented as a percentage of the demand. Use the Forecast Percentage view to determine how much real demand differs from the forecast.

Basics:
| Accessing this Worksheet | Do one of the following:
|
| Levels you can select | Either:
|
| Time Aggregation | Weekly |

Once you have reviewed your forecast from previous cycles to determine how accurate it was, the next step is to review the forecast for the current planning cycle. The Demand Analysis worksheets are available at the start of the planning cycle, and display historical data, forecasted demand accuracy statistics and demand priority at various levels of aggregation.
You can use the Demand Analysis worksheets to view, edit, and approve the forecast for individual weekly time buckets. The Demand Analysis worksheet is aggregated to the following levels, which allows you to view and slice data depending on the details in which you’re interested:
Product Category and Organization
Product Category and Zone
Item and Organization
Item and Zone
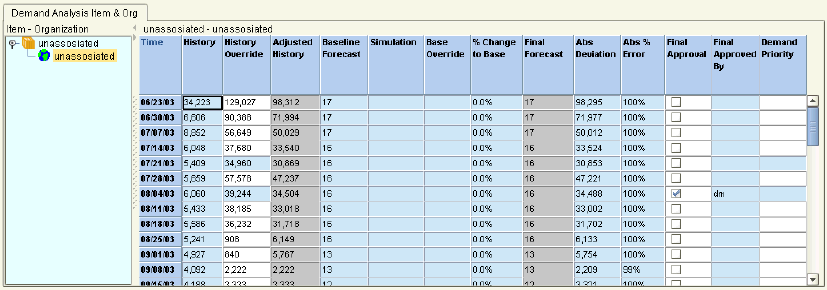
The Demand Tracking table compares sales and demand figures, at your chosen aggregation level, in weekly time buckets. It gives analysts a side-by-side view of their actual sales, demand and forecasted sales, along with Absolute Deviation and Absolute Percentage Error for comparison.
![]()
This table tracks the following on a weekly basis:
History
History Override
Adjusted History
Baseline Forecast
Simulation
Base Override
% Chg to Base
Final Forecast
Absolute Deviation
Absolute Percentage Error
Demand Priority
This table also enables users to track final approval for each line in the forecast. For more information, see Approving the Forecast.
The Demand Tracking graph displays the Sales, Demand, Sales Forecast, Simulation, and Final Forecast values for the chosen product category over time.
![]()
The Detail Demand Analysis table is an embedded worksheet that compares sales and demand figures for your chosen aggregation level, in weekly time buckets. It gives analysts a side-by-side view of their historical sales, and forecasted sales, along with Absolute Deviation and Absolute Percentage Error for easy comparisons.
Use this worksheet to look at the item level detail for the category. Analysts often look at a higher level first and if the data is not what they expect, they drill down to lower levels to see the detail. As you click on different categories, the detail level worksheet reflects the items for the category, allowing you to review details for that particular item.

In My Worksheets (in Collaborator Workbench), click Demand Analysis. Or if a worksheet is currently open, click File > Open. Click Demand Analysis and then click Open.
If the worksheet does not show data immediately, click Data > Rerun. Or click the Run button.
This launches the Demand Analysis worksheet.
Enters data in the History Override field for history or base override and/or the % Chg to Base field for the Forecast.
The results are shown in the Adjusted History and Final Forecast columns.
Note: You can select and edit multiple cells.
From the Data menu, choose Save Data. Or click the Save Data button.
From the Data menu, choose Rerun.
The worksheet updates to display the edited values.
Note: This setting is only applicable for Demantra integrations with EBS.
In My Worksheets (in Collaborator Workbench), click Demand Analysis. Or if a worksheet is currently open, click File > Open. Click Demand Analysis and then click Open.
If the worksheet does not show data immediately, click Data > Rerun. Or click the Run button.
This launches the DM: Demand Analysis worksheet.
In the Demand Priority field, double-click the cell for which you want to set a demand priority.
Enter the desired (numerical) priority.
From the File menu, choose Save Worksheet.
Approvers are notified in the My Tasks window that a new forecast is available for the current planning cycle.
In My Tasks (in Collaborator Workbench), click Demand Analysis. Or if a worksheet is currently open, click File > Open. Click Demand Analysis and then click Open.
If the worksheet does not show data immediately, click Data > Rerun. Or click the Run button.
This launches the Demand Analysis worksheet.
Do one of the following:
To approve a line item in the forecast, click the appropriate check box in the Approve column.
To final approve a line item in the forecast, click the appropriate check box in the Final Approve column.
From the File menu, choose Save Worksheet.
In My Tasks (in Collaborator Workbench), select the Demand Analysis worksheet and then click Done.
Demand Management notifies the final approver when all analysts have approved the current forecast.
| Accessing this Worksheet | Do one of the following:
|
| Levels you can select | One of:
|
| Time Aggregation | Weekly unless Oracle Demantra was implemented with a monthly or daily time period. |
Predefined Worksheets
Worksheets with the necessary series for analysis and modification of the forecast and historical data will be available for the planner at the beginning of each cycle. These are the same worksheets available in Oracle Demantra Demand Management. For each set, there are four predefined high level worksheets and one base level worksheet that is launched from the high level worksheet. The worksheets are:
Demand Analysis for Product Category & Zone
Demand Analysis for SKU & Zone Entity
Demand Analysis for Product Category & Org
Demand Analysis Detail for SKU & Org
Worksheets for Demand by Base Model, Option, and Item
There are configure to order seeded worksheets for the review of the bill of material dependent demand. The purpose of these worksheets is to support the demand planning process by analyzing the dependent demand for all the options and items that belong to a base model. This analysis can be accomplished either across all the location dimensions such as organization and site or for a specific organization and site. Some worksheets display the information an indented bill of material layout.
This table shows information about worksheet CTO: Item Demand by BOM by Week (Crosstab). This worksheet is similar to worksheet CTO: Item Demand by BOM by Month (Crosstab). However, it is at the week time level.
Selected series:
History
Consensus Forecast
Forecast Dependent Demand
Final Plng Pct
Forecast Dependent Demand Override
Plng Pct Override
Final Forecast Dependent Demand
Final Plng Pct
Planning Percentage Option
Worksheets for Demand Forecast for All Items of an Option and Base Model
These seeded worksheets are for the dependent demand review of all the items for an option-model combination. The purpose of these worksheets is to support the demand planning process by analyzing the dependent demand for all the dependent items for an option and base model. This analysis can be accomplished either across all the location dimensions such as organization and site or for a specific organization and site. There are two seeded worksheets--one across all the organizations and sites and the other by organization and site. If the worksheet display is across all organizations, Final Planning Percentage is not in the display.
This table shows information about worksheet CTO: Demand for All Items of an Option & Base Model. This worksheet is similar to worksheet CTO: Demand for All Items of an Option & Base Mode across Org and Site. However, it does not have Organization and Site selected for Levels in the page section and does not display Final Planning Percentage.
Selected series:
History
Final Forecast Dependent Demand
Forecast Dependent Demand
Consensus Total Demand
Worksheet CTO: Demand for All Items of an Option & Base Model across Org and Site is similar to worksheet CTO: Demand for All Items of an Option & Base Model. However, this worksheet has Organization and Site selected for Levels in the page section and displays Final Planning Percentage.
Worksheets for Total Demand and Amount by Option Across All Models
These seeded worksheets are for the review of option demand across all base models. The purpose of these worksheets is to support the demand planning process by analyzing the demand generated for the options across base models. This analysis can be accomplished either across all the location dimensions such as organization and site or for a specific organization and site. There are two seeded worksheets--one across all the organizations and sites and another by organization and site.
This table shows information about worksheet CTO: Total Demand & Amount by Option Across All Models. This worksheet is similar to worksheet CTO: Total Demand & Amount for Options by Base Model. However, it does not have Base Model selected for Levels in the page section.
Selected series:
History
Final Forecast Dependent Demand
Final Forecast Dependent Demand Amount
Consensus Total Demand
Consensus Total Demand Amount
Worksheet CTO: Total Demand & Amount for Options by Base Model is similar to worksheet CTO: Total Demand & Amount by Option Across All Models. However, this worksheet has Base Model selected for Levels in the Page section.
This table shows information about worksheet CTO: Item Demand by BOM by Month (Crosstab). This worksheet is similar to worksheet CTO: Item Demand by BOM by Week (Crosstab). However, it is at the month time level.
Selected series:
History
Final Forecast Dependent Demand
Forecast Dependent Demand Override
Plng Pct - Existing
This table shows information about worksheet CTO: Total Demand and Amount by Item and Week
Selected series:
Final Forecast Dependent Demand
Consensus Total Demand
Final Forecast Dependent Demand Amount
Consensus Total Demand Amount
By default, CTO worksheets are filtered to only display items with CTO data. This includes items that are CTO-only, as well as items with both CTO and sales data. CTO worksheets can be configured to also display general sales data through the Advanced Worksheets Options dialog box.
To see the Advanced Worksheet Options dialog box, go to Worksheet Designer, navigate to section Aggregation, and click button Advanced. You can click button Advanced if either:
The worksheet includes a series that is based on a general level
You select a general level as an aggregation level or filter
These are the settings:
Include SALES_DATA combinations only: The worksheet displays all of the combinations that have historical demand (that exist in table SALES_DATA).
Include CTO combinations only: The worksheet displays only combinations that have historical demand for the specified base models.
Both options: The worksheet displays all combinations that have historical demand or for the specified base models.
Neither option: The worksheet displays all combinations that have historical demand and for the specified base models.
All General Levels: Available only when you select neither of the other options. The Neither option displays but uses the lowest level of aggregation for the specified members as criteria for displaying combinations
Caution: Overriding the Base Override series for the Option and Option Classes series may cause unexpected results when viewing worksheet data and creates extraneous combinations in the SALES_DATA table. To prevent this, Oracle strongly recommends adding an Edit-Lock expression to the Base Override series and any other SALES_DATA series that are not relevant to Options and Option Classes.
For more information, see Creating an Edit-Lock Expression in the Oracle Demantra Implementation Guide.
The following Demantra Service Parts Forecasting worksheets are available:
SPF: Analyze Forecast Organization Latest Revision
SPF: Analyze Forecast Latest Revision
SPF: Analyze Organization Base Model Spare
Use this worksheet to review and modify the forecast for a specific Latest Revision/Organization. You can view the inputs used for both forecasting methods (statistical and calculated) and review both the forecasts and MAPE values for each.
You can then modify the historical demand and analytical settings and run simulations. Reject a simulation to roll back the changes and start over. Accept a simulation if you prefer the results over the original values.
You can also toggle between different forecast methods or override the forecast manually. The series SPF Final Forecast displays results of any changes.
The SPF: Analyze Forecast Organization Latest Revision worksheet uses the following series:
SPF Item Usage
SPF Item Usage Override
SPF Item Usage Final
SPF Baseline Forecast
SPF Simulation
SPF Calculated Forecast
SPF Forecast Method
SPF Forecast Override
SPF Final Forecast
SPF Failure Rate % Final
SPF Forecast MAPE (Out of Sample)
SPF Calculated Forecast MAPE
SPF Average Demand
For details about these series, see Service Parts Forecasting Series.
This worksheet provides an aggregated view of item usage, statistical and calculated forecasts, and accuracy metrics for a Latest Revision consisting of one or more spares across all organizations. You can easily modify the worksheet to display specific spares, organizations, or tiers. When more detailed analysis of Latest Revision is necessary, use the SPF: Analyze Forecast Spare/Organizations worksheet.
This worksheet does not provide the SPF Forecast Override series by default, but you can add it if desired.
The SPF: Analyze Forecast Latest Revision worksheet includes the following series:
SPF Item Usage Final
SPF Baseline Forecast
SPF Simulation
SPF Calculated Forecast
SPF Forecast Method
SPF Forecast Override
SPF Final Forecast
SPF Forecast MAPE (Out of Sample)
SPF Analytical Forecast MAPE
SPF Calculated Forecast MAPE
SPF Analytical Forecast BIAS %
SPF Calculated Forecast BIAS %
SPF Final Forecast MAPE 1 Month Lag
For details about these series, see Service Parts Forecasting Series.
This worksheet displays the Base Model, Spare, and the Latest Revisions servicing the Base Model at the Organization level. This view allows you to carefully examine historical install base and the projected install base. In this view you can override or simulate changes to install base and see how it will affect the forecast across spares that are associated with the base model.
The worksheet uses the BOM tree with Base Model displayed followed by all spares that are part of the base model. Modifications which result in changes of values shown in the SPF Install Base Final or SPF Failure Rate % Final series are propagated to the SPF Calculated Forecast series.
The SPF: Analyze Organization Base Model Spare worksheet includes the following series:
SPF Latest Rev
SPF Install Base under Contract
SPF Install Base Forecast
SPF Install Base Simulation
SPF Install Base Override
SPF Install Base Final
SPF Item Usage
SPF Item Usage Override
SPF Item Usage Final
SPF Engineering Estimated Failure Rate %
SPF Failure Rate % Calculated
SPF Failure Rate % Generation Method
SPF Failure Rate % Override
SPF Failure Rate % Final
SPF Calculated Forecast
SPF Baseline Forecast
SPF Forecast Method
SPF Forecast Override
SPF Final Forecast
For details about these series, see Service Parts Forecasting Series.
![]()
Copyright © 2010, Oracle and/or its affiliates. All rights reserved.