Release 12.1
Part Number E12169-06
Contents
Previous
Next
| Oracle E-Business Suite Integrated SOA Gateway Implementation Guide Release 12.1 Part Number E12169-06 | Contents | Previous | Next |
This chapter covers the following topics:
SOA Monitor is a centralized, light-weight service execution monitoring and management tool. It not only monitors all the Web service activities that SOA Provider and Web Service Provider process, but also provides auditing records for the service execution details if the auditing feature is enabled.
For the monitoring purpose, SOA Monitor stores basic information about a service execution for all the services such as instance ID, integration interface details, SOA header, start date, end date, status and so on. Please note that it does not store SOAP request and response payloads unless the auditing feature is turned on.
When the auditing feature is enabled, SOA Monitor then saves SOAP request and response payloads, fault messages, and attachments if they are available for an instance. This auditing feature provides additional audit trails for integration repository administrators to quickly retrieve service execution details as well as identify errors or exceptions if occur.
Important: To enable the SOA Monitor auditing feature, you must set the profile option "SOA: Web Service Audit".
In this release, SOA Monitor is a permanent monitor tool and it is enabled at all times to monitor all Web services.
Integration repository administrators can perform the following Web Service Auditing activities by using SOA Monitor:
Search SOAP requests
Monitor service request and response statuses
View service operation details
View log messages if available for an instance
Purge SOAP messages, logs, and audits
Accessing SOA Monitor
To access SOA Monitor, log on to Oracle E-Business Suite with the username that is granted with the integration repository administrator role.
Select the Integrated SOA Gateway responsibility from the navigation menu and then select SOA Monitor link from the Administration section. This opens the SOA Monitor Search page under the Administration tab.
Note: Only users with the integration repository administrator role can find the Administration section available after logging on to Oracle E-Business Suite with the Integrated SOA Gateway responsibility. All administrative tasks performed outside the Integration Repository user interface are now grouped under the Administration section and displayed in the Administration tab. These tasks include managing log setups in the Log subtab and managing SOAP requests in the SOA Monitor subtab.
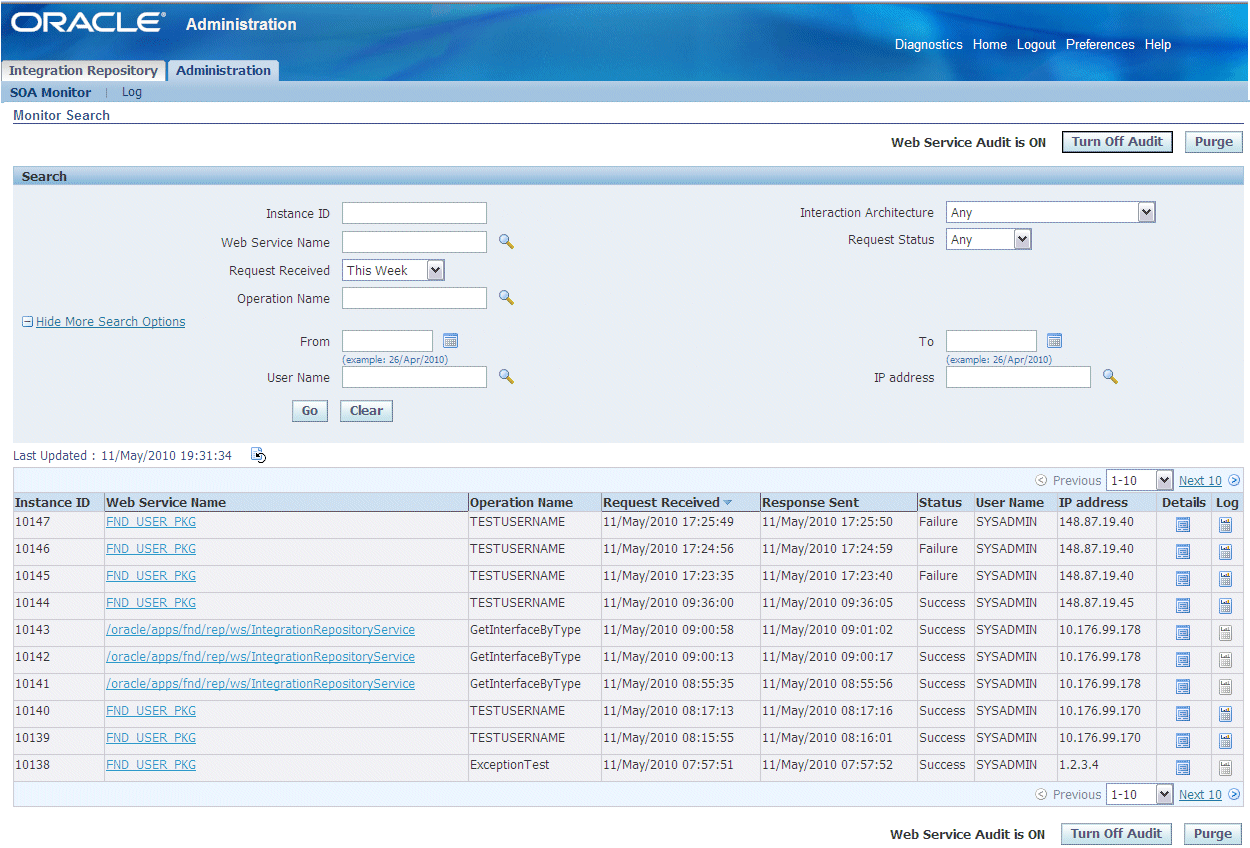
This section includes the following topics:
In the Search region, you can perform searches on SOAP requests processed through SOA Provider based on the criteria you specified.
SOA Monitor allows you to search SOAP requests by instance ID, interaction architecture, request status, Web service name, operation name, and request received time.
The Request Received time can be selected from the list of values. Its value can be 'Any Time', 'Last 2 Weeks', 'Last 30 Days', 'Last 60 Days', 'Last 90 Days', 'This Week', and 'Today'.
Note: All the list of value selections from the Request Received field will include the requests received day of Today except 'Any Time'. For example, 'This Week' means the last 7 days inclusive of today the requests have been received, and 'Last 30 Days' means the last 30 days inclusive of today the requests have been received.
'Any Time' means a blind search of requests received regardless of the Request Received date. If this field is left blank, then 'This Week' is the default value for the Request Received time.
You can optionally enter more search criteria including username, IP address, and a selected time frame for your search if clicking the Show More Search Options link in the Search region.
When the search is executed, all entries that match your search criteria will be retrieved and displayed in a tabular format. This information includes the instance ID, Web service name, operation name, date and time the request was received and responded, username, IP address, and request and response statuses.
If log messages are available for an instance, the Log icon is enabled in the result table allowing you to view the log messages.

From the search result page, you can perform the following tasks:
View status of each monitored SOAP request and response
View the service details in the Integration Repository by clicking a specific Web service name link
View SOAP request and response details by clicking the Details icon for a given SOAP request
View log message details by clicking the Log icon if they are available for an instance
See: Viewing Log Messages.
Purge SOAP requests and responses, audits, as well as log messages collected over a period of time by clicking Purge
Enable or Disable Web Service Auditing feature by clicking Turn On Audit or Turn Off Audit
The Web Service Audit feature that is currently turned on or not can be found next to the Turn On Audit or Turn Off Audit in the Search Monitor page.
To perform a search:
Log on to Oracle E-Business Suite with the username that is granted with the integration repository administrator role. Select the Integrated SOA Gateway responsibility. From the navigation menu, select the SOA Monitor link from the Administration section to open the Monitor Search page.
In the Search region, enter appropriate search criteria including instance ID, interaction architecture, request status, Web service name, operation name, and request received time for your search. Click Go to execute your search.
Optionally, enter more search criteria by clicking the Show More Search Options link to enter the following information:
From: Enter an appropriate search start date.
To: Enter an appropriate search end date.
Username: Search and select an appropriate username.
IP Address: Select an appropriate value from the list of values.
Click Go to execute your search.
All SOAP requests that match your search criteria appear.
Click the Details icon for a given instance ID to view the Request and Response details.
Click the Log icon if logs are available for a given instance ID to view log details.
Click Purge to purge SOAP requests and responses, audits, as well as log messages collected for certain period of time.
After executing a search, all SOAP messages that match your criteria will be retrieved. You can view the SOAP request and response details by clicking the Details icon for a given instance ID listed in the search result table. The Request and Response Details page appears.
SOAP Request and Response Details Page
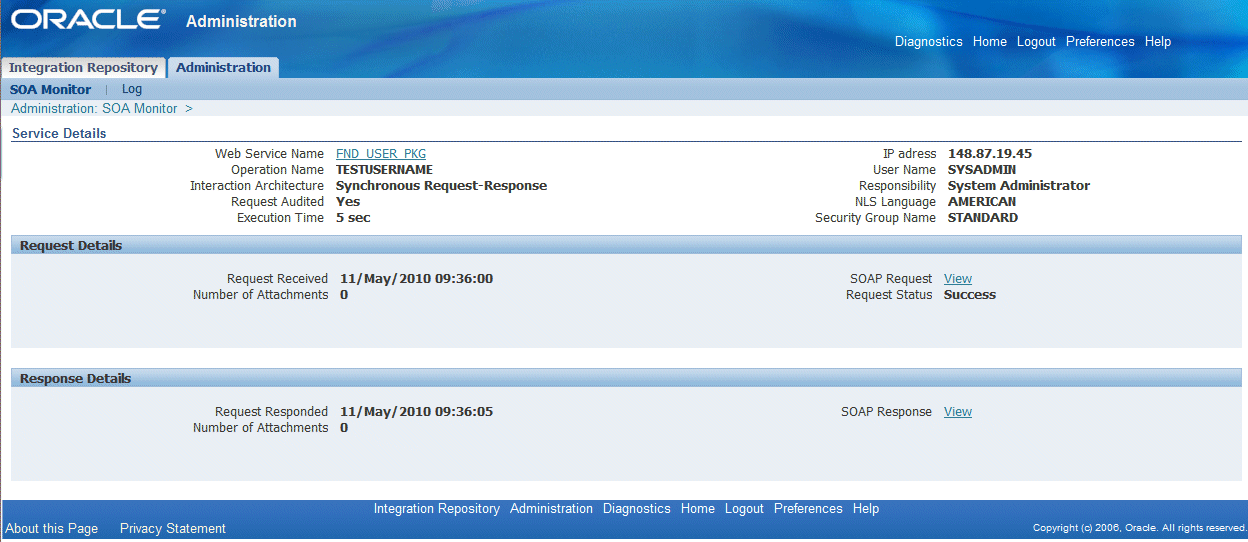
General SOAP request heading is displayed at the top of the page. This header information includes Web service name, operation name, interaction architecture, host IP address, username, responsibility, NLS language, security group name, execution time, and whether the request is audited or not.
By clicking the Web Service Name link launches the interface details page for the service in Integration Repository. This lets you view the integration interface and service in details if you want.
In addition to the general header, the following regions are displayed in the details page:
Request Details: This region contains the SOAP request received date and time, number of attachments, request status, and the SOAP request payload view link.
Clicking the SOAP Request View link if available to view the actual XML file of this request.
Note: The View link appears only if at the time of processing that request, the 'SOA: Web Service Audit' profile was turned on for enabling Web Service auditing feature. If the Web Service Auditing feature was turned off at the time of processing that request, View link will not appear. The same theory applies to process SOAP responses as well.
SOAP Request XML File
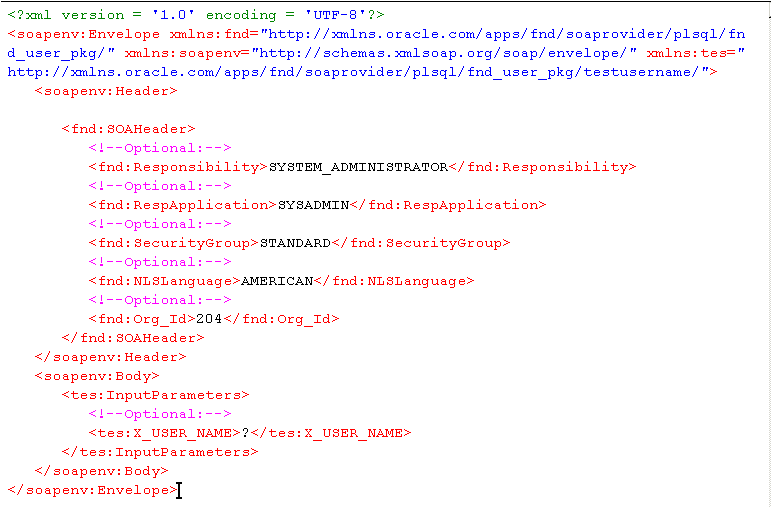
Additionally, you can find the following information displayed in the Request region if certain conditions are met:
Error Information: If the request has failure status caused by server fault, the Error Information region appears to show the error description and details.
Attachment: If the SOAP request has attachments associated with it, the Attachment region will appear to list the attachment details including all attachment names and MIME Type information.
Response Details: This region contains the SOAP request responded date and time, number of attachments, and the SOAP response view link.
Clicking the SOAP Response View link if available to view the actual XML file of this response.
Note: The View link appears only if at the time of processing that response, the 'SOA: Web Service Audit' profile was turned on for enabling Web Service auditing feature. If the Web Service Auditing feature was turned off at the time of processing that response, the View link will not appear. The same theory applies to process SOAP requests as well.
Additionally, if the Interaction Architecture is of type 'Request-Only', the View link for response payload is not shown.
To view SOAP request and response details:
Log on to Oracle E-Business Suite with the username that is granted with the integration repository administrator role. Select the Integrated SOA Gateway responsibility.
From the navigation menu, select the SOA Monitor link from the Administration section to open the Monitor Search page.
Perform a search to display search results. See: Searching SOAP Requests.
Click the Details icon for a given request to view SOAP request and response details. The Request and Response Details page appears allowing you to view the request and response details.
Click the SOAP Request or Response View link if available to view the actual XML file for the SOAP request or response message.
If there is any attachment associated with it, you can find attachment information listed in the Attachment region.
If this request status is 'Failed', then you will find the error details in the Error Information region.
To effectively monitor SOAP messages at run time during the invocation of Oracle E-Business Suite services by Web service clients, log messages can be captured in SOA Monitor against that instance for the services or operations if logging is enabled regardless of the configuration set at the user or site level.
When a SOAP request is received, SOA Provider generates a unique numeric instance ID based on a database sequence and passes it to SOA Monitor. Therefore, each SOAP request in SOA Monitor appears with instance ID and the Log icon letting you retrieve the log details.
By clicking the Log icon in the search result table if a log is available for a given instance, you can view log messages in the Log Details page.
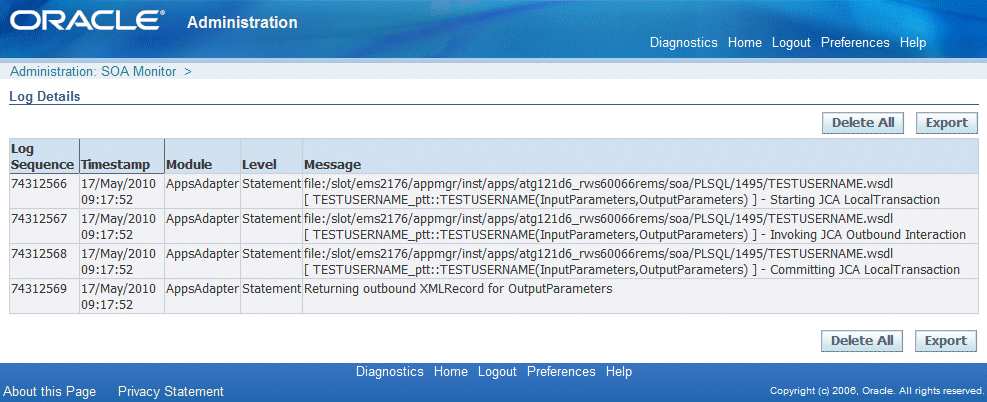
The Log Details page contains all the log messages recorded for the selected service in a given instance. These log messages are compiled and listed in the table format including log sequence, log timestamp, module, severity level, and actual message.
Deleting and Exporting Logs Listed in the Log Details Page for a Specific Instance
After viewing log messages retrieved for a request in the Log Details page for a given instance, you can delete them if needed by clicking Delete All. A warning message appears alerting you that this will permanently delete all the logs retrieved in the page. Click Yes to confirm the action. An empty log table appears in the page after logs are successfully deleted.
Before deleting the logs, you can save a backup copy by clicking Export. This allows you to export the records listed in the Log Details page to Microsoft Excel and save them to a designated directory and use it later.
For information on log severity level and how to configure logs, see Adding a New Logging Configuration.
How to view logs recorded during service generation and deployment at design time, see Viewing Generate and Deploy Time Logs.
To view log messages in SOA Monitor:
Log on to Oracle E-Business Suite with the username that is granted with the integration repository administrator role. Select the Integrated SOA Gateway responsibility.
From the navigation menu, select the SOA Monitor link from the Administration section to open the Monitor Search page.
Perform a search to display search results. See: Searching SOAP messages.
In the search result table, click the Log icon for a desired instance. The Log Details page is displayed allowing you to view the log details.
Click Delete All to delete all the logs listed in the table for a given instance if needed. Click Yes to confirm the action. Click No to return back to the Log Details page.
Click Export to export log list table to Microsoft Excel and save the records.
Oracle E-Business Suite Integrated SOA Gateway allows you to purge SOAP messages, logs, and audit records that have been collected through SOA Monitor for a period of time. Click Purge in the SOA Monitor Search page to launch a concurrent program Purge Obsolete SOA Monitor Data (FNDSOA_PURGE).
You will need to enter relevant purge parameters in the following Schedule Request windows including start and end dates before submitting the purge.
Name: The concurrent program name 'SOA Purge Audit Data' is displayed automatically. Specify the Request Name for your request. You can also change the default language setting if necessary.
Purge Schedule Request: Name Window
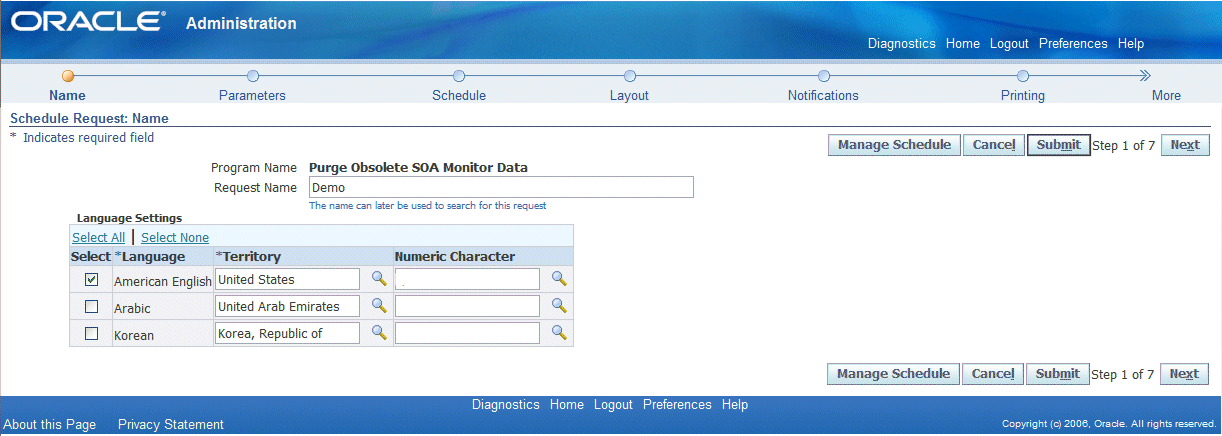
Before clicking Next to proceed to the next step, you can click Manage Schedule to open the Schedule page where you can search existing schedules or create a new schedule.
Search Existing Schedules: In the Simple Search region, enter appropriate search criteria including schedule name, application name, and created by. Click Go to execute your search.
The schedules that match your criteria will be displayed in the results table. The schedule owner or creator can update and delete the schedule that she or he created before.
Click Create to create a new schedule or click Create Like to create a schedule similar to a selected a schedule.
Create a New Schedule: Click Create to open the Schedule page allowing you to define a new schedule with schedule name and description in either one of the following options:
A simple schedule with a specific date and time, or recurring intervals if it is a recurring schedule.
An advanced schedule by clicking Advanced Schedule to specify more scheduling information, such as specific days of the week or specific dates in a month.
Note: If you do not select an end date for the more advanced schedules, the request will continue to run until it is cancelled.
Click Apply to save your record.
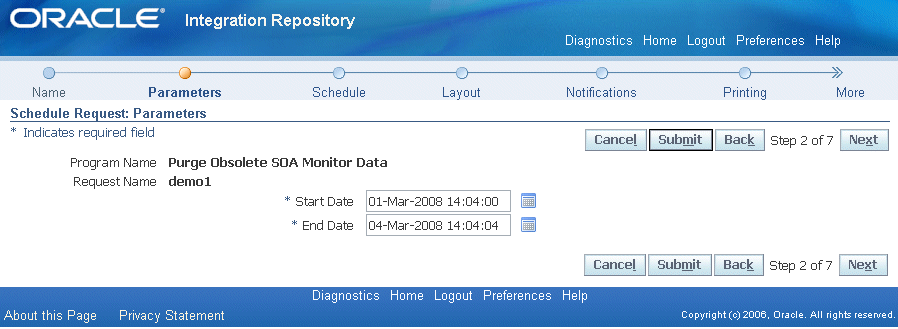
Parameters: You must enter the Start Date and End Date fields to identify the date range for your purge.
Purge Schedule Request: Parameters Window
Schedule: Specify when you would like your request to be run.
Purge Schedule Request: Schedule Window
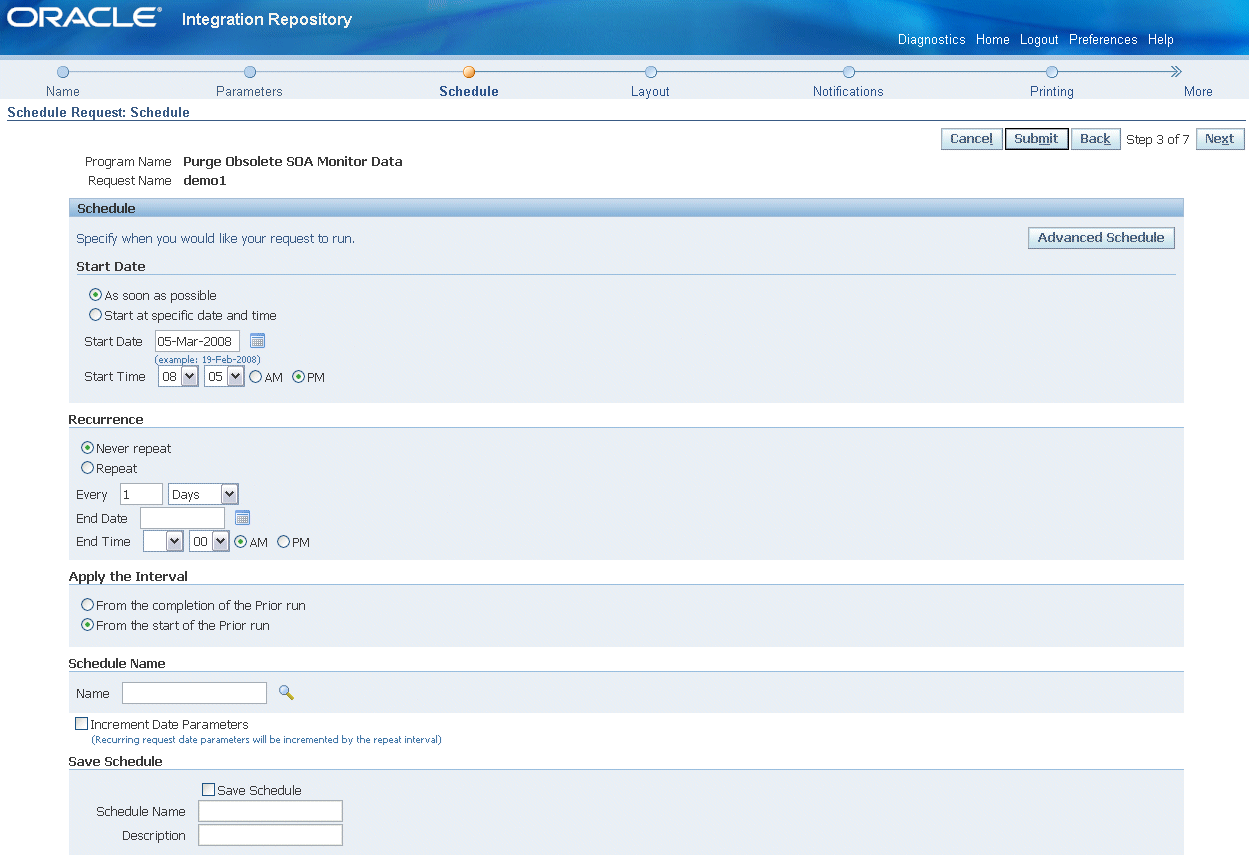
You can choose the following options:
A simple schedule such as, as soon as possible, a specific date and time, or recurring intervals if it is a recurring schedule.
An advanced schedule by clicking Advanced Schedule to specify more scheduling information, such as specific days of the week or specific dates in a month. You can also choose a previously saved schedule.
Note: If you do not select an end date for the more advanced schedules, the request will continue to run until it is cancelled.
Click the Increment Date Parameters check box to make the selected schedule become repeatable with the recurrence intervals specified in the Recurrence region.
Instead of creating a new schedule by default, you can use a previously saved schedule by clicking the Saved Schedule radio button on the top of the Schedule page. A new page is displayed letting you specify a desired schedule name in the Name field. The selected schedule details will be populated automatically.
Layout: This allows you to select layout based on a template. You can also specify the output format for your request.
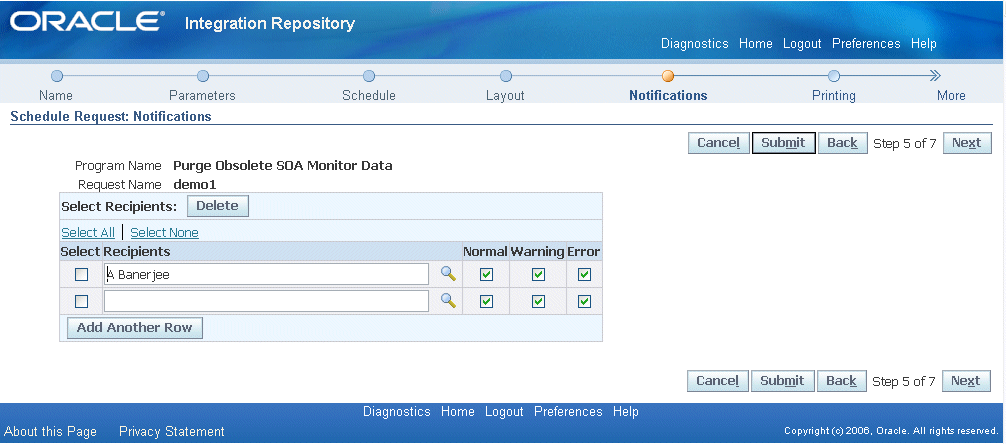
Notifications: Select the employee name from the list of available employees, and then choose the circumstance of when to notify this employee. This option sends an e-mail notification with a link to the request, based on if the request ran normally or resulted in a warning or error.
Purge Schedule Request: Notifications Window
Printing: For printed output, select the printer, copies, and print style.
Preview: This allows you to preview all your parameter selection for the purge request.
Once you submit the purge request, a concurrent request number is automatically assigned. Your request will be executed based on your selected schedule to purge all SOAP requests during your specified date range.
The monitored SOAP requests and responses stored in the following tables will be purged in the following order of sequence:
Purging FND_SOA_REQUEST
This deletes all SOAP requests for the specified date range.
Purging FND_SOA_BODY_PIECE
This deletes the SOAP body pieces including payload corresponding to those SOAP requests that have been purged (for the specified date range).
Purging FND_SOA_ATTACHMENT
This deletes all attachments associated with the SOAP requests and responses for the specified date range.
Purging FND_LOG_MESSAGES
This deletes only the logs for which the service is completed with a status of 'SUCCESS'. This does not delete the logs for the service with 'FAILURE' status.
The purge is based on the Completion Date of the service for the specified date range.
To purge SOAP requests and responses:
Log on to Oracle E-Business Suite with the username that is granted with the integration repository administrator role. Select the Integrated SOA Gateway responsibility.
From the navigation menu, select the SOA Monitor link from the Administration section to open the Monitor Search page.
Click Purge to launch a concurrent program.
Enter the following information in the Schedule Request window:
The current program name SOA Purge Audit Data is displayed in the Program Name field. You can specify the request name for your purge request.
Click Next.
Enter the Start Date and End Date fields to specify the time range for your purge. Click Next.
Enter appropriate information for the Schedule window. Click Next.
Specify notification information by selecting employee names and the circumstances when the notifications will be sent. Click Next.
Leave the default printing information unchanged if you do not want it to be printed. Click Next
Preview your purge request selection.
Click Submit to submit your purge request.
A request number will be automatically assigned to you for your purge request indicating your request has been submitted for processing.
In addition to monitoring and providing run-time status of all service execution activities, SOA Monitor provides auditing feature allowing you to track SOAP message details such as requests, responses, faults, and so on.
If this auditing feature is enabled, then all incoming SOAP requests and corresponding responses that SOA Provider receives as well as the associated payloads and fault messages can be saved in SOA Monitor for auditing needs.
In addition to setting the profile option, integration repository administrators can enable or disable the feature directly in the SOA Monitor UI. By clicking Turn On Audit or Turn Off Audit in the Monitor Search page will override the 'SOA: Web Service Audit' profile value to enable or disable the feature.
The Web Services Audit is ON or OFF information appears indicating the feature is enabled or disabled.

To enable or disable the Web Service Auditing feature:
Log on to Oracle E-Business Suite with the username that is granted with the integration repository administrator role. Select the Integrated SOA Gateway responsibility.
From the navigation menu, select the SOA Monitor link from the Administration section to open the Monitor Search page.
Click Turn On Audit or Turn Off Audit in the Monitor Search page to enable or disable the feature.
The Web Services Audit is ON or OFF information appears indicating the feature is enabled or disabled.
![]()
Copyright © 2008, 2010, Oracle and/or its affiliates. All rights reserved.