Release 12.1 V5
Part Number E37993-08
Contents
Previous
Next
| Oracle E-Business Suite Extensions for Oracle Endeca Integration and System Administration Guide Release 12.1 V5 Part Number E37993-08 | Contents | Previous | Next |
This chapter covers the following topics:
You can use Oracle Inventory Management Extensions for Oracle Endeca to quickly search, filter, and compare item information across organizations and related entities. Using the Inventory Management Endeca pages, you can review and analyze data using Key Performance Indicators (KPIs), performance evaluation metrics, charts, graphs, and tables.
You can search using Inventory Management pages and Endeca Information Discovery (EID) design tools. These pages are hosted in an EID environment, and called from new container pages in EBS. In Oracle Inventory Management, the following pages enable search functions using Endeca Information Discovery integration:
Item Information Discovery Page: The Item Information Discovery page displays several regions and components with enhanced navigation that enables you to search, filter, and compare item information.
Plan Fulfillment Page: You can use the Plan Fulfillment page to plan fulfillment batches and view unfulfilled details including late, early, on time, and so on. You can also view details and order lines that do not have adequate on-hand inventory and take appropriate actions such as updating or deleting the reservation, and release a picking batch.
Track Fulfillment Page: You can use the Track Fulfillment page to track the fulfillment process and react in real time to changes impacting the delivery activities. You can monitor for delivery exceptions, holds and interface activity, and take appropriate actions to expedite the fulfillment.
Space Utilization Page: You can use the Space Utilization page to track fragmentation and take appropriate actions to consolidate material within Inventory. You can also find velocity mismatch with respect to transaction counts and quantities, and take appropriate actions to consolidate the material within Inventory.
This chapter provides product-specific details required to integrate Endeca Information Discovery (EID) with Oracle E-Business Suite Release 12.1 V5 for the Oracle Inventory Management Extensions for Oracle Endeca application. This supplements the information provided in Installing Oracle E-Business Suite Extensions for Oracle Endeca, Release 12.1 V5 (Doc ID: 1683053.1). You must read this document and make note of the requirements before you begin your installation.
Note: Oracle Endeca Item Information Discovery is not supported for Oracle Product Hub.
The Item Information Discovery page displays several regions and components with enhanced navigation. The following graphic displays a view of the Endeca Item Information Discovery page.
From the Inventory responsibility, navigate to the Item Information Discovery page:
(N) Inventory responsibility > Items > Item Information Discovery
From the Item Manager responsibility, navigate to the Item Information Discovery page:
(N) Item Manager > Item Catalog > Item Information Discovery
Note: You can also navigate to the Endeca Item Information Discovery page from the work orders results table in the Endeca Discrete Work Order Search page using Endeca Deep Linking.
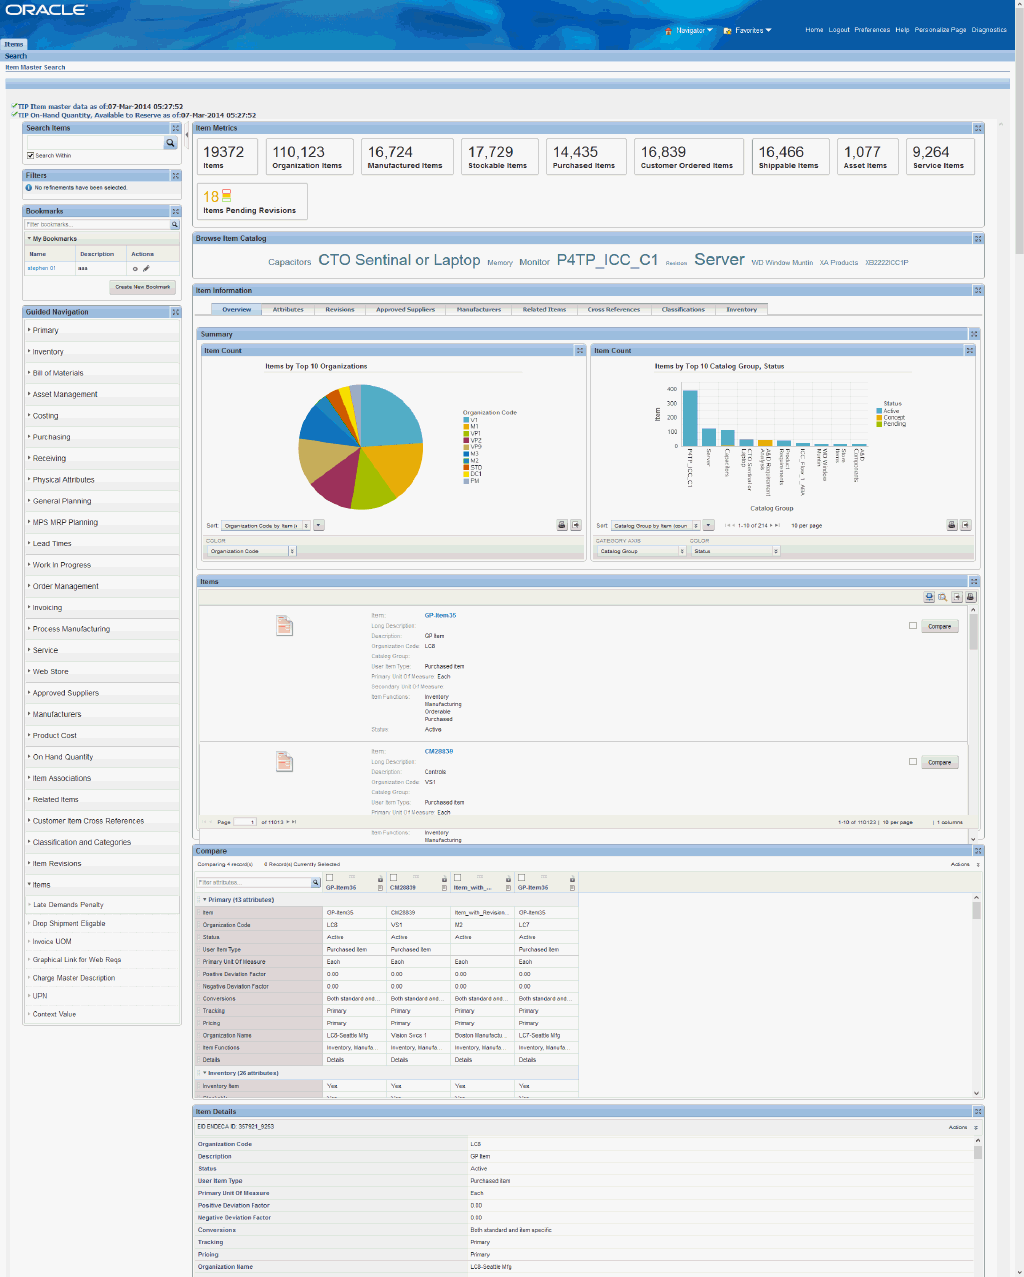
Within the Endeca Item Information Discovery page, you can search and filter item information. You can analyze the data and review item metrics, charts, graphs, and tables. The following describes the Endeca Item Information Discovery page regions and components:
| Region | Components |
|---|---|
| Guided navigation | You can use the Guided Navigation component to filter data using attribute groups. Expand the following list of attribute groups to view and select attribute names. You can also view 'Items' Descriptive Flexfield values from Guided Navigation.
|
| Item Metrics (metrics bar) |
|
| Browse Item Catalog (tag cloud component) | Top Ten Items Tag Cloud Component
Note: The Browse Item Catalog tag cloud component displays the top ten items by frequency of occurrence. |
| Item Information (tabbed component container) Overview (tab) | Item Count (pie chart)
Item Count (bar chart)
Items (Results List)
|
| Item Information (tabbed component container) Attributes (tab) |
|
| Item Information (tabbed component container) Revisions (tab) |
|
| Item Information (tabbed component container) Approved Suppliers (tab) |
|
| Item Information (tabbed component container) Manufacturers (tab) |
|
| Item Information (tabbed component container) Related Items (tab) |
|
| Item Information (tabbed component container) Cross References (tab) |
|
| Item Information (tabbed component container) Classifications (tab) |
|
| Item Information (tabbed component container) Inventory (tab) |
|
| Compare | To view a side-by-side comparison of item attributes, you must select two or more items.
|
The Plan Fulfillment page lets you plan fulfillment batches and view unfulfilled details including late, early, on time, and so on. You can also view details and order lines that do not have adequate on-hand inventory and take appropriate actions such as updating or deleting the reservation, and release a picking batch. You can view delivery logistics metrics, charts, and results tables. The following displays the Plan Fulfillment page.
From the Inventory responsibility, navigate to the Plan Fulfillment page:
(N) Order Management > Shipping > Plan Fulfillment
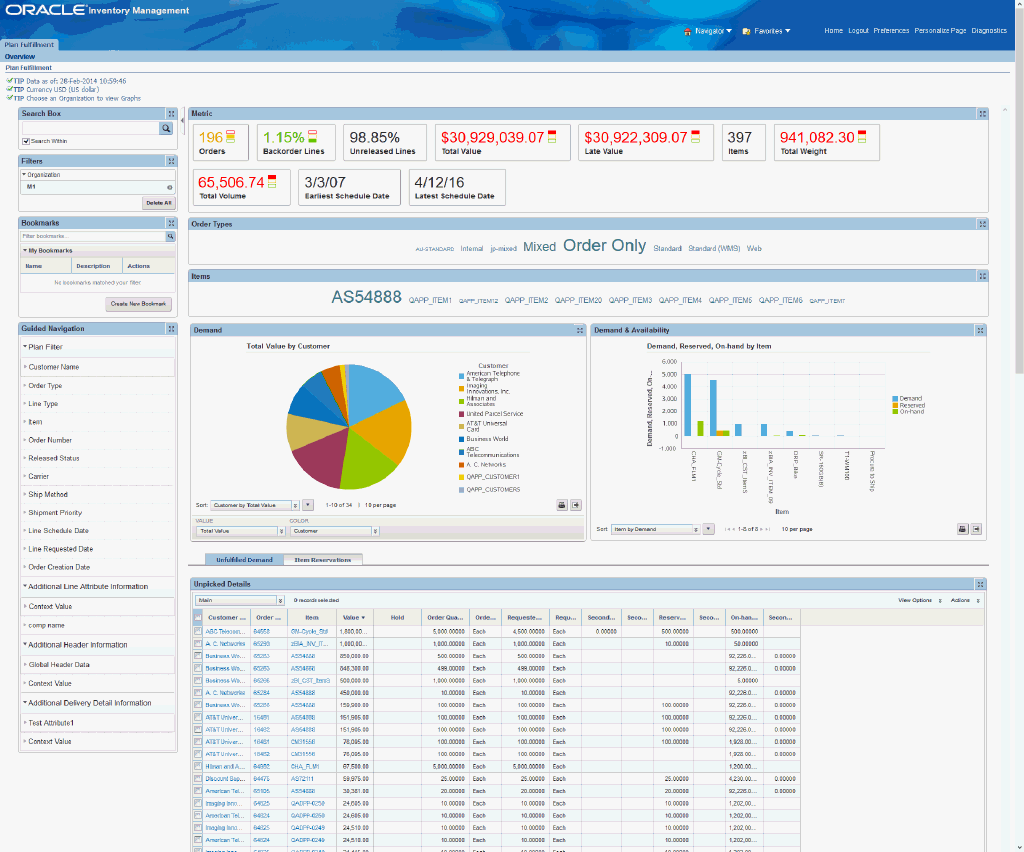
The following describes the Endeca Inventory Management Plan Fulfillment page regions and components:
| Region | Components |
|---|---|
| Range Filters | You can use Range Filters to refine the displayed data to only include records that have attribute values within a specified range. |
| Guided Navigation | You can use the Guided Navigation component to filter data using the following attributes:
|
| Metric (metrics bar)
Note: The Metric Components are color coded to highlight warnings and health. |
|
| Order Types (tag cloud) | Top Ten Order Types Tag Cloud Component
Note: The Order Types tag cloud component displays the top ten Order Types by frequency of occurrence. |
| Items (tag cloud) | Top Ten Items Tag Cloud Component
Note: The Items tag cloud component displays the top ten items by frequency of occurrence. |
| Demand (chart) | Total Value by Customer (chart)
|
| Demand & Availability (chart) | Demand, Reserved, On-hand by Item
|
| Unfulfilled Demand (tabbed component container)
Note: This results table displays relevant attributes for sales order demand and availability. | Unpicked Details (results table)
|
| Item Reservations (tabbed component container) | Item Reservations (results table)
|
The Track Fulfillment page lets you track the fulfillment process and react in real time to changes impacting the delivery activities. You can monitor for delivery exceptions, holds and interface activity, and take appropriate actions to expedite the fulfillment. You can view delivery logistics metrics, charts, and results tables. The following displays the Track Fulfillment page.
From the Inventory responsibility, navigate to the Track Fulfillment page:
(N) Order Management > Shipping > Track Fulfillment
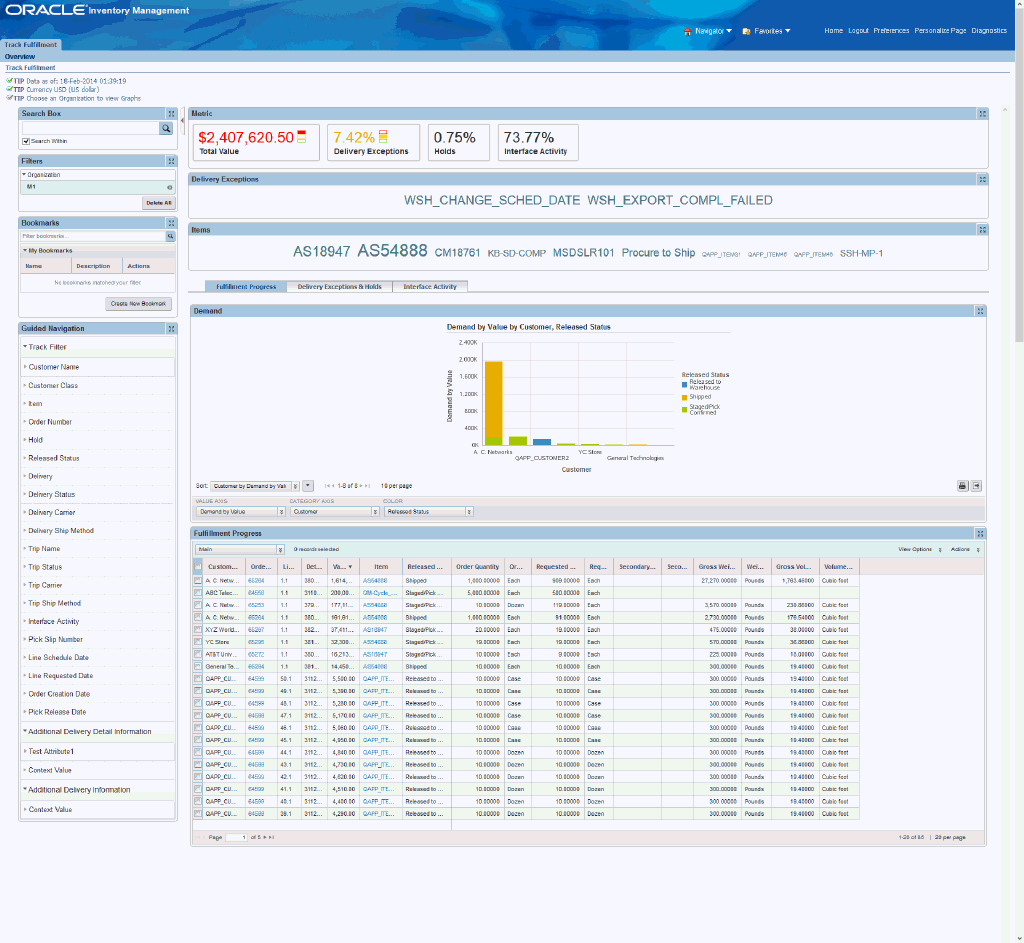
The following describes the Endeca Inventory Management Track Fulfillment page regions and components:
| Region | Components |
|---|---|
| Range Filters | You can use Range Filters to refine the displayed data to only include records that have attribute values within a specified range. |
| Guided Navigation | You can use the Guided Navigation component to filter data using the following attributes:
|
| Metric (metrics bar)
Note: The Metric Components are color coded to highlight warnings and health. |
|
| Delivery Exceptions (tag cloud) | Top Ten Delivery Exceptions Tag Cloud Component
Note: The Delivery Exceptions tag cloud component displays the top ten Delivery Exceptions by frequency of occurrence. |
| Items (tag cloud) | Top Ten Items Tag Cloud Component
Note: The Items tag cloud component displays the top ten items by frequency of occurrence. |
| Fulfillment Progress (tabbed component container) | Demand (chart) Demand by Value by Customer, Released Status
Fulfillment Progress (results table) Note: The Fulfillment Progress results table component displays the data related to in progress lines and tasks.
|
| Delivery Exceptions and Holds (tabbed component container) | Delivery Exceptions (chart) Exceptions by Value by Exception Name, Delivery Name
Delivery Exceptions (results table) Note: The Delivery Exceptions results table component displays the data related to in-progress lines.
Holds (chart) Holds by Value by Customer, Delivery Name
Holds (results table) Note: The Holds results table component displays the data related to in-progress lines.
|
| Interface Activity (tabbed component container) | Interface Activity (chart) Exceptions by Value by Customer, Delivery Name Note: This chart shows interface activity by sale value in appropriate currency.
Interface Activity (results table) Note: The Interface Activity results table component displays the data related to in-progress lines and tasks.
|
The Space Utilization page lets you track fragmentation and take appropriate actions to consolidate material within Inventory. You can also find velocity mismatch with respect to transaction counts and quantities, and take appropriate actions to consolidate the material within Inventory. You can view inventory metrics, charts, and results tables. The following displays the Space Utilization page.
From the Inventory responsibility, navigate to the Space Utilization page:
(N) Inventory Management > Space Utilization
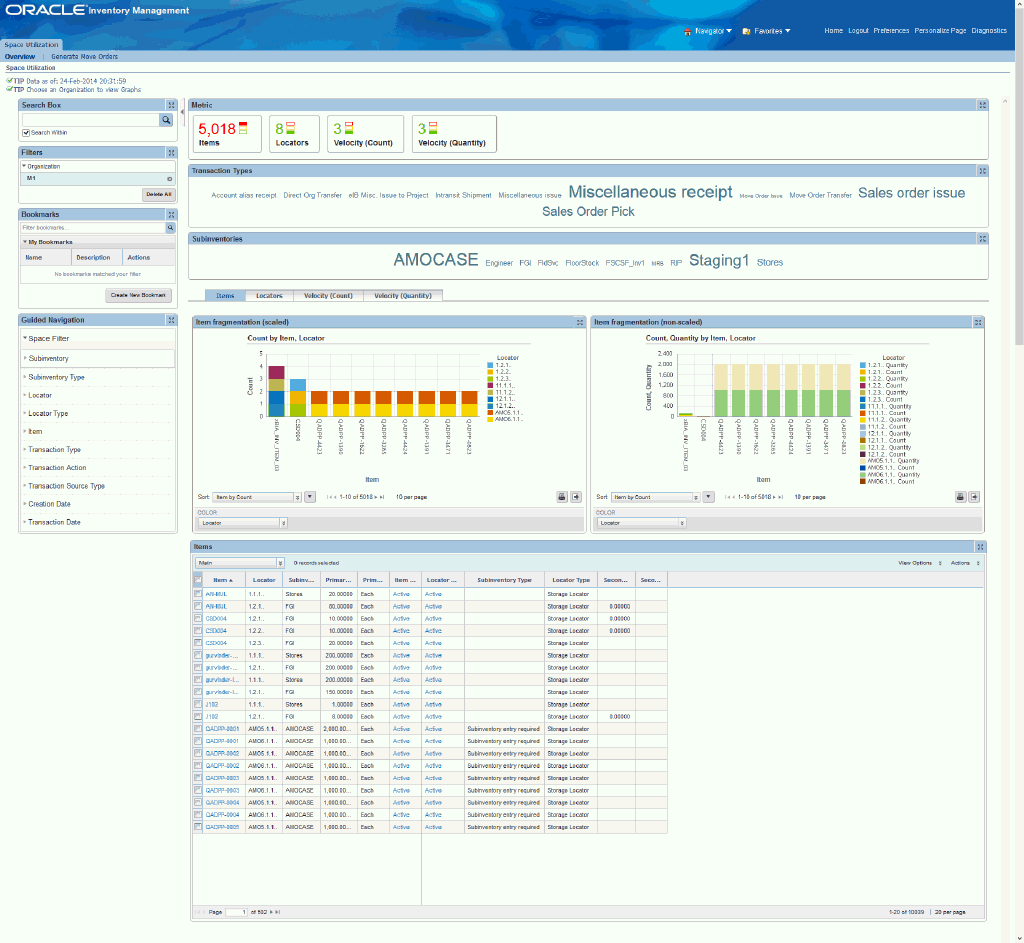
The following describes the Endeca Inventory Management Space Utilization page regions and components:
| Region | Components |
|---|---|
| Sub Tabs (page links) |
|
| Range Filters | You can use Range Filters to refine the displayed data to only include records that have attribute values within a specified range. |
| Guided Navigation | You can use the Guided Navigation component to filter data using the following attributes:
|
| Metric (metrics bar)
Note: The Metric Components are color coded to highlight warnings and health. |
|
| Transaction Types (tag cloud) | Top Ten Transaction Types Tag Cloud Component
Note: The Transaction Types tag cloud component displays the top ten Transaction Types by frequency of occurrence. |
| Subinventories (tag cloud) | Top Ten Subinventories Tag Cloud Component
Note: The Subinventories tag cloud component displays the top ten Subinventories by frequency of occurrence. |
| Items (tabbed component container) | Item fragmentation (scaled) Count by Item, Locator (chart) Note: This chart displays item fragmentation without highlighting the quantity of each item in a locator. For example, each bar represents the item and each stack represents the locators in which this item exists.
Item fragmentation (non scaled) Count, Quantity by Item, Locator (chart) Note: This chart displays item fragmentation and highlights the quantity of each item in a locator. For example, each bar represents the item and each stack represents the quantity of this item in that locator.
Items (results table) Note: The Items results table component displays the data related to item fragmentation.
|
| Locators (tabbed component container) | Locator fragmentation (scaled) Count by Locator, Item (chart) Note: This chart displays locator fragmentation without highlighting the quantity of each item in a locator, For Example, each bar represents a locator and each stack represents the items in the locator.
Locator fragmentation (non-scaled) Count, Quantity by Locator, Item (chart) Note: This chart displays locator fragmentation and highlights the quantity of each item in a locator. For example, each bar represents the locator and each stack represents the quantity of an item in that locator.
Locators (results table) Note: The Locators results table component displays the data related to locator fragmentation.
|
| Velocity (Count) (tabbed component container) | Item Velocity (Top 1000) Count by Item, Locator (chart) Note: This chart displays item velocity by locator. The metric for the graphs is 'transaction count (sum)'/'transaction quantity (sum).
Locator Velocity (Top 1000) Count by Locator, Row (chart) Note: This chart displays locator velocity. The metric for this graph is 'transaction count (sum)'.
Mismatch Distinct Items by Locator, Item (chart) Note: This chart displays lot fragmentation and highlights the locators that hold items where item velocity does not match locator velocity.
Items (results table) Note: The Items results table component displays the data related to velocity fragmentation.
|
| Velocity (Quantity) (tabbed component container) | Item Velocity (Top 1000) Quantity by Item, Locator (chart) Note: This chart displays item velocity by locator. The metric for the graphs is 'transaction count (sum)'/'transaction quantity (sum).
Locator Velocity (Top 1000) Count by Locator, Row (chart) Note: This chart displays locator velocity. The metric for this graph is 'transaction count (sum)'.
Mismatch Quantity by Locator, Item (chart) Note: This chart displays lot fragmentation and highlights the locators that hold items where item velocity does not match locator velocity.
Items (results table) Note: The Items results table component displays the data related to velocity fragmentation.
|
This section provides product-specific details required to integrate Endeca Information Discovery (EID) with Oracle E-Business Suite Release 12.1 V5 for the Oracle Inventory Management Extensions for Oracle Endeca application. This supplements the information provided in Installing Oracle E-Business Suite Extensions for Oracle Endeca, Release 12.1 V5 (Doc ID: 1683053.1). You must read this document and make note of the requirements before you begin your installation.
To set up Oracle Inventory Management Extensions for Oracle Endeca, you must complete the following steps:
Set Access Control by assigning UMX roles and updating access grants.
Schedule Setup and Load Item Master data by running graphs provided by Inventory.
Upload User-Configurable Attributes for Endeca Configuration.
As part of the Oracle E-Business Suite-EID integration for Oracle Inventory Management, the following UMX Roles, Permission Sets, and Grants are provided:
| Role | Internal Code Name |
|---|---|
| INV Endeca Item Discoverer | UMX|INV_ENDECA_ITEM_DISCOVERER |
| INV Plan Fulfillment Endeca Access Role | UMX|INV_PF_ENDECA_ACCESS_ROLE |
| INV Track Fulfillment Endeca Access Role | UMX|INV_TF_ENDECA_ACCESS_ROLE |
| INV Space Utilization Endeca Access Role | UMX|INV_SU_ENDECA_ACCESS_ROLE |
You must add the UMX roles to enable Endeca menus for the Inventory and Item Manager responsibilities (or any other custom responsibility which is using the same menu). You must assign these UMX roles to the responsibility.
| Permission Sets | Internal Code Name |
|---|---|
| Item Endeca Menu | INV_ITEM_ENDECA_MENU |
| INV Plan Fulfillment Endeca Access Permission Set | INV_PF_ENDECA_ACCESS_PS |
| INV Track Fulfillment Endeca Access Permission Set | INV_TF_ENDECA_ACCESS_PS |
| INV Space Utilization Endeca Access Permission Set | INV_SU_ENDECA_ACCESS_PS |
| Grants | Internal Code Name |
|---|---|
| INV Plan Fulfillment Endeca Access Grant | INV_PF_ENDECA_ACCESS_GRANT |
| INV Track Fulfillment Endeca Access Grant | INV_TF_ENDECA_ACCESS_GRANT |
| INV Space Utilization Endeca Access Grant | INV_SU_ENDECA_ACCESS_GRANT |
To enable Endeca menus and access through a responsibility other than ‘Inventory’ or ‘Item Manager', complete the following steps
At the responsibility level menu, add a prompt-less menu entry for ‘ITEM ENDECA MENU’ with the GRANT checkbox unchecked.
![]()
Add an additional menu entry with the prompt ‘Endeca Item Search’ for function, and ‘Item Endeca Search page’ with the GRANT checkbox un-checked.
![]()
You must add the UMX role 'INV Endeca Item Discoverer' (Internal Code Name: UMX|INV_ENDECA_ ITEM_DISCOVERER) to enable Endeca menus for any custom responsibility which is using the same menu. You must assign this UMX role to the responsibility.
If you need to drill down to the OAF Item Overview page from Endeca, then one additional prompt-less entry for ‘EGO User Item Workbench Menu’ is required. You must select the GRANT checkbox here.

You must complete the following steps to enable Endeca Menus in Oracle E-Business Suite (EBS):
Assign UMX Roles to the Responsibility.
Oracle recommends that you make a duplicate of INV_ENDECA_ACCESS_GRANT and assign a UMX role to the responsibility through this new grant. This is a recommended practice.
Note: For assigning UMX roles and grants, refer to Installing Oracle E-Business Suite Extensions for Oracle Endeca, Release 12.1 V5 (Doc ID: 1683053.1).
The initial data upload for Endeca Search is complete when the Full graph is run as described in Installing Oracle E-Business Suite Extensions for Oracle Endeca, Release 12.1 V5 (Doc ID: 1683053.1). Full refresh deletes all data from Endeca and repopulates it with a full data extract from the E-Business Suite system. For incremental refresh, you should determine how often the Endeca data should be refreshed from E-Business Suite depending on your organizational requirements.
To schedule ETL on the Integrator Server
Login to Integrator server using your Clover login.
Click the Scheduling tab.
Select the New Schedule link.
Enter a Description for the scheduler.
Select Periodic as the Type.
Select by interval as the Periodicity.
Enter a start date and time in the Not active before date/time field.
Enter an end date and time in the Not active after date/time field.
Enter a value in the Interval (minutes) field.
Ensure you select the Fire misfired event as soon as possible check box.
Select Start a graph from the Task Type list.
Select the graph 'inv-item'.
Click Create to set the scheduler.
You can load data to the Item Master data store by running the following graphs provided by Inventory Management.
To load data to the ItemMaster data store
Using the URL for the EID Integrator Server, navigate to the Sandboxes page and expand the graph node under inv-item.
Graphs to load data include:
FullLoadConfig.grf: This graph loads all Item Master data to the data store. You should run this graph as the first graph for Item data load after the where clause in workspace is modified to restrict Item organization(s).
Note: If you are loading data for the first time, then run FullLoadConfig.grf only. You can run other graphs according to your requirements. Run IncrementalLoadConfig.grf periodically. You can set up this graph from the Scheduling tab.
LoadAdditionalOrgItems.grf: This graph provides split load capability (split by organizations) of Full Load and Full refresh for high volume customers.
IncrementalLoadConfig.grf: This graph detects the changes (insert/update) since the last Full Load/Incremental Load and loads incrementally changed data into the Endeca data store.
Note: Data deleted in EBS Inventory Management will not be removed from Endeca by running the Incremental Load Graph. You must run the FullLoadConfig.grf graph to remove all data from Endeca and reload everything.
LoadOnHandQtyFullConfig.grf: This graph fully refreshes the on-hand and available-to-reserve for all stock-able items loaded into the inv-item Endeca data store.
LoadOnhandQtyIncrConfig.grf: This graph detects the changes (insert/update) in on-hand and available-to-reserve for all stock-able items loaded into Endeca Data store.
This graph cannot detect cases where the entire quantity from a sub-inventory is transacted because history is not maintained in the underlying tables. For those cases, run the LoadOnHandQtyFullConfig.grf graph.
Plan Fulfillment, Track Fulfillment and Space Utilization pages use three individual ETL sandboxes named invpfetl.zip, invtfetl.zip, and invsuetl.zip shared between Inventory and WMS. Each file contains Full load and Incremental graphs specific to the data domain as follows:
FullLoadConfig.grf: Full Load
IncrLoadConfig.grf: Incremental Load
Note: Read all contents of workspace.prm in sandbox inv-item while designing your dataload runs.
Restricting Data Loaded Into the Endeca Data Store Based on Organizations and Subinventories
The lookup 'Organization Control For WMS and INV Endeca Extensions' restricts data being loaded to the Endeca data store based on Organization in the Plan Fulfillment, Track Fulfillment, and Space Utilization pages. The lookup is seeded with 'ALL' as the default lookup code to load data for all Inventory Organizations. If there is a requirement not to load data for all Inventory Organizations, then disable the default lookup code 'ALL and add the lookup code value 'Organization Code'.
The lookup 'Subinventory Control For WMS and INV Endeca Extensions' restricts data being loaded to the Endeca data store based on Subinventories in the Space Utilization page. The lookup is seeded with 'ALL' as the default lookup code to load data for all Subinventories. If there is a requirement not to load data for all Subinventories, then disable the default lookup code 'ALL' and add the lookup code value 'Organization Code' or 'Subinventory Code'.
Before the Full graph is run as described in Installing Oracle E-Business Suite Extensions for Oracle Endeca, Release 12.1 V5 (Doc ID: 1683053.1), attribute configuration must be loaded and include all seeded attributes as well as user configured custom attributes. The Endeca attribute configuration for the seeded attributes is provided in the inveidattrs.ldt file (for attribute definitions), and the inveidgrps.ldt file (for attribute group definitions). For the user configured custom attributes, you must modify the ldt files appropriately and upload using FNDLOAD.
Note: This is meta-data. At present, meta-data can be loaded only during full load run (FullLoadConfig.grf ). Incremental run (IncrementalLoadConfig.grf) cannot detect any new meta-data, or change to meta-data.
User-configurable attributes include:
Catalog Groups and Descriptive Elements
Category Sets and Categories
Related Item - Relationship Types
Item Cross Reference Types
To add a Purchasing custom category to Endeca configuration
Open the seeded Endeca attributes inveidattrs.ldt file in a text editor.
Following a similar structure to inveidattrs.ldt, create an additional custom ldt for user configurable attributes. For example, you can create a 'inveidatts_cust' ldt. If Purchasing is the custom attribute you are defining, then insert a section as follows:
BEGIN FND_EID_PDR_ATTRS "11" "Purchasing"
  	ENDECA_DATATYPE = "mdex:string"
  	EID_ATTR_PROFILE_ID = "1"
  	EID_RELEASE_VERSION = "3.0"
  	ATTRIBUTE_SOURCE = "<Company Name>"
  	MANAGED_ATTRIBUTE_FLAG = "N"
  	HIERARCHICAL_MGD_ATTR_FLAG = "N"
  	DIM_ENABLE_REFINEMENTS_FLAG = "N"
  	DIM_SEARCH_HIERARCHICAL_FLAG = "N"
  	REC_SEARCH_HIERARCHICAL_FLAG = "N"
  	MGD_ATTR_EID_RELEASE_VERSION = "N"
  	OBSOLETED_FLAG = "N"
  	OBSOLETED_EID_RELEASE_VERSION = "0"
  	DISPLAY_NAME = "Purchasing"
  	ATTRIBUTE_DESC = "Purchasing"
  	USER_DISPLAY_NAME = "Purchasing"
  	USER_ATTRIBUTE_DESC = "Purchasing"
  	LAST_UPDATE_DATE = "2012/07/10"
  	APPLICATION_SHORT_NAME = "INV"
  	OWNER = "ORACLE12.1.3"\u0009
	END FND_EID_PDR_ATTRS
Note:
'Purchasing' in the first line is the internal name for the attribute. This can accept only the following characters: A to Z, a to z, and 0 to 9.
DISPLAY_NAME, ATTRIBUTE_DESC, USER_DISPLAY_NAME, and USER_ATTRIBUTE_DESC values can be the same as what you use.
EID_ATTR_PROFILE_ID = "1" defines the search level during Endeca Search. Value of '1' enables Record Count, Value Search, and Text Search. If all attributes have this value, then Endeca search performance may be slow. Evaluate and assign proper values. For more information, refer to E-Business Suite and Endeca Information Discovery documentation.
LAST UPDATE DATE should be in format YYYY/MM/DD.
The seeded Endeca attributes inveidattrs.ldt file should now appear as:

Save and Close.
Open the seeded Endeca attributes group inveidgrps.ldt file in a text Editor.
Create a file similar to the following structure and name it "inveidgrps_custom". If Purchasing is the custom attribute you are defining, then insert a section as follows:
BEGIN FND_EID_ATTR_GROUPS "11" "Categories" "Purchasing"
		GROUP_ATTRIBUTE_SOURCE = "ORACLE"
		EID_RELEASE_VERSION = "3.0"
		OBSOLETED_FLAG = "N"
		OBSOLETED_EID_RELEASE_VERSION = "0"
		LAST_UPDATE_DATE = "2012/07/10"
		APPLICATION_SHORT_NAME = "INV"
		OWNER = "<Company Name>"
	END FND_EID_ATTR_GROUPS
The seeded Attribute Groups that you must use include:
Catalog Groups and Descriptive Elements (Attribute Group: CatalogGroup)
Category Sets and Categories (Attribute Group: Categories)
Related Item – Relationship Types (Attribute Group: ItemRelationships)
Item Cross Reference Types (Attribute Group: ItemCrossReferences)
The seeded Endeca attributes inveidgrps.ldt file should now appear as:

Save and Close.
Use FNDLOAD to upload the modified ldt files.
Oracle Inventory Management integration includes the following user menu functions:
| User Function Name | Function Name |
|---|---|
| Item Endeca Menu | INV_ITEM_ENDECA_MENU |
| Item Search Home Page | INV_ENDECA_ITEM_SEARCH_HOMEPG |
| Plan Fulfillment | INV_PLAN_FULFILLMENT |
| Track Fulfillment | INV_TRACK_FULFILLMENT |
| Space Utilization | INV_SPACE_UTILIZATION |
| Manufacturing and Distribution Manager - Endeca Plan Fulfillment Menu | INV_ENDECA_HOME_PF |
| Manufacturing and Distribution Manager - Endeca Track Fulfillment Menu | INV_ENDECA_HOME_TF |
| Manufacturing and Distribution Manager - Endeca Space Utilization Menu | INV_ENDECA_HOME_SU |
| Inventory | INV_NAVIGATE |
The following views are used by the ETL layer in Endeca to load Oracle Item Master data to the Endeca data store:
| View Name | Purpose |
|---|---|
| MTL_ITEM_ENDECA_GRAIN_V | Denormalized view of mtl_system_items_b_kfv and its (other than below mentioned entities) child entity details |
| MTL_ITEM_ENDECA_GRAIN_INCR_V | Denormalized view of mtl_system_items_b_kfv and its (other than below mentioned entities) child entity details. (Incremental) |
| MTL_ITEM_ENDECA_CROSS_REF_V | View built on mtl_cross_references_vl, mtl_system_items_b_kfv |
| MTL_ITEM_ENDECA_CATEGORIES_V | View built on mtl_category_sets, mtl_item_categories , mtl_system_items_b_kfv |
| MTL_ITEM_ENDECA_REL_ITEMS_V | View built on mtl_related_items_view and mtl_system_items_b_kfv |
| MTL_ITEM_ENDECA_REL_ITEMS_IV1 | View built on mtl_related_items(Incremental) |
| MTL_ITEM_ENDECA_REL_ITEMS_IV2 | View built on mtl_related_items(Incremental) |
| MTL_ITEM_ENDECA_DESC_ELEM_V | View built on mtl_descr_element_values_v, mtl_system_items_b_kfv |
| MTL_ITEM_ENDECA_SUPPLIERS_V | View to get Supplier Sites associated to item-org rows present in mtl_system_items_b_kfv |
| MTL_ITEM_ENDECA_CUSTOMERS_V | View built on MTL_CUSTOMER_ITEM_XREFS_V |
| MTL_ITEM_ENDECA_MANF_V | View built on MTL_MANUFACTURERS and MTL_MFG_PART_NUMBERS |
| MTL_ITEM_ENDECA_ONHAND_V | View built on MTL_SYSTEM_ITEMS_B, Mtl_Onhand_Quantities_Detail and Mtl_Reservations |
| MTL_ITEM_ENDECA_REVISIONS_V | View build on Mtl_Item_Revisions_B |
| INV_EID_UNPICKED_DETAILS_V | View for full load of unpicked details. Data loaded from this view into 'inv-pf' Endeca Datastore displays in the Plan Fulfillment page. |
| INV_EID_RESERVATIONS_V | View for full load of reservations. Data loaded from this view into 'inv-pf' Endeca Datastore displays in the Plan Fulfillment page. |
| INV_EID_PICKED_DETAILS_V | View for full load of picked but unfulfilled details. Data loaded from this view into 'inv-tf' Endeca Datastore displays in the Track Fulfillment page. |
| INV_EID_ONHAND_DETAILS_V | View for full load of on-hand item and locator fragmented data. Data loaded from this view into 'inv-su' Endeca Datastore displays in the Space Utilization page. |
| INV_EID_MTL_TRANSACTIONS_V | View for full load of material transactions. Data loaded from this view into 'inv-su' Endeca Datastore displays in the Space Utilization page. |
| INV_EID_UNPICKED_DET_INCR_V | View for incremental load of unpicked details. |
| INV_EID_PICKED_DETAILS_INCR_V | View for incremental load of picked details. |
The Metrics Component aggregates and displays the total counts for the following item metrics:
Organizations
Items
Manufactured Items
Stockable Items
Purchased Items
Customer Ordered Items
Shippable Items
Service Items
Asset Items
Pending Revisions

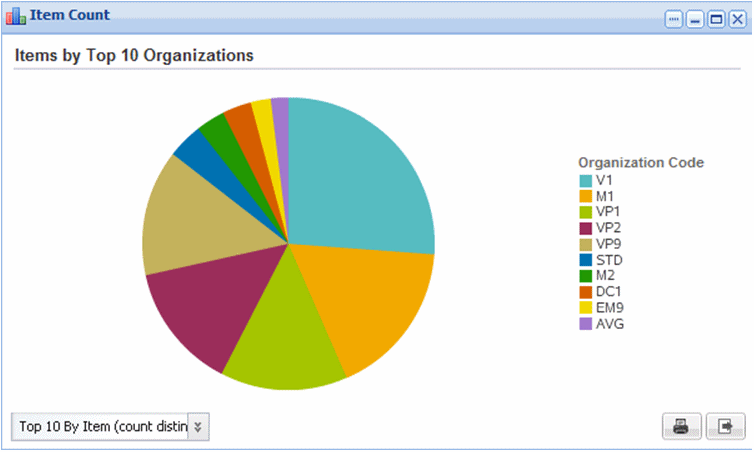
The Browse Transactions Attributes - Overview - Items by Top 10 Organizations pie chart displays the total count of items in the top ten inventory organizations.
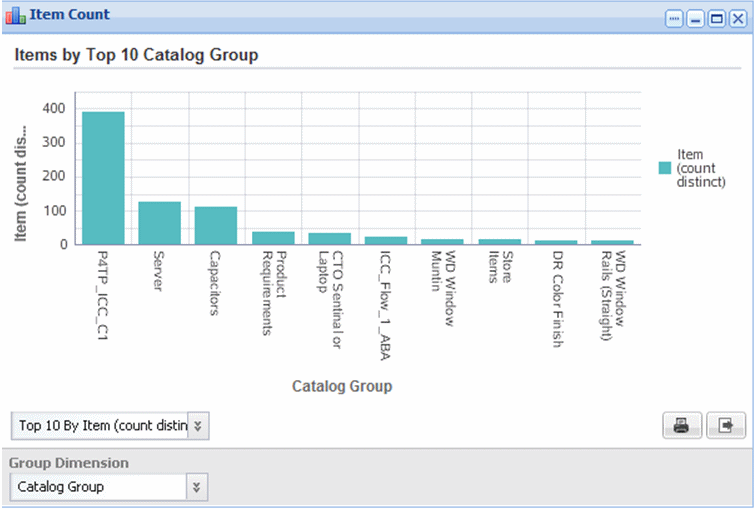
The Browse Transactions Attributes - Overview - Items by Top 10 Catalog Group bar chart displays the count of items in the top ten catalog groups.
The Top 10 Item Revision Reason tag cloud component displays the top ten item functions.

The Browse Transactions Attributes - Attributes - Item Count by Item Status cross tab chart component displays item count grouped by item function and item Status.

The Top 10 Item Revision Reason tag cloud component displays the top ten item revision reasons.

The Top 10 Approved Suppliers tag cloud component displays the top ten approved suppliers having the highest number of items.

The Approved Supplier Count by Top 10 Organizations cross tab chart displays the count of approved suppliers in the top ten organizations having the highest number of items.

The Top 10 Approved Manufacturers tag cloud displays the top ten approved manufacturers with the highest number of items.

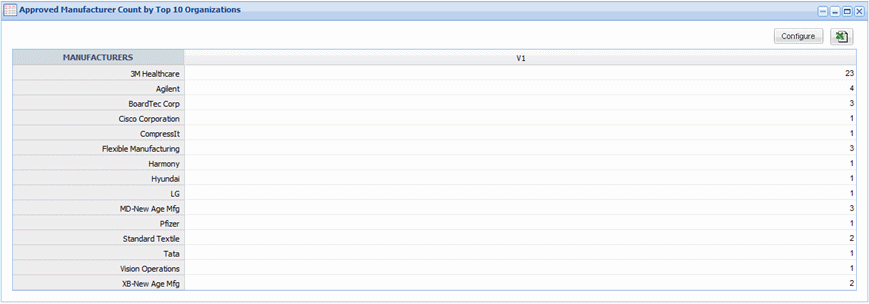
The Approved Manufacturers Count by Top 10 Organizations cross tab chart displays the count of approved manufacturers in the top ten organizations having the highest number of items.
The Top 10 Item Relationship Types tag cloud component displays the top ten item relationship types.

The Related Item Count by Top 10 Organizations cross tab chart displays the count of related items in the top ten organizations having the highest number of items.

The Top 10 Cross Reference Types tag cloud component displays the top ten item cross reference types.

The Item Cross Reference Count by Top 10 Organizations cross tab chart displays the count of item cross references in the top ten organizations having the highest number of items.

The Item Top 10 Inventory Categories tag cloud displays the top ten inventory categories.

The Item Category Assignment by Top 10 Organizations cross tab chart displays the count of item category assignments in the top ten organizations having the highest number of items.

![]()
Copyright © 2012, 2014, Oracle and/or its affiliates. All rights reserved.