 Read more...
A thematic map represents business data as patterns in stylized areas or associated markers and does not require a connection to a remote Oracle MapViewer service. Thematic maps focus on data without the geographic details in a geographic map.
For this new graphical component you need to create the appropriate databound component. To create the View Object and add it as data control, perform the following steps:
-
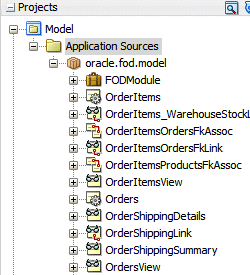
Expand the Model node in the Application Navigator.
-
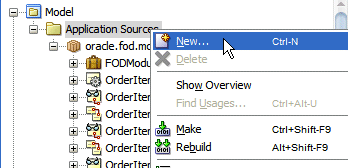
Right-click the Application Sources node and select New from context..
-
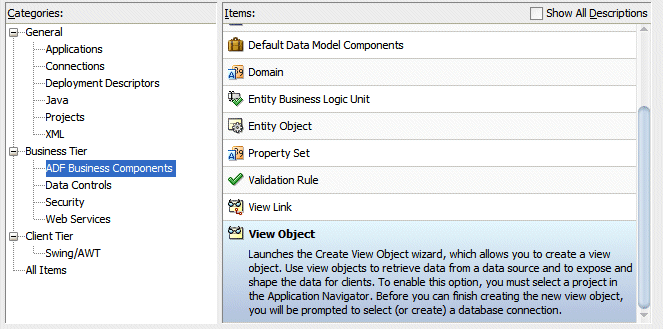
In the New Gallery, select the Business Tier | ADF Business Components category, and the View Object item.
Click OK.
-
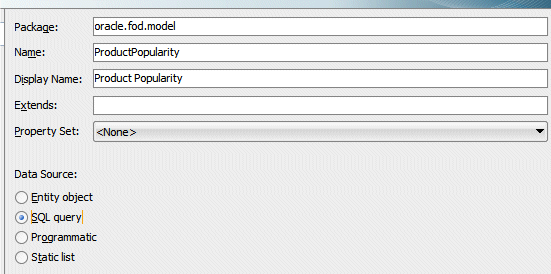
In the Create View Object dialog, enter ProductPopularity as the name and select SQL Query as Data Source.
Click Next.
-
In the Create View Object dialog, in the Query pane, enter the following SQL statement for the view object:
SELECT addresses.state_province,
count(addresses.STATE_PROVINCE) as "Product Popularity Index"
FROM products_base, orders, order_items, addresses
WHERE products_base.product_id = order_items.product_id and
products_base.CATEGORY_ID =
(SELECT products_base.category_id
FROM products_base
WHERE products_base.product_id = '1') and
orders.SHIP_TO_ADDRESS_ID = addresses.ADDRESS_ID and
orders.order_id = order_items.ORDER_ID and
addresses.COUNTRY_ID = 'US'
GROUP BY addresses.STATE_PROVINCE
ORDER BY "Product Popularity Index" desc
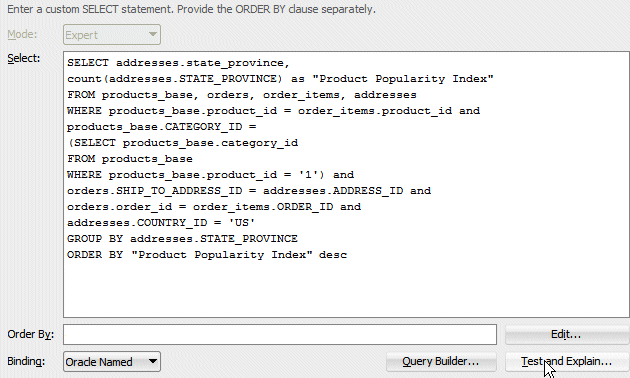 Using the Order By field.
 Read more...
You can specify the ORDER BY criteria within the Select text as well as using the ORDER BY field.
The above query counts items that are the most frequently present in customer's orders. -
Click the Test and Explain button to verify the SQL Statement.
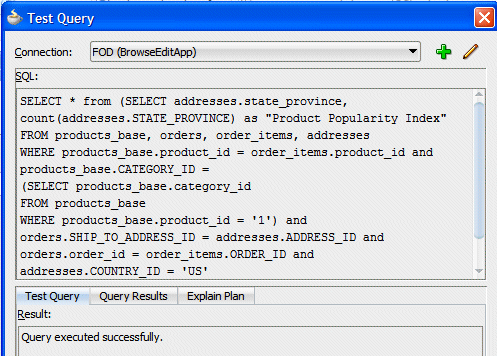
Click Close.
-
Click Next up to the Application Module (Step 8 of 9).
Check the Add to Application Module option. It should default to FODModule application module name.
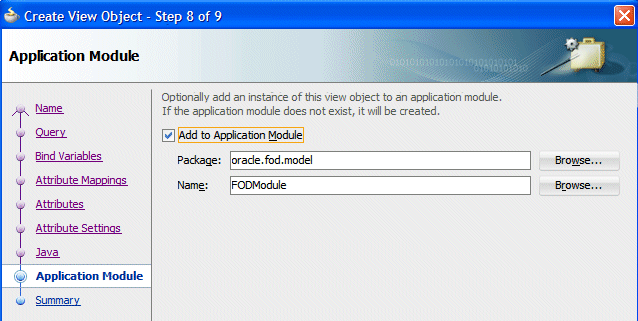
Click Finish.
-
The new view object appears in the Application Navigator.
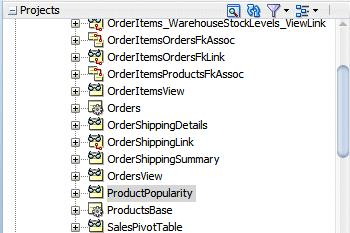
-
Click the Save All
 icon to save your work.
 -
Right-click the FODModule and select Run from context .
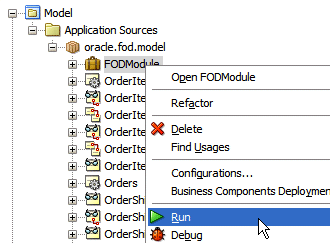 Running the Application Module allows you to validate the new View Object and see what the expected results can be.
-
In the Business Component Browser, double-click ProductPopularity1 to open it in the Running pane.
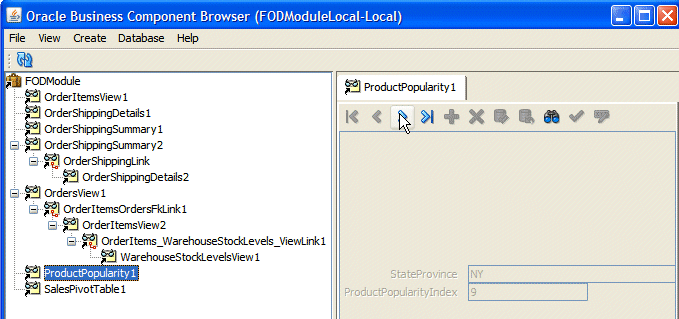
Click the Next icon to scroll through records, then close your browser window.
 -
Open the Data Controls accordion and click Refresh.

This refresh action is not always necessary but it will ensure that the new Business Components added to an Application Module appears in the Data Controls pane. -
The new Data Control is now ready for use.
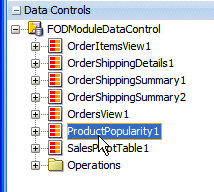
-
Click the OrdersAndStocks.jsf tab to open the page in the design editor.

-
Right-click within the OrdersPlanning tab and select Insert after Show Detail Item --> Show Detail Item.

-
In the Property Inspector, for the Show Detail Item, change the text to Product Popularity.
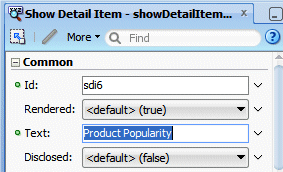
-
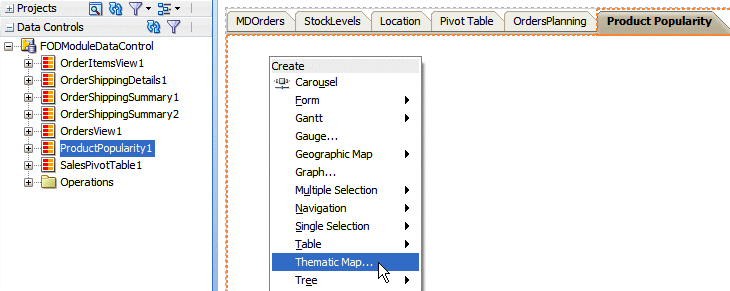
From the Data Controls accordion, select ProductPopularity1, then drag and drop it onto the Product Popularity page. From context, select Thematic Map.
-
In the Component Gallery dialog, select the USA states image.
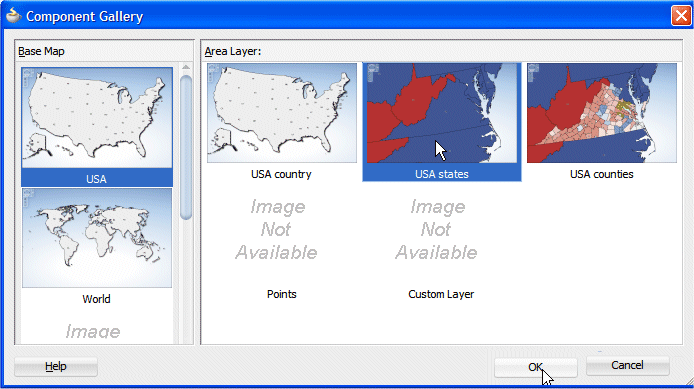
Click OK.
-
In the Create Data Layer dialog, select StateProvince from the Location dropdown list.
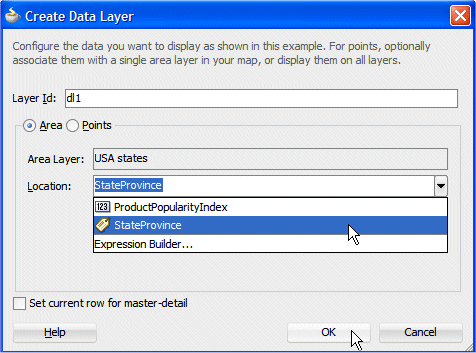
Click OK.
-
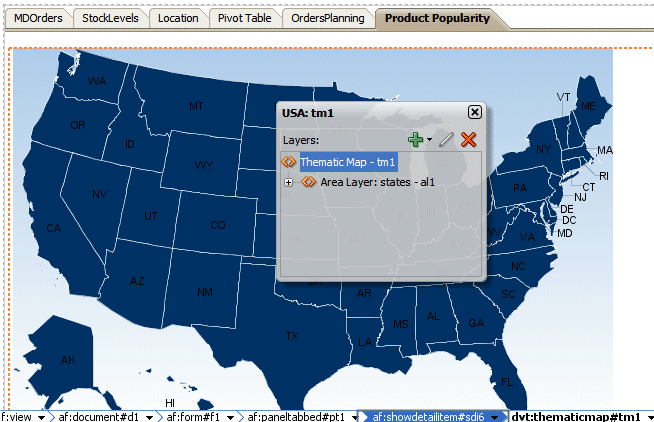
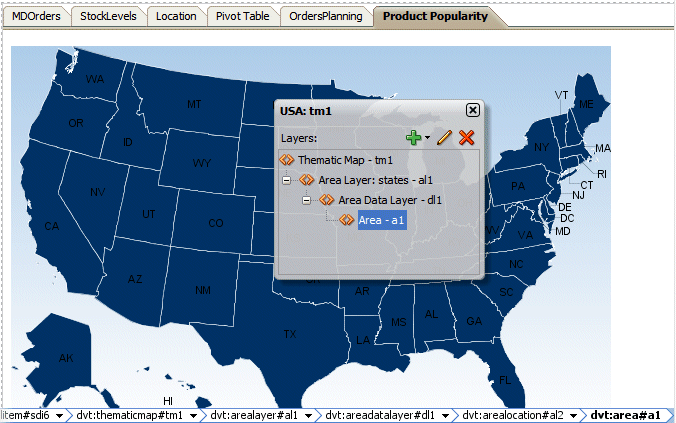
The State map displays in the design editor with the thematic map popup.
-
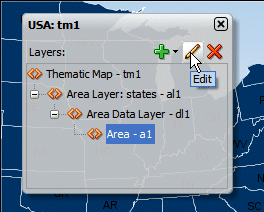
In the Thematic map popup, expand the Area nodes and selecting the Area - a1 one, click the Edit icon
 to open it.
-
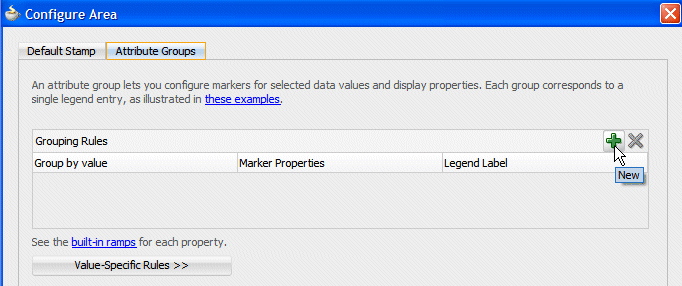
In the Configure Area dialog, select the Attribute Groups tab and click the New icon to create a grouping rule.
-
From the dropdown lists, select ProductPopularityIndex for the Group by value attribute and for the Legend Label attribute.

Click OK.
-
The page should look like the following:
-
Click the Save All icon
 to save your work and click the Run button
  to launch the page in your browser.
 -
In the Browser window, click the Product Popularity tab.

-
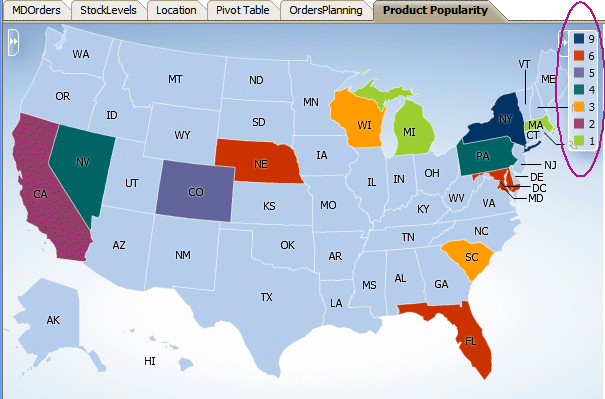
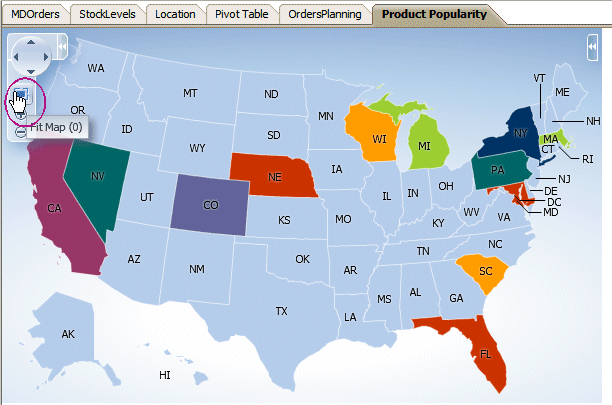
The state maps displays product popularity with the color legend on the top right corner indicating the number of times a product was specified in orders independently of the quantity ordered.
-
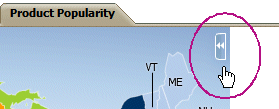
You can hide the legend too.
-
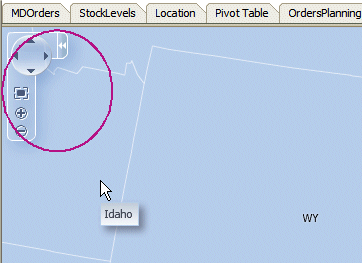
Try the Navigation toolbar by opening the toolbar in the upper left corner, allowing you to move, rotate or zoom in and out within the map.
-
Click the Fit Map icon to return to the general view.
-
Close your browser window now.
You've successfully completed this tutorial.
- Use a Model and Build a page upon it
- Start using Graphic components, like Bar Chart and Gauge
- Add other complex graphical presentations like Geographic Map, Pivot Table and Gantt Chart
- Use Thematic Map component

 Part 1: Validating the Model and Starting Building the UI